Copyright 2000: James R. Evans. For use exclusively with The Management and Control of Quality, 5th Edition or higher.
This software may not be used for any commercial purpose, modified, or or otherwise distributed without written permission from the author.
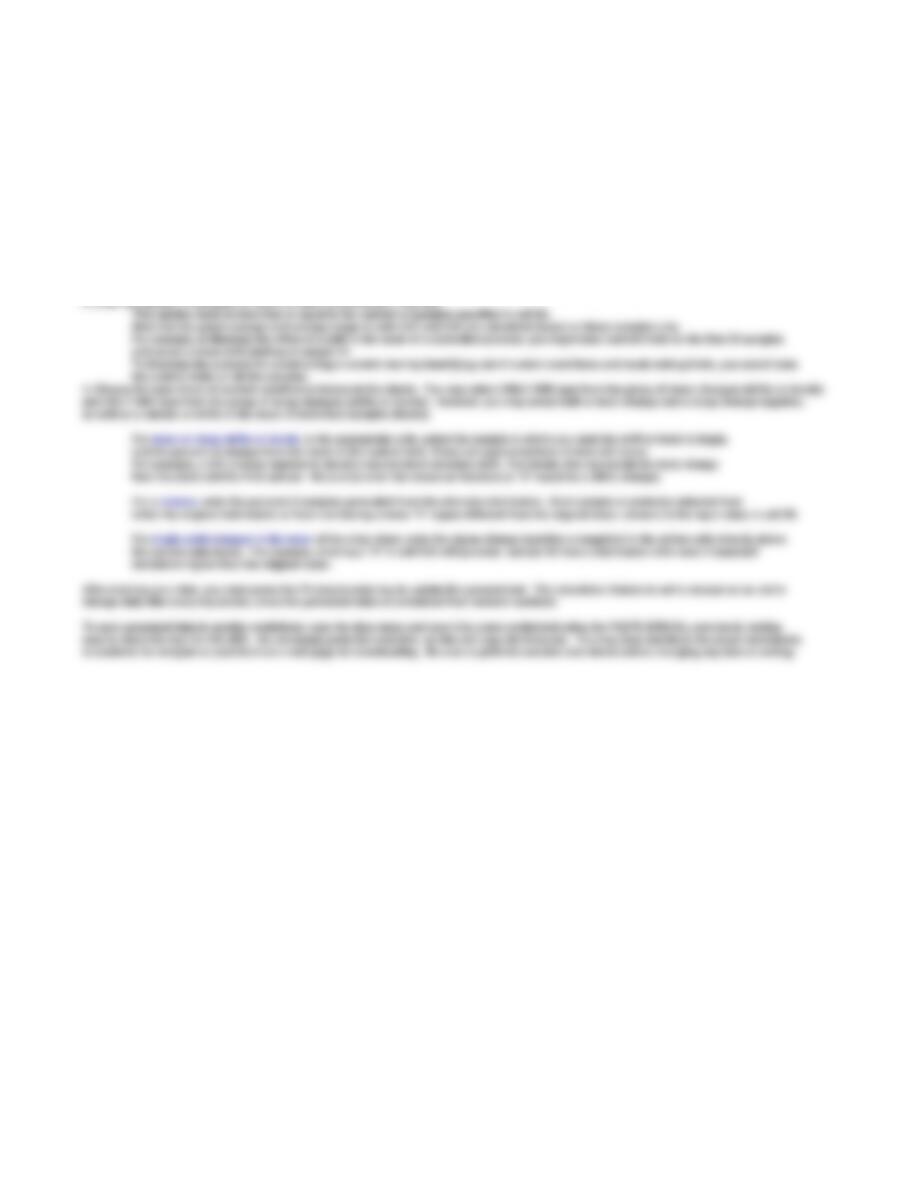
This Excel template allows you to simulate control charts having a variety of out of control conditions.
The template has three primary worksheets: Data and calculations, x-bar chart, and R-chart. Click on the appropriate tabs.
Enter data ONLY in yellow-shaded cells. Do not change the formulas in any other cell.
1. Enter the number of samples, sample size, and number of decimal places in the range E3:E5.
You may generate up to 50 samples with sample sizes of 2 to 10, with a specified number of decimal places (1 or 2 recommended).
Larger number of decimal places will require changing the cell widths.
2. Enter a desired process capability index (Cp) and upper and lower specification limits in the range L3:L5
The mean and standard deviation of individual observations are calculated from these parameters.
The nominal mean is (USL+LSL)/2; sigma = (USL-LSL)/(6*Cp)
This also allows you to generate data for process capability analysis exercises with known characteristics.
X-bar and R-Chart Simulation
3. Enter the number of samples on which to base control limits in cell W3.
Note that the grand average and average range in cells C27 and C28 are calculated based on these samples only.
and cause a mean shift starting at sample 31.
To illustrate the analysis for constructing a control chart by identifying out of control conditions and recalculating limits, you would base
4. Choose the type of out of control condition to induce in the charts. You may select ONLY ONE type from the group of mean changes (shifts or trends),
as well as a mixture or shifts in the mean of individual samples (freaks).
and the percent of change from the mean to the control limit. These are approximations of what will occur.
from the start until the final sample. Be sure to enter the values as fractions (a “3” would be a 300% change).
either the original distribution or from one having a mean “k” sigma different from the original mean, where k is the input value in cell X9.
the sample data labels. For example, entering a “2” in cell K32 will generate sample 10 from a distribution with mean 2 standard
After entering your data, you must press the F9 (recalculate) key to update the spreadsheet. The calculation feature is set to manual so as not to
change data after every key stroke, since the generated data are simulated from random numbers.
to students for analysis or post them on a web page for downloading. Be sure to print the solution and charts before changing any data or exiting.
1
2
3
4
5
6
7
8
9
10
11
12
13
14
15
53
54
55
56
57
58
59
60
61
62
63
64
65
66
67
68
69
70
71
72
73
74
75
76
77
78
79
80
81
82
83
84
85
86
3
1.023
0
2.57
1.69
1.95
0
2.57
4
0.729
0
2.28
2.06
1.63
0
2.27
5
0.577
0
2.11
2.33
1.43
0
2.09
6
0.483
0
2
2.53
1.29
0.03
1.97
7
0.419
0.08
1.92
2.7
1.18
0.12
1.88
8
0.373
0.14
1.86
2.85
1.1
0.19
1.82
9
0.337
0.18
1.82
2.97
1.03
0.24
1.76
A B C D E F G H I J K L M N O P Q R S T U V W X Y Z AA AB AC AD AE AF AG AH AI AJ AK AL AM AN AO AP AQ AR AS AT AU AV AW AX AY
Number of samples (<= 50)
25
Process Capability (Cp)
1.5
Number of samples on which to base control limits
25
7
Upper specification
10
1
Lower specification
2
Sample at which shift begins
Sample at which trend begins
Percent of samples
Percent of shift from mean to control limit
Percent of trend from mean to control limit
Sigma change in mean
Calculated mean
Base calculation
Sample at which shift begins
Sample at which trend begins
Percent of shift from mean to control limit
Percent of trend from mean to control limit
Calculated mean
Base calculation
DO NOT MODIFY THIS TABLE
n
A2
D3
D4
d2
A3
B3
B4
2
1.88
0
3.27
1.13
2.66
0
3.27
Control Chart Factors
Sample size (2 – 10)
#VALUE!
#VALUE!
IMPORTANT! PRESS F9 TO UPDATE SPREADSHEET
Mean shift up Mean trend up
Mean shift down
X-bar and R-Chart Simulation
Number of decimal places
#VALUE!
Mixture
Mean trend down
#VALUE!
16
17
18
19
20
21
22
23
24
26
27
28
29
30
31
32
33
34
35
36
37
38
40
42
43
44
45
46
48
50
51
Sample at which shift begins
Sample at which trend begins
Percent of shift from mean to control limit
Percent of trend from mean to control limit
Base calculation
Base calculation
Sample at which shift begins
Sample at which trend begins
Grand Average
Average Range
6
6
6
6
6
6
6
6
6
6
6
6
6
6
6
6
6
6
6
6
6
6
6
6
6
6
6
6
6
6
6
6
6
6
6
6
6
6
6
6
6
6
6
6
6
6
6
6
6
6
Std. Dev.
Shift
1
3.8
7.1
6.9
5.2
5.2
6
6.4
6.6
5.3
6.4
7.3
5
6.9
5.8
5.6
5.1
6
5.5
4.9
4.7
6.2
5
5.6
5.8
6.4
#N/A
#N/A
#N/A
#N/A
#N/A
#N/A
#N/A
#N/A
#N/A
#N/A
#N/A
#N/A
#N/A
#N/A
#N/A
#N/A
#N/A
#N/A
#N/A
#N/A
#N/A
#N/A
#N/A
#N/A
#N/A
6.3
5.2
6.5
6.2
7.4
6.6
6.6
5.4
7.1
6.7
5.1
5.3
6.8
6
6
6.3
6.5
6.2
5.3
5.4
6.3
6
6.3
7.6
5.6
#N/A
#N/A
#N/A
#N/A
#N/A
#N/A
#N/A
#N/A
#N/A
#N/A
#N/A
#N/A
#N/A
#N/A
#N/A
#N/A
#N/A
#N/A
#N/A
#N/A
#N/A
#N/A
#N/A
#N/A
#N/A
5.8
6.4
6.9
7.2
4.5
6.2
5.3
4.9
6.5
6.2
6.8
3.8
5.7
5.8
5.7
8.2
5
7.5
7
6.3
5.8
5.1
5.4
6.1
4.6
#N/A
#N/A
#N/A
#N/A
#N/A
#N/A
#N/A
#N/A
#N/A
#N/A
#N/A
#N/A
#N/A
#N/A
#N/A
#N/A
#N/A
#N/A
#N/A
#N/A
#N/A
#N/A
#N/A
#N/A
#N/A
7.4
6.6
5.6
6.8
5.5
5.2
6
5
6.1
7.4
5.3
6.3
5.9
4.8
5.4
4.7
6.1
5.9
5.3
7
4.7
7.2
4.7
6.1
6.4
#N/A
#N/A
#N/A
#N/A
#N/A
#N/A
#N/A
#N/A
#N/A
#N/A
#N/A
#N/A
#N/A
#N/A
#N/A
#N/A
#N/A
#N/A
#N/A
#N/A
#N/A
#N/A
#N/A
#N/A
#N/A
5
6.9
6.5
6.5
7.8
6.4
6.6
5.2
6.5
5
6.2
5.4
5.4
6
4.3
7.1
4.9
6.7
5.8
6.5
5.7
5.9
5.6
5.6
7.7
5.3
#N/A
#N/A
#N/A
#N/A
#N/A
#N/A
#N/A
#N/A
#N/A
#N/A
#N/A
#N/A
#N/A
#N/A
#N/A
#N/A
#N/A
#N/A
#N/A
#N/A
#N/A
#N/A
#N/A
#N/A
#N/A
7
5.6
6
5.9
5.8
5
5
6
6.5
7.4
6.8
5
5.7
6.1
6
5.9
4.9
5.5
5.1
7.3
6.4
5.3
6.5
5.7
6.7
5.2
#N/A
#N/A
#N/A
#N/A
#N/A
#N/A
#N/A
#N/A
#N/A
#N/A
#N/A
#N/A
#N/A
#N/A
#N/A
#N/A
#N/A
#N/A
#N/A
#N/A
#N/A
#N/A
#N/A
#N/A
#N/A
9
#N/A
#N/A
#N/A
#N/A
#N/A
#N/A
#N/A
#N/A
#N/A
#N/A
#N/A
#N/A
#N/A
#N/A
#N/A
#N/A
#N/A
#N/A
#N/A
#N/A
#N/A
#N/A
#N/A
#N/A
#N/A
#N/A
#N/A
#N/A
#N/A
#N/A
#N/A
#N/A
#N/A
#N/A
#N/A
#N/A
#N/A
#N/A
#N/A
#N/A
#N/A
#N/A
#N/A
#N/A
#N/A
#N/A
#N/A
#N/A
#N/A
#N/A
#N/A
#N/A
#N/A
#N/A
#N/A
#N/A
#N/A
#N/A
#N/A
#N/A
#N/A
#N/A
#N/A
#N/A
#N/A
#N/A
#N/A
#N/A
#N/A
#N/A
#N/A
#N/A
#N/A
#N/A
#N/A
#N/A
#N/A
#N/A
#N/A
#N/A
#N/A
#N/A
#N/A
#N/A
#N/A
#N/A
#N/A
#N/A
#N/A
#N/A
#N/A
#N/A
#N/A
#N/A
#N/A
#N/A
#N/A
#N/A
#N/A
#N/A
3
3.5
4
4.5
7.5
1 3 5 7 9 11 13 15 17 19 21 23 25 27 29 31 33 35 37 39 41 43 45 47 49
Sample number
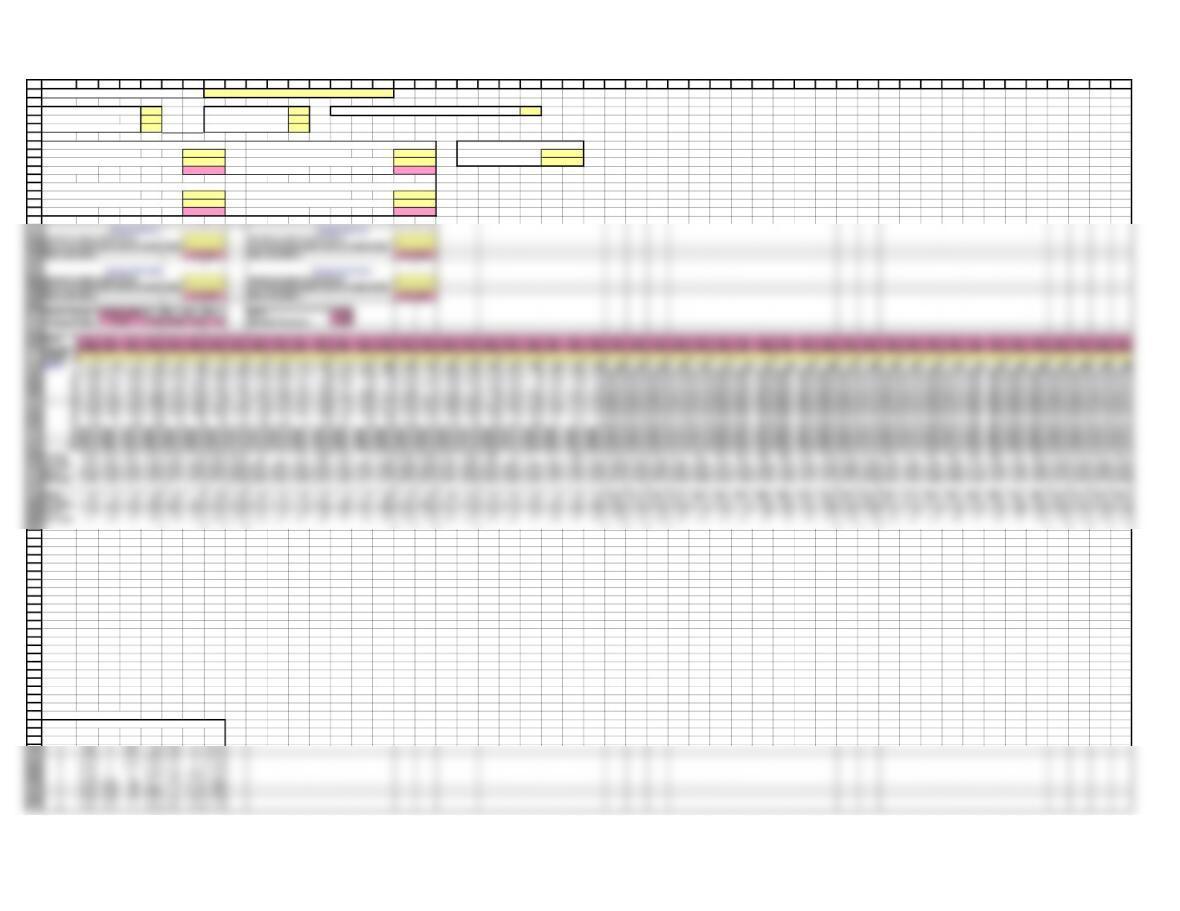
X-bar Chart
Averages
Lower control limit
Upper control limit
Center line
4
4.5
1 3 5 7 9 11 13 15 17 19 21 23 25 27 29 31 33 35 37 39 41 43 45 47 49
Sample number
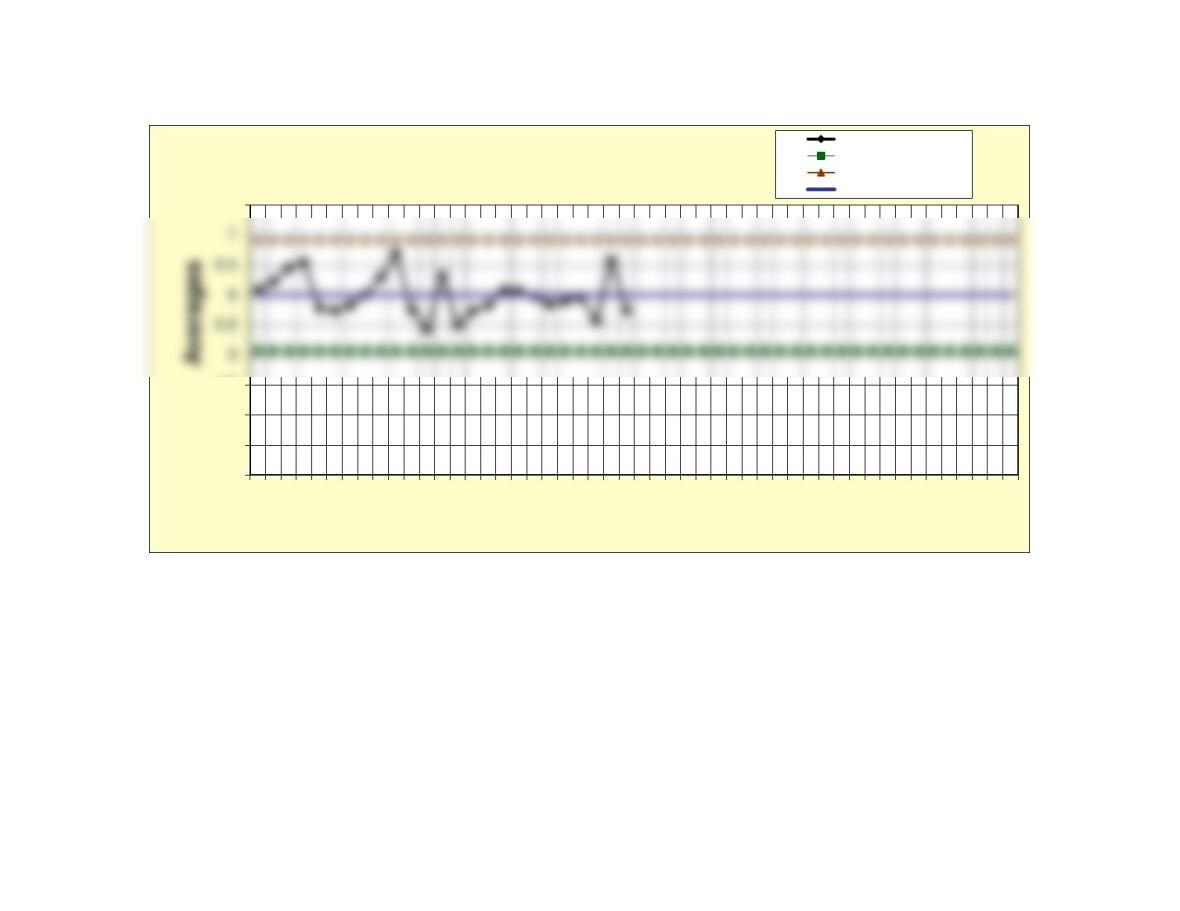
R-Chart Ranges
Lower control limit
Upper control limit
Center line