This spreadsheet is designed for up to 50 samples, each of a constant sample size from 2 to 10. Enter data ONLY in yellow-shaded cells.
Enter the number of samples in cell E6 and the sample size in cell E7. Then enter your data in the grid below.
Click on sheet tabs for a display of the control charts. Specification limits may be entered in cells N7 and N8 for process capability.
Number of samples (<= 50) 30 Process Capability Calculations Six sigma 0.04383
5Upper specification 25.53 1.36878
Lower specification 25.47 1.40589
Grand Average A2 D3 D4 1.33167
Average Range 0.577 02.114 1.33167
DATA 1 2 3 4 5 6 7 8 9 10 11 12 13 14 15 16 17 18 19 20 21 22 23 24 25 26 27 28 29 30 31 32 33 34 35 36 37 38 39 40 41 42 43 44 45 46 47 48 49 50
125.505 25.498 25.493 25.496 25.499 25.497 25.502 25.498 25.482 25.492 25.499 25.500 25.504 25.503 25.499 25.499 25.492 25.498 25.499 25.505 25.481 25.497 25.514 25.474 25.502 25.504 25.498 25.500 25.504 25.506
8
9
10
Average
25.4994 25.5016 25.5 25.4986 25.5 25.4994 25.502 25.4996 25.482 25.503 25.5 25.5018 25.497 25.503 25.5022 25.5004 25.501 25.4972 25.502 25.502 25.486 25.4964 25.504 25.4902 25.5 25.5028 25.4974 25.5006 25.5028 25.5042 #N/A #N/A #N/A #N/A #N/A #N/A #N/A #N/A #N/A #N/A #N/A #N/A #N/A #N/A #N/A #N/A #N/A #N/A #N/A #N/A
LCLx-bar
25.49134 25.4913 25.491 25.4913 25.491 25.4913 25.49134 25.49134 25.491 25.4913 25.491 25.49134 25.4913 25.491 25.4913 25.49134 25.49134 25.4913 25.491 25.4913 25.4913 25.4913 25.491 25.4913 25.4913 25.49134 25.4913 25.4913 25.4913 25.4913 25.49 25.49 25.49 25.49 25.49 25.49 25.49 25.49 25.49 25.49 25.49 25.49 25.49 25.49 25.49 25.49 25.49 25.49 25.49 25.49
Center
25.49919 25.4992 25.499 25.4992 25.499 25.4992 25.49919 25.49919 25.499 25.4992 25.499 25.49919 25.4992 25.499 25.4992 25.49919 25.49919 25.4992 25.499 25.4992 25.4992 25.4992 25.499 25.4992 25.4992 25.49919 25.4992 25.4992 25.4992 25.4992 25.5 25.5 25.5 25.5 25.5 25.5 25.5 25.5 25.5 25.5 25.5 25.5 25.5 25.5 25.5 25.5 25.5 25.5 25.5 25.5
25.50703 25.507 25.507 25.507 25.507 25.507 25.50703 25.50703 25.507 25.507 25.507 25.50703 25.507 25.507 25.507 25.50703 25.50703 25.507 25.507 25.507 25.507 25.507 25.507 25.507 25.507 25.50703 25.507 25.507 25.507 25.507 25.51 25.51 25.51 25.51 25.51 25.51 25.51 25.51 25.51 25.51 25.51 25.51 25.51 25.51 25.51 25.51 25.51 25.51 25.51 25.51
DO NOT MODIFY THIS TABLE
nA2 D3 D4 d2 A3 B3 B4
21.88 03.267 1.128 2.659 03.267
31.023 02.574 1.693 1.954 02.568
40.729 02.282 2.059 1.628 02.266
50.577 02.114 2.326 1.427 02.089
60.483 02.004 2.534 1.287 0.03 1.97
70.419 0.076 1.924 2.704 1.182 0.118 1.882
80.373 0.136 1.864 2.847 1.099 0.185 1.815
90.337 0.184 1.816 2.97 1.032 0.239 1.761
Cp
Cpu
Cpl
Cpk
Control Chart Factors
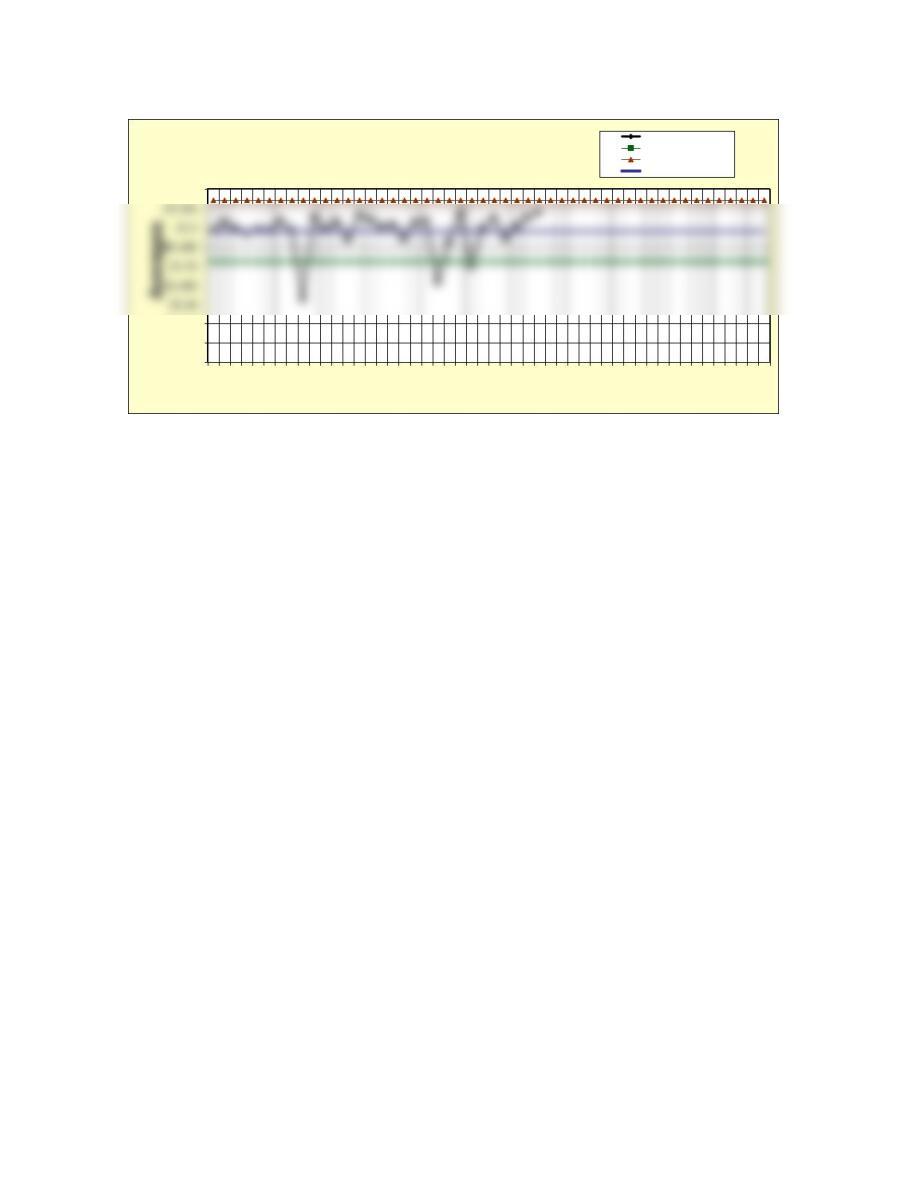
X-bar and R-Chart
Sample size (2 – 10)
25.49918667
0.0136
225.498 25.506 25.500 25.496 25.498 25.500 25.500 25.497 25.485 25.504 25.495 25.495 25.500 25.501 25.503 25.495 25.498 25.500 25.501 25.500 25.498 25.499 25.505 25.481 25.496 25.498 25.497 25.506 25.510 25.504
325.493 25.495 25.503 25.496 25.506 25.500 25.508 25.503 25.484 25.510 25.500 25.509 25.495 25.500 25.502 25.507 25.506 25.500 25.502 25.503 25.482 25.501 25.512 25.505 25.507 25.506 25.511 25.494 25.498 25.508
425.501 25.509 25.511 25.505 25.501 25.489 25.500 25.502 25.466 25.500 25.499 25.502 25.497 25.500 25.504 25.499 25.507 25.495 25.501 25.499 25.484 25.497 25.494 25.499 25.491 25.503 25.494 25.497 25.504 25.499
525.500 25.500 25.493 25.500 25.495 25.511 25.500 25.498 25.491 25.509 25.505 25.503 25.489 25.513 25.503 25.502 25.502 25.493 25.505 25.503 25.485 25.488 25.495 25.492 25.504 25.503 25.487 25.506 25.498 25.504
6
7
25.465
25.47
25.475
25.51
1 3 5 7 9 11 13 15 17 19 21 23 25 27 29 31 33 35 37 39 41 43 45 47 49
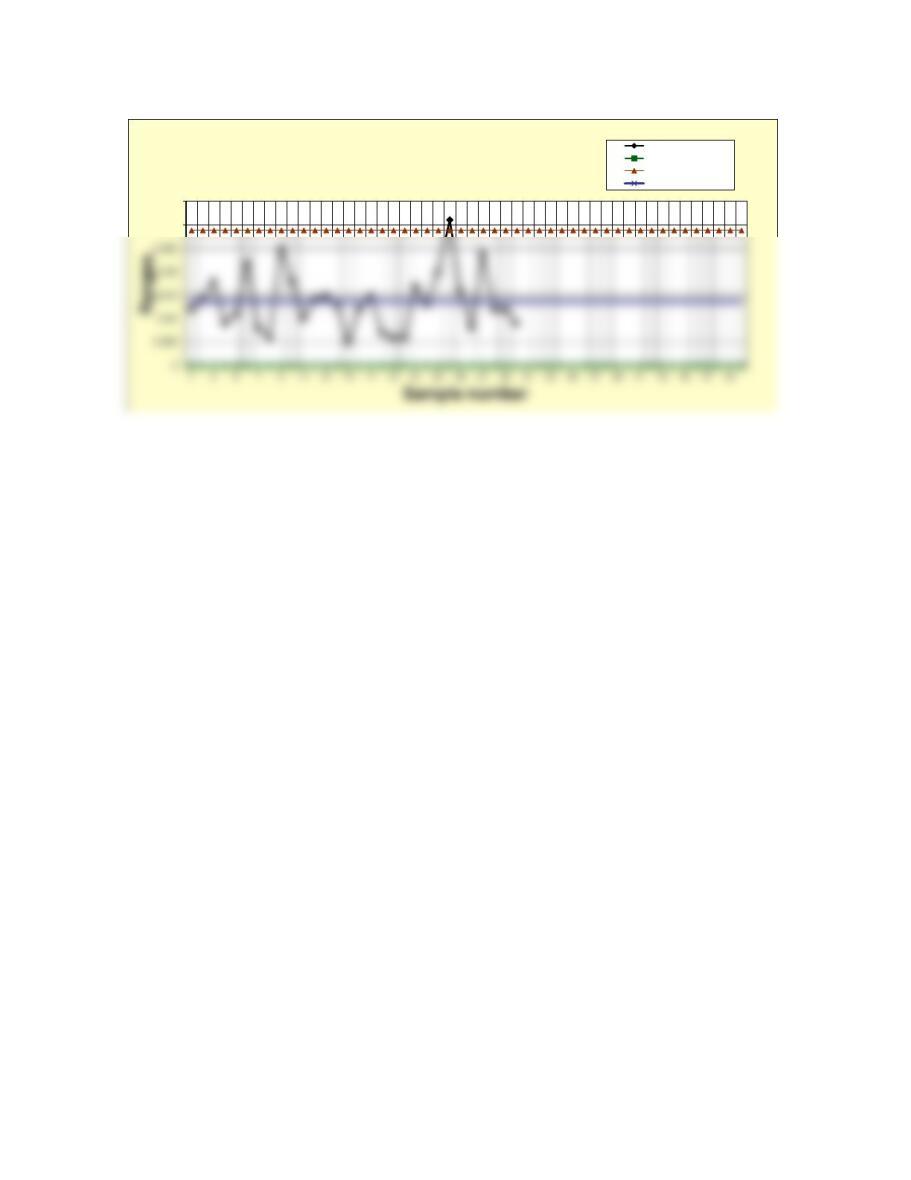
Sample number
X-bar Chart Averages
Lower control limit
Upper control limit
Center line
0.03
0.035
R-Chart Ranges
Lower control limit
Upper control limit
Center line