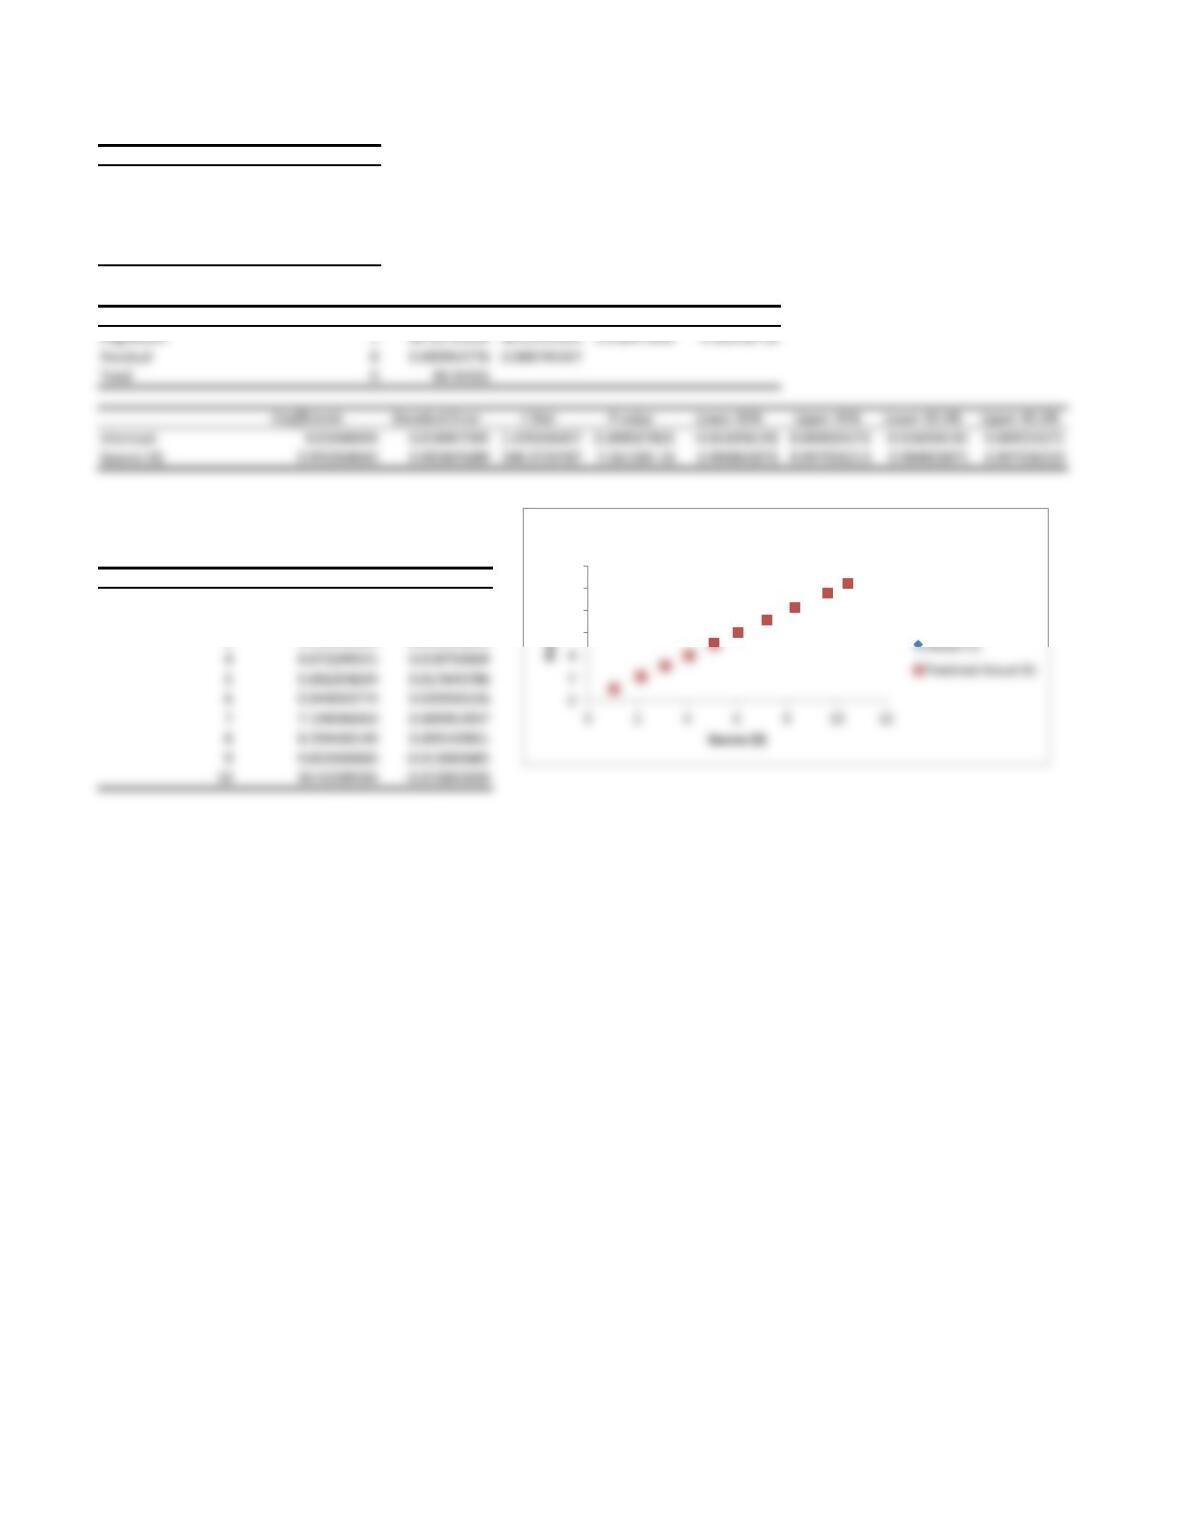
SUMMARY OUTPUT
Regression Statistics
Multiple R 0.999967043
R Square 0.999934087
Adjusted R Square 0.999925848
Standard Error 0.027282724
Observations 10
ANOVA
df SS MS F Significance F
RESIDUAL OUTPUT
Observation Predicted Actual (Y) Residuals
1 1.067416284 0.022583716
2 2.15791673 -0.03791673
3 3.119539851 -0.039539851
6
8
10
12
Source (X) Line Fit Plot
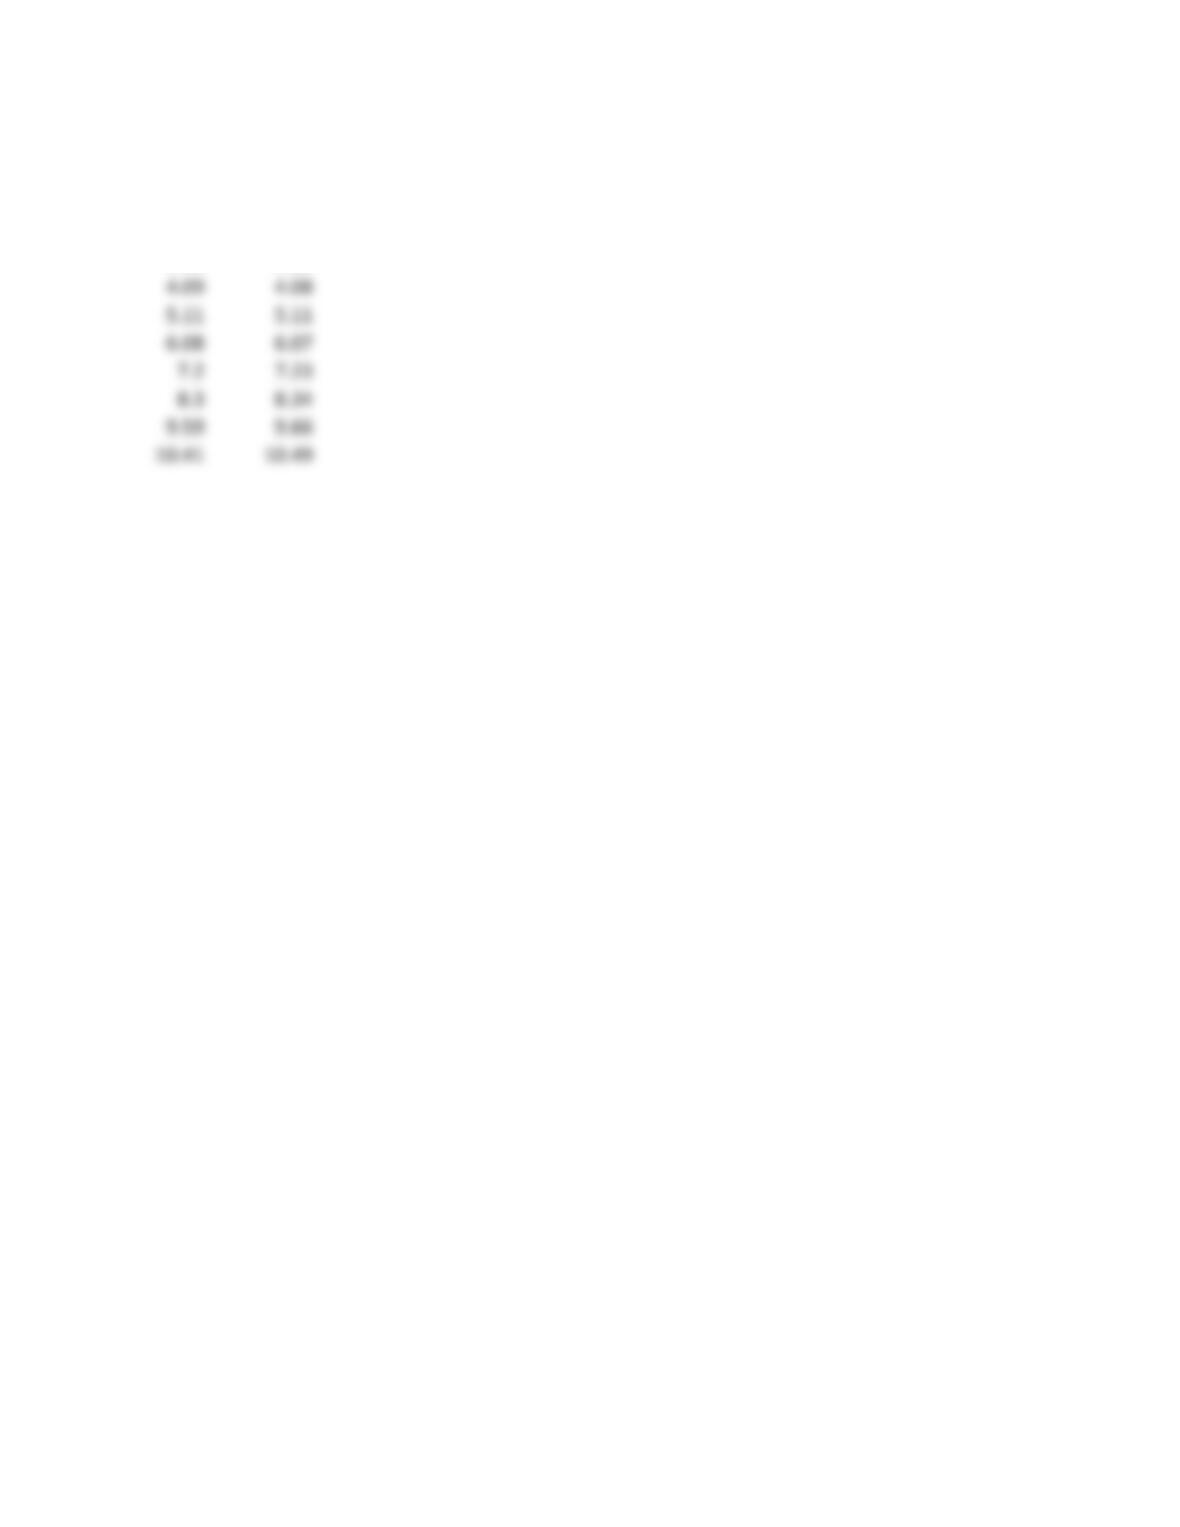
Voltmeter Calibration Data
Actual (Y) Source (X)
1.09 1.05
2.12 2.15
3.08 3.12
4.09 4.08
5.11 5.11
6.08 6.07
9.59 9.66