Fraction Nonconforming (p) Chart
This spreadsheet is designed for up to 50 samples. Enter data ONLY in yellow-shaded cells.
Click on the sheet tab to display the control chart (some rescaling may be needed).
Average (p-bar)
Avg. sample size
Approximate Control Limits Using
Sample Fraction Standard Average Sample Size Calculations
Sample Value Size Nonconforming Deviation LCLp CL UCLp LCLp CL UCLp
1 3 100 0.0300 0.014668 0 0.022 0.066 0 0.022 0.066005
2 1 100 0.0100 0.014668 0 0.022 0.066 0 0.022 0.066005
3 0 100 0.0000 0.014668 0 0.022 0.066 0 0.022 0.066005
4 0 100 0.0000 0.014668 0 0.022 0.066 0 0.022 0.066005
5 2 100 0.0200 0.014668 0 0.022 0.066 0 0.022 0.066005
6 5 100 0.0500 0.014668 0 0.022 0.066 0 0.022 0.066005
7 3 100 0.0300 0.014668 0 0.022 0.066 0 0.022 0.066005
8 6 100 0.0600 0.014668 0 0.022 0.066 0 0.022 0.066005
9 1 100 0.0100 0.014668 0 0.022 0.066 0 0.022 0.066005
10 4100 0.0400 0.014668 0 0.022 0.066 0 0.022 0.066005
23 1100 0.0100 0.014668 0 0.022 0.066 0 0.022 0.066005
24 0100 0.0000 0.014668 0 0.022 0.066 0 0.022 0.066005
25 1100 0.0100 0.014668 0 0.022 0.066 0 0.022 0.066005
26 #N/A #N/A #N/A #N/A #N/A #N/A #N/A #N/A
27 #N/A #N/A #N/A #N/A #N/A #N/A #N/A #N/A
28 #N/A #N/A #N/A #N/A #N/A #N/A #N/A #N/A
29 #N/A #N/A #N/A #N/A #N/A #N/A #N/A #N/A
30 #N/A #N/A #N/A #N/A #N/A #N/A #N/A #N/A
31 #N/A #N/A #N/A #N/A #N/A #N/A #N/A #N/A
32 #N/A #N/A #N/A #N/A #N/A #N/A #N/A #N/A
33 #N/A #N/A #N/A #N/A #N/A #N/A #N/A #N/A
34 #N/A #N/A #N/A #N/A #N/A #N/A #N/A #N/A
35 #N/A #N/A #N/A #N/A #N/A #N/A #N/A #N/A
36 #N/A #N/A #N/A #N/A #N/A #N/A #N/A #N/A
37 #N/A #N/A #N/A #N/A #N/A #N/A #N/A #N/A
38 #N/A #N/A #N/A #N/A #N/A #N/A #N/A #N/A
39 #N/A #N/A #N/A #N/A #N/A #N/A #N/A #N/A
40 #N/A #N/A #N/A #N/A #N/A #N/A #N/A #N/A
41 #N/A #N/A #N/A #N/A #N/A #N/A #N/A #N/A
42 #N/A #N/A #N/A #N/A #N/A #N/A #N/A #N/A
43 #N/A #N/A #N/A #N/A #N/A #N/A #N/A #N/A
44 #N/A #N/A #N/A #N/A #N/A #N/A #N/A #N/A
45 #N/A #N/A #N/A #N/A #N/A #N/A #N/A #N/A
46 #N/A #N/A #N/A #N/A #N/A #N/A #N/A #N/A
47 #N/A #N/A #N/A #N/A #N/A #N/A #N/A #N/A
48 #N/A #N/A #N/A #N/A #N/A #N/A #N/A #N/A
49 #N/A #N/A #N/A #N/A #N/A #N/A #N/A #N/A
50 #N/A #N/A #N/A #N/A #N/A #N/A #N/A #N/A
0.022
100
11 0100 0.0000 0.014668 0 0.022 0.066 0 0.022 0.066005
12 2100 0.0200 0.014668 0 0.022 0.066 0 0.022 0.066005
13 1100 0.0100 0.014668 0 0.022 0.066 0 0.022 0.066005
14 3100 0.0300 0.014668 0 0.022 0.066 0 0.022 0.066005
15 4100 0.0400 0.014668 0 0.022 0.066 0 0.022 0.066005
16 1100 0.0100 0.014668 0 0.022 0.066 0 0.022 0.066005
17 1100 0.0100 0.014668 0 0.022 0.066 0 0.022 0.066005
18 2100 0.0200 0.014668 0 0.022 0.066 0 0.022 0.066005
19 5100 0.0500 0.014668 0 0.022 0.066 0 0.022 0.066005
20 2100 0.0200 0.014668 0 0.022 0.066 0 0.022 0.066005
21 3100 0.0300 0.014668 0 0.022 0.066 0 0.022 0.066005
22 4100 0.0400 0.014668 0 0.022 0.066 0 0.022 0.066005
0.0600
0.0700
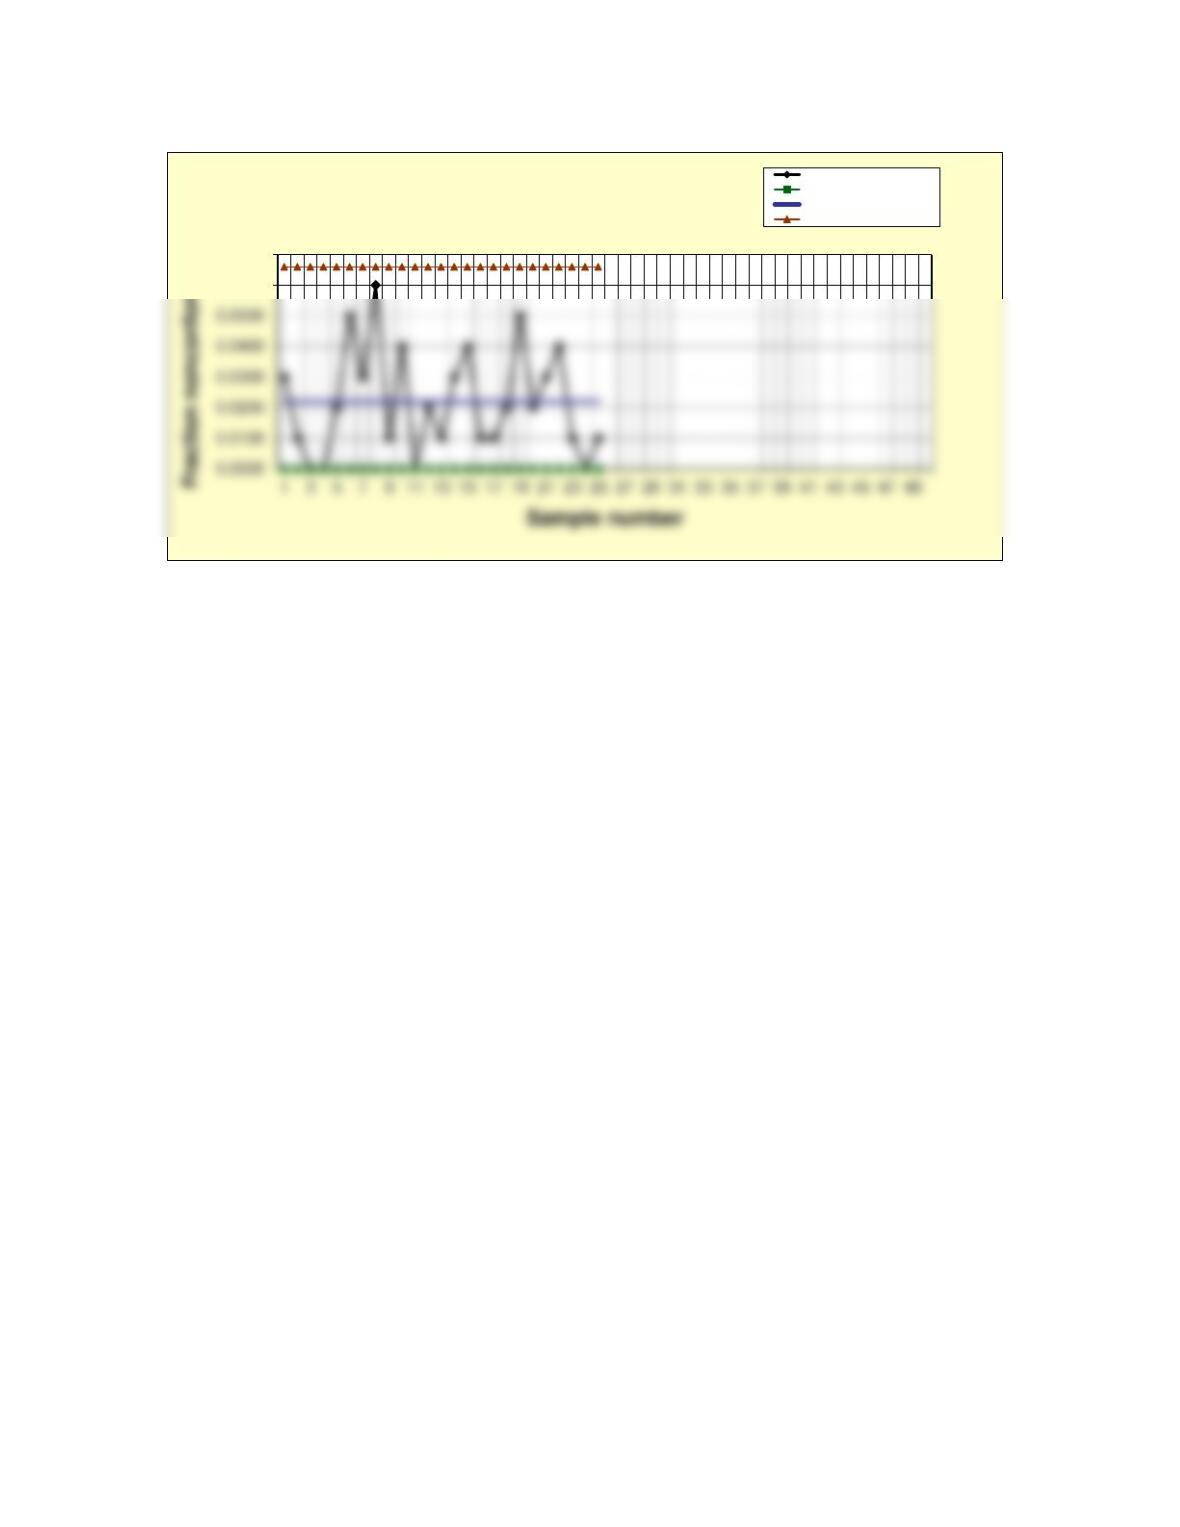
Attribute (p) Chart Fraction nonconforming
Lower control limit
Center line
Upper control limit
0.0000
0.0600
0.0700
1 3 5 7 9 11 13 15 17 19 21 23 25 27 29 31 33 35 37 39 41 43 45 47 49
Sample number
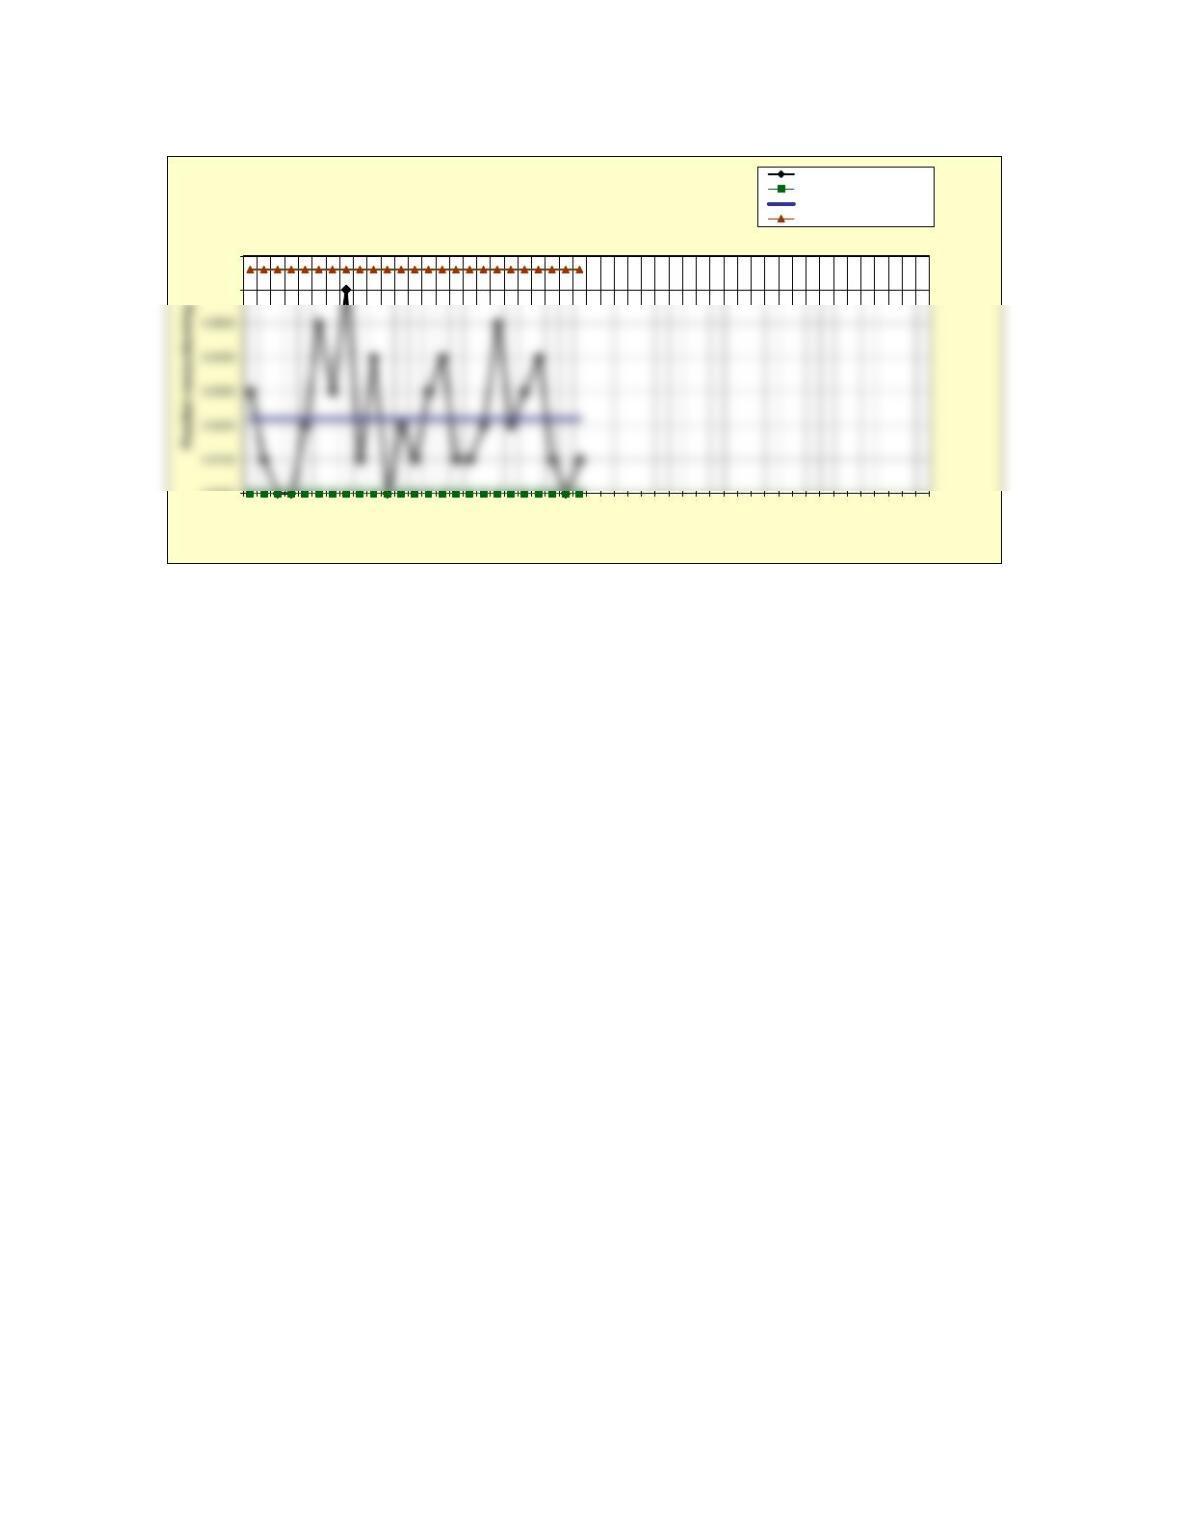
Attribute (p) Chart
(approximate control limits)
Fraction nonconforming
Lower control limit
Center line
Upper control limit