Page 1 of 7
Chapter 9A Appendix
Acceptance Sampling – Supplement to Chapter 9
Discussion Questions
1. Define producer’s risk and consumer’s risk.
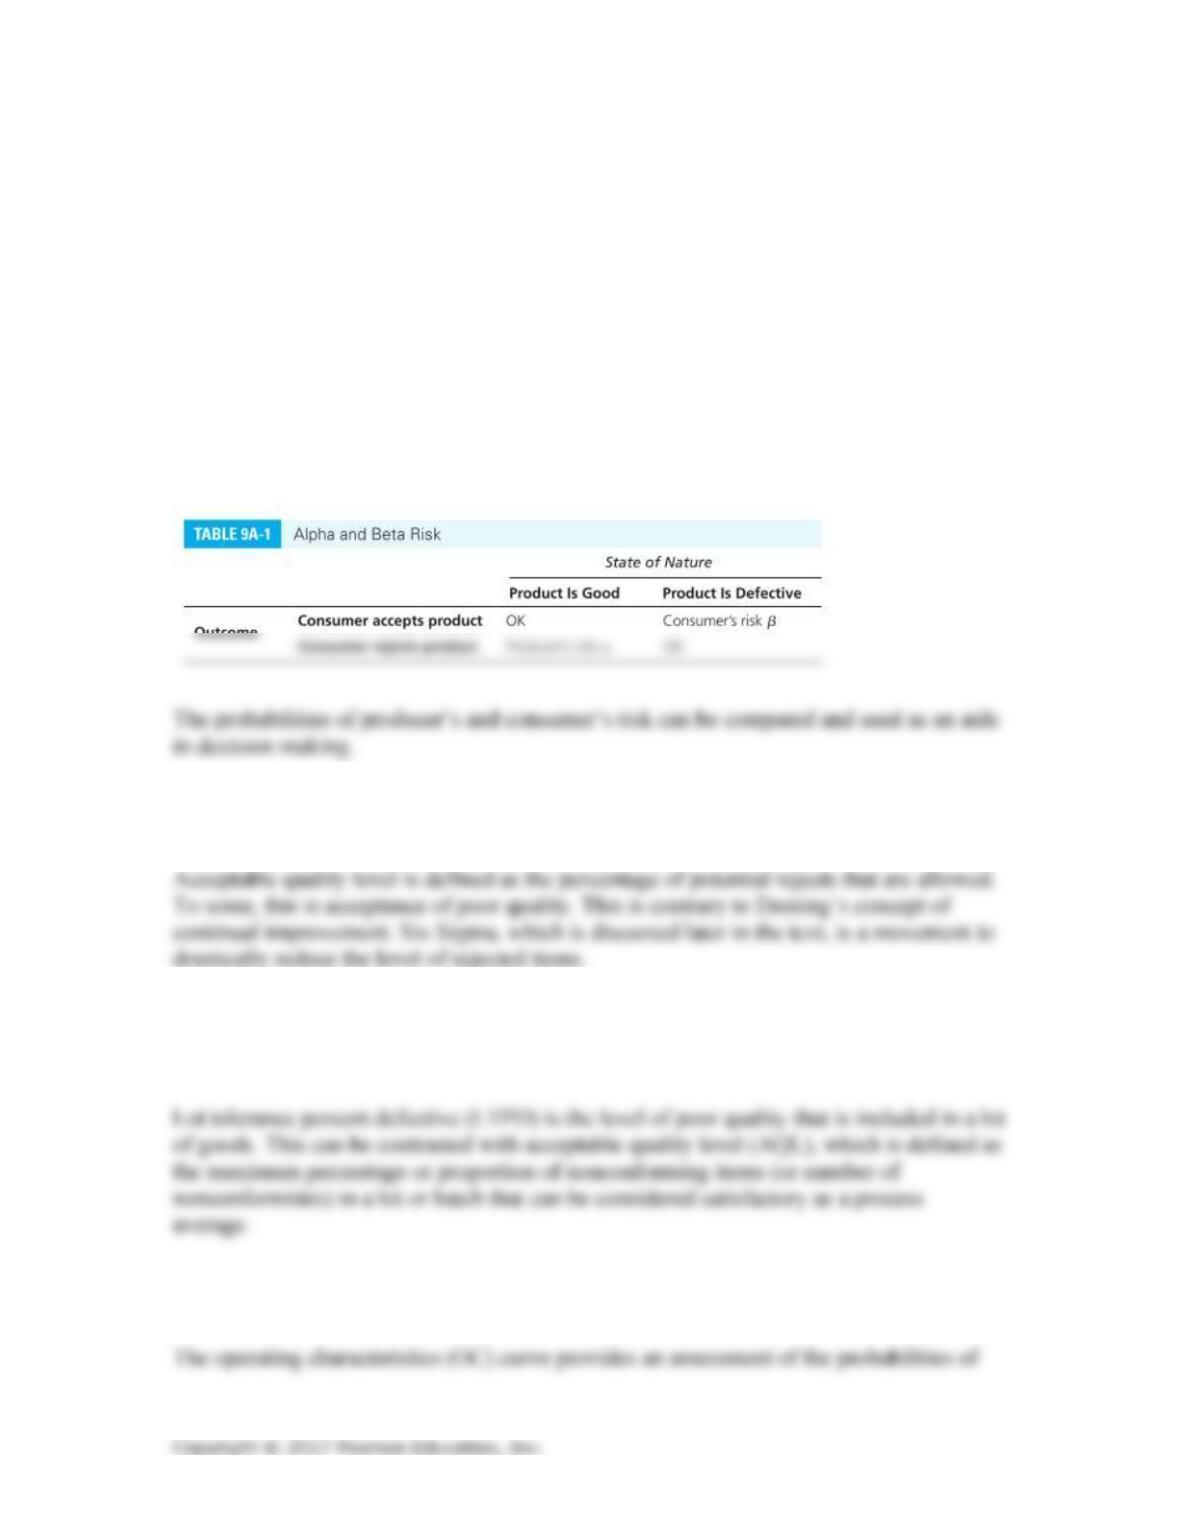
Statistically, this concept is called hypothesis testing. Producer’s risk is the risk of
rejecting a good shipment. Consumer’s risk is the risk of accepting a poor shipment.
Table 9A-1 shows this situation:
2. Define the concept of acceptable quality level. Why has this concept been
troublesome to many people?
3. What is the term that is used to designate the level of poor quality that is included
in a lot of goods? Please describe the role of this term in the quality management
process.
4. What is an operating characteristic curve? What is the function of this curve in
the quality management process?
Page 2 of 7
Problems
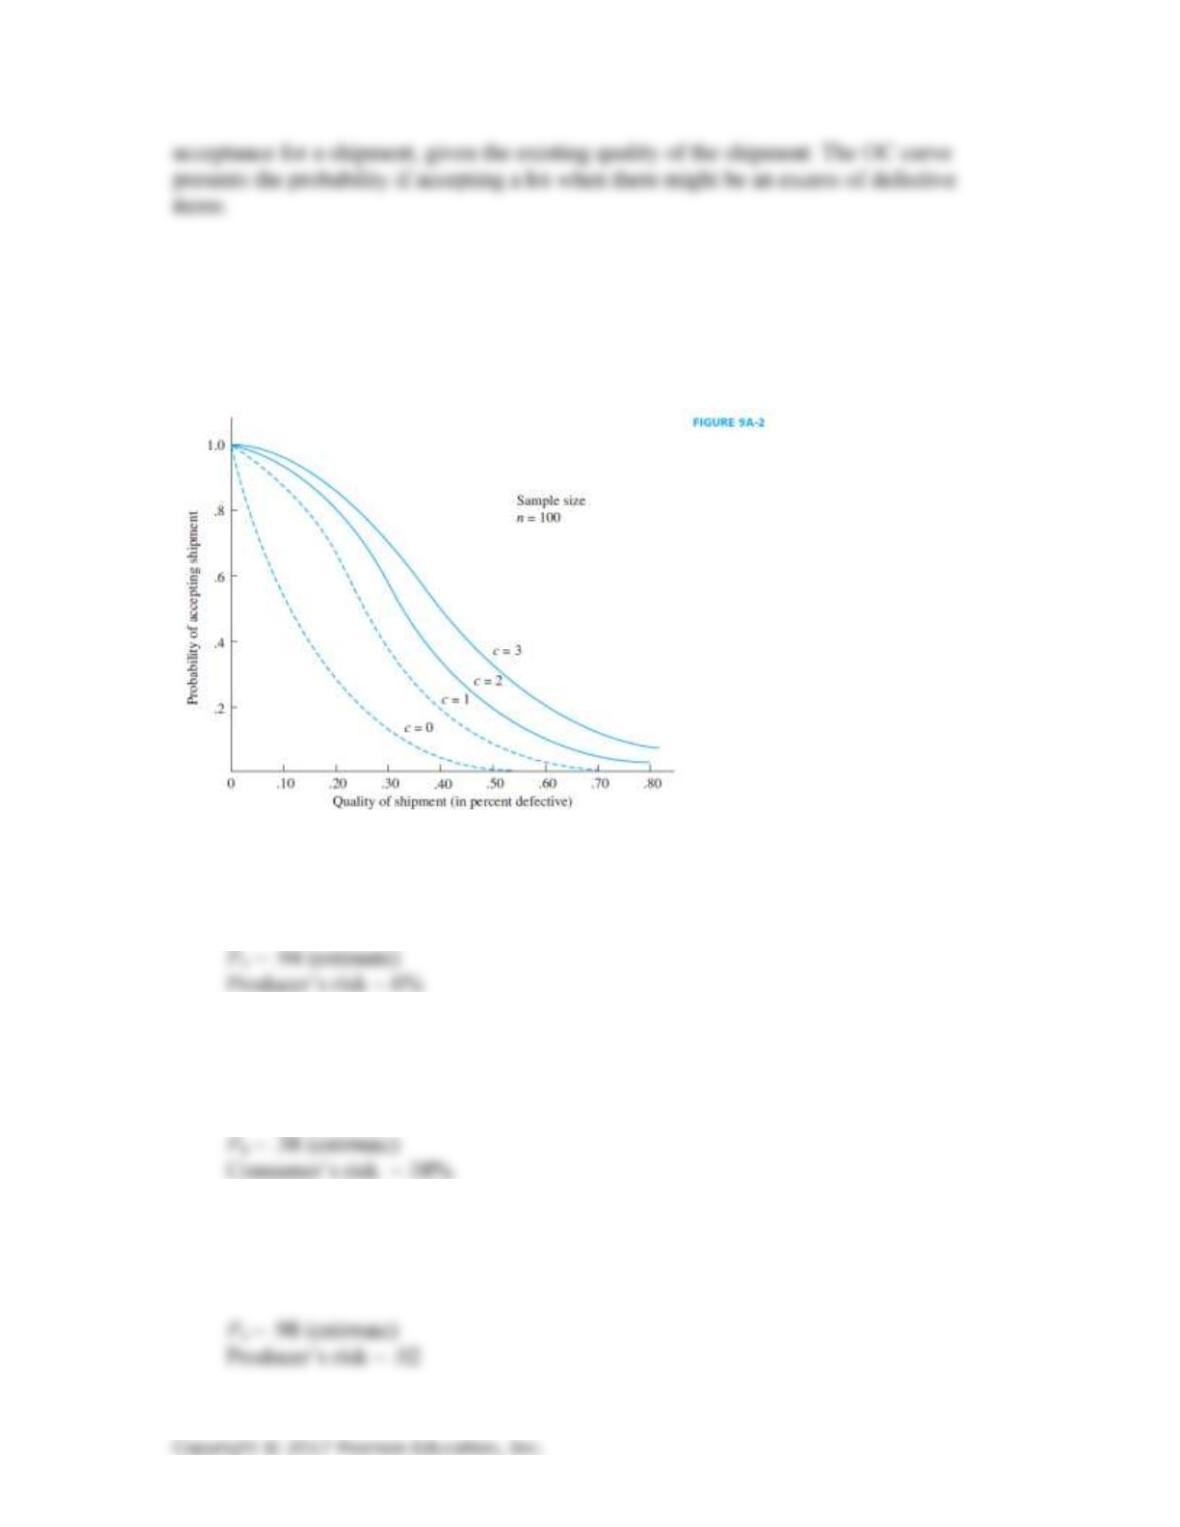
The following operating characteristic curves can be used to design the following
sampling plans in questions 1 to 4.
1.
Using Figure 9A-2, with a sample size of n = 100 and an acceptance number
of c = 1, if a good shipment has no more than .05 defective, what is the
probability of acceptance? What type of risk is this?
2.
3.
Using Figure 9A-2, with a sample size of n = 100 and an acceptance number
of c = 2, if a bad shipment has 40% defective, what is the probability of
acceptance? What type of risk is this?
Using Figure 9A-2, with a sample size of n = 100 and an acceptance number
of c =3, if a good shipment has no more than .02 defective, what is the
probability of acceptance?
4.
5.
Using Figure 9A-2, with a sample size of n = 100 and an acceptance number
of c =1, if a good shipment has no more than .30 defective, what is the
probability of acceptance?
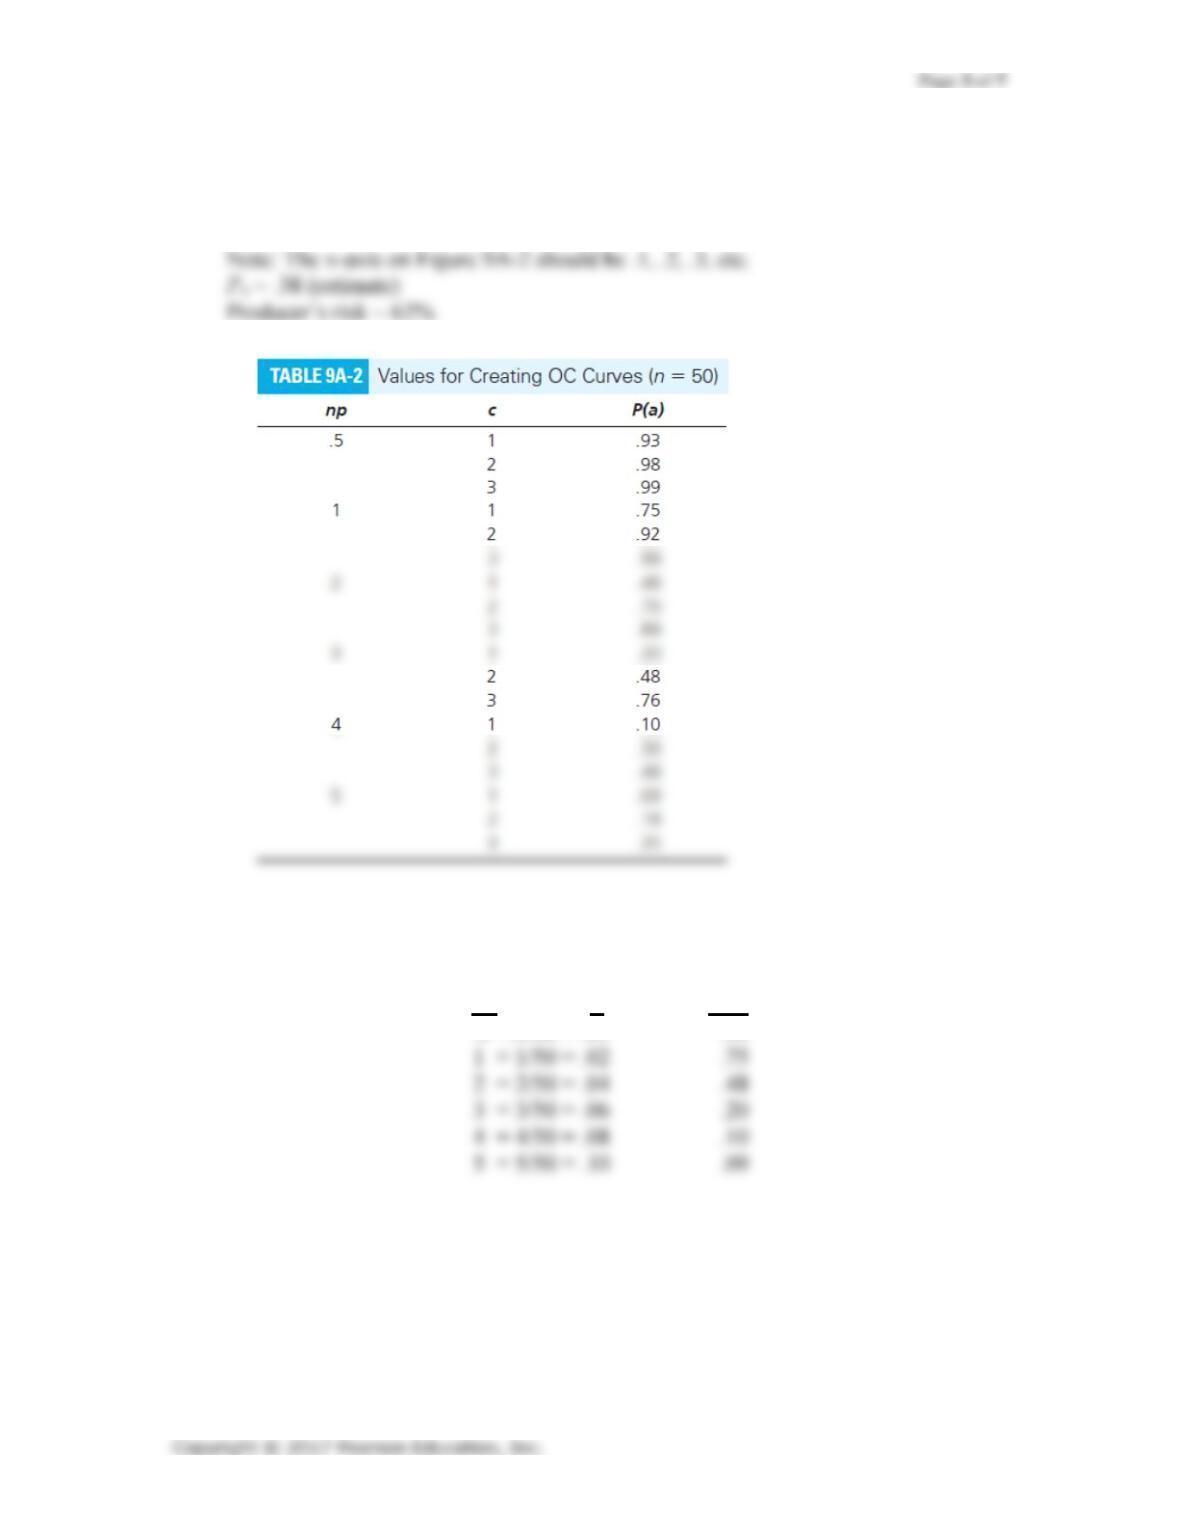
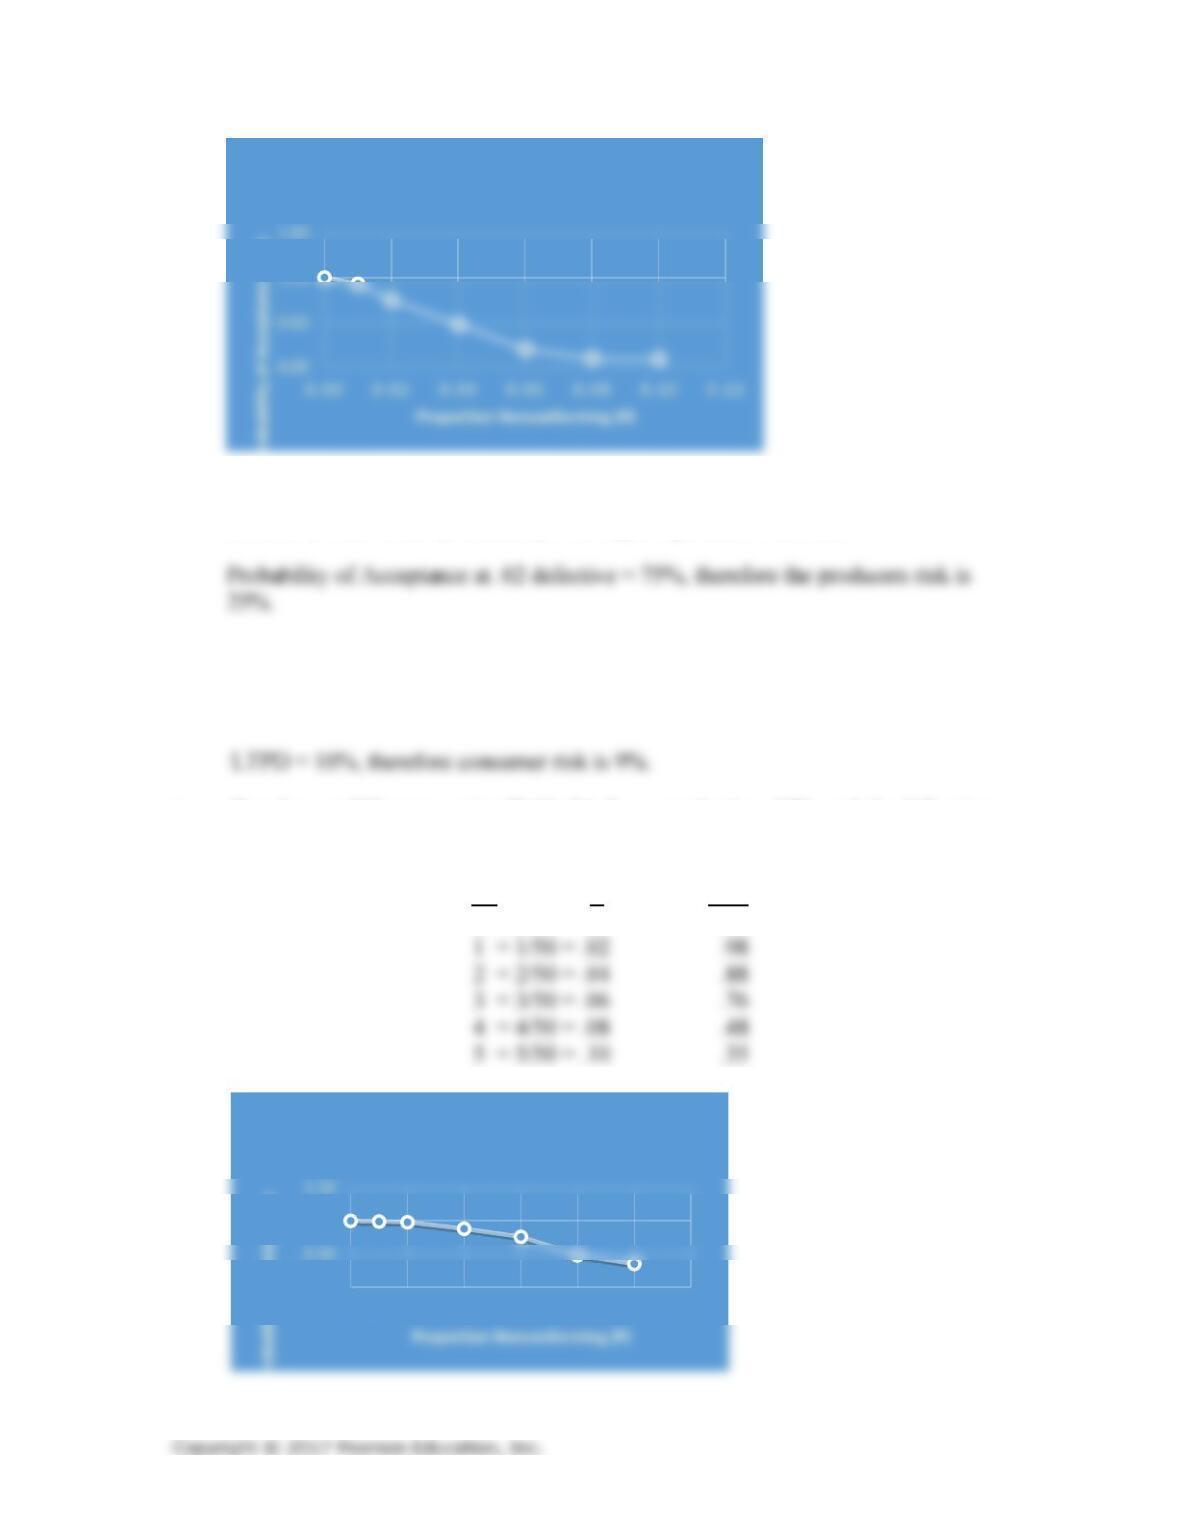
Develop an OC curve using Table 9A-2, a sample size of 50, and the following
np values: 0.5, 1, 2, 3, 4, and 5. The maximum acceptance number is c = 1.
np P P(a)
.5 =.5/50 = .01 .93
Page 4 of 7
6.
7.
8.
From the OC curve developed in Problem 5, if a good shipment is 0.02
defective, what is the probability of a Type I (producer’s) error?
From the OC curve developed in Problem 5, if a bad shipment is defined as
having at least 10% defective, what is your estimate of Type II (consumer’s)
risk?
Develop an OC curve using Table 9A-2, a sample size of 50, and the following
np values: 0.5, 1, 2, 3, 4, and 5. The maximum acceptance number is c = 3.
np P P(a)
.5 =.5/50 = .01 .99
Probability of Acceptance P(a)
OC CURVE
n = 50, c = 1
0.00
1.00
0.00 0.02 0. 0 4 0 . 0 6 0 . 0 8 0 . 1 0 0 . 1 2
P(a)
OC CURVE
n = 50, c = 3
9.
10.
11.
12.
13.
From the OC curve developed in Problem 8, if a good shipment is .04
defective, what is the probability of a Type I (producer’s) error?
From the OC curve developed in Problem 8, if a bad shipment is defined as
having at least 15% defective, what is your estimate of a Type II (consumer’s
risk) error?
Please explain the following sampling plan in easily understood terms:
n1 = 50
c1 = 2
n2 = 100
c2 = 5
r1 = 4
r2 = 6
Please explain the following sampling plan in easily understood terms:
n1 = 125
c1 = 3
n2 = 150
c2 = 6
n3 = 200
c3 = 12
125 items from the incoming lot are drawn at random. If three, two, one, or zero
We want to develop a double-sampling plan where n1 = n2 (see Table 9A-3).
Here are the needed parameters:
AQL = .010
LTPD = .030
Producer’s risk = .05
Page 6 of 7
14.
15.
16.
17.
Consumer’s risk = .10
Rework Problem 13 where n2 is twice the size of n1 (see Table 9A-4).
LTPD/AQL = .030/.010 = 3.0
We want to develop a double-sampling plan where n1 = n2 (Table 9A-3).
Here are the necessary parameters:
AQL = .020
Rework Problem 15 where n2 is twice the size of n1 (Table 9A-4).
LTPD/AQL = .080/.020 = 4.0
Your boss wants you to develop a double-sampling plan where n1 = n2 (using
Table 9A-3). Here are some parameters for your use:
AQL = .015
LTPD = .040
Producer’s risk = .05
Consumer’s risk = .10

18.
Rework Problem 17 where n2 is twice the size of n1 (Table 9A-4).
LTPD/AQL = .040/.015 = 2.66