21
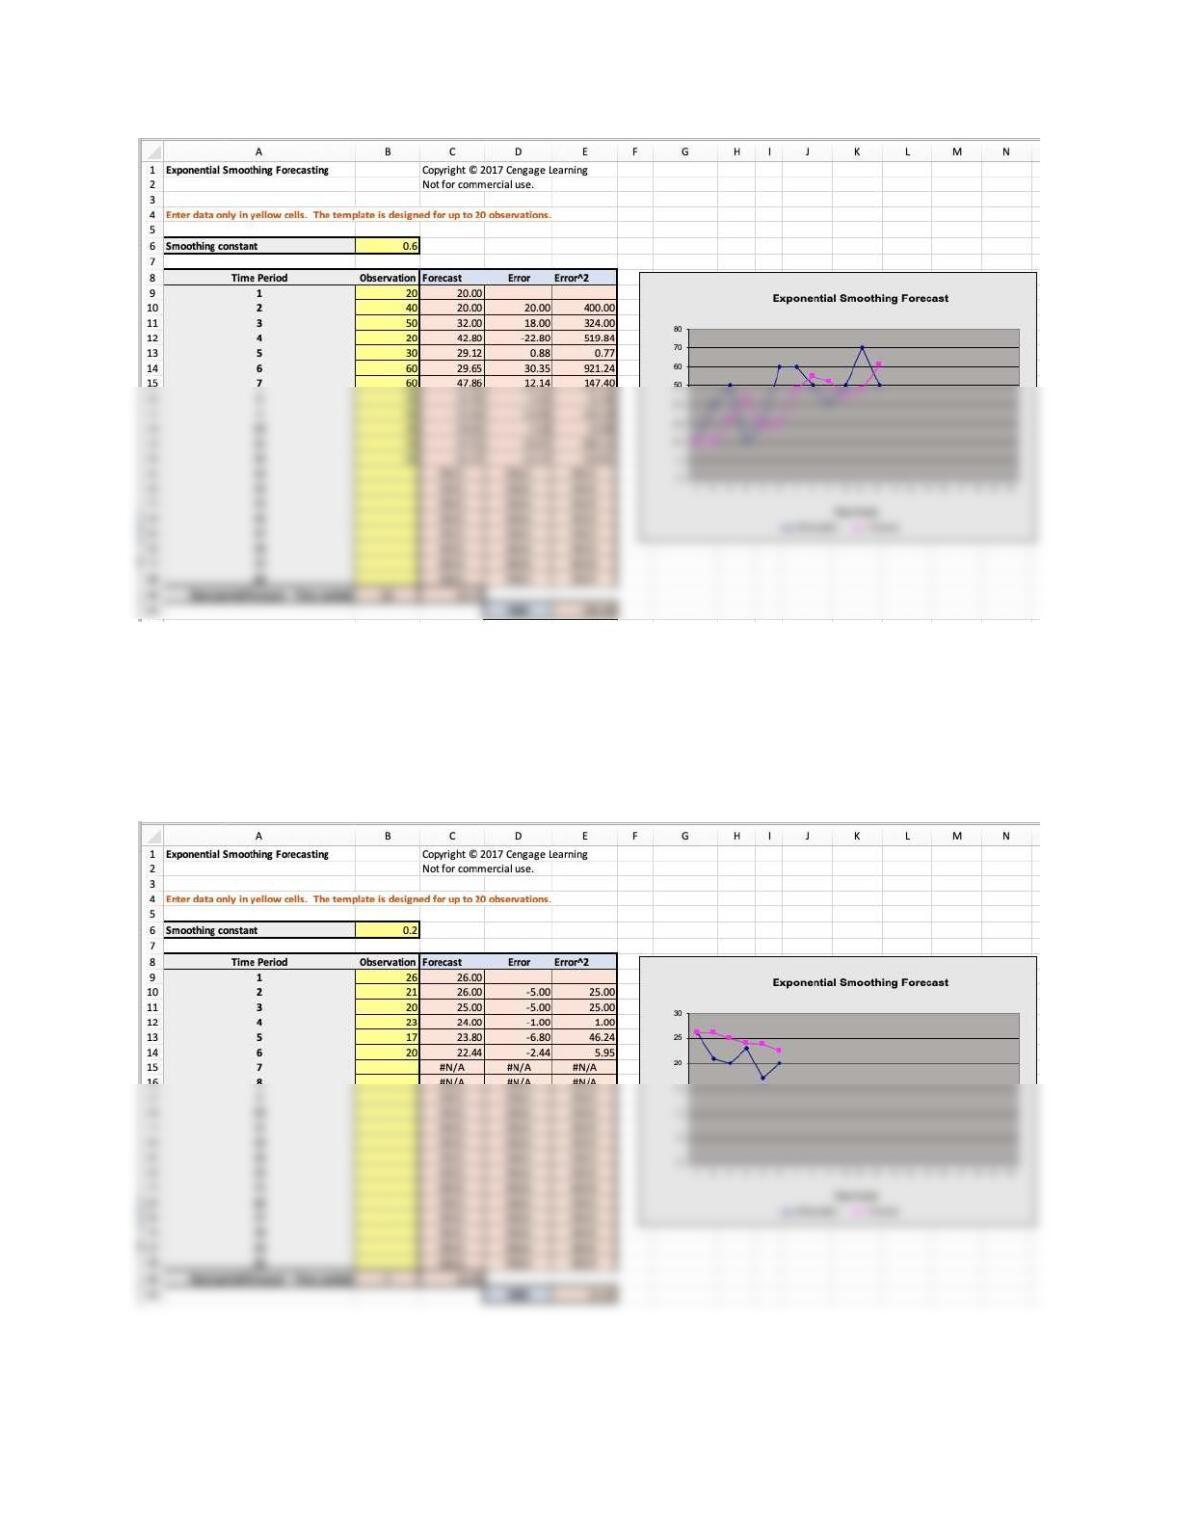
The best single exponential smoothing model is with
= 0.4.
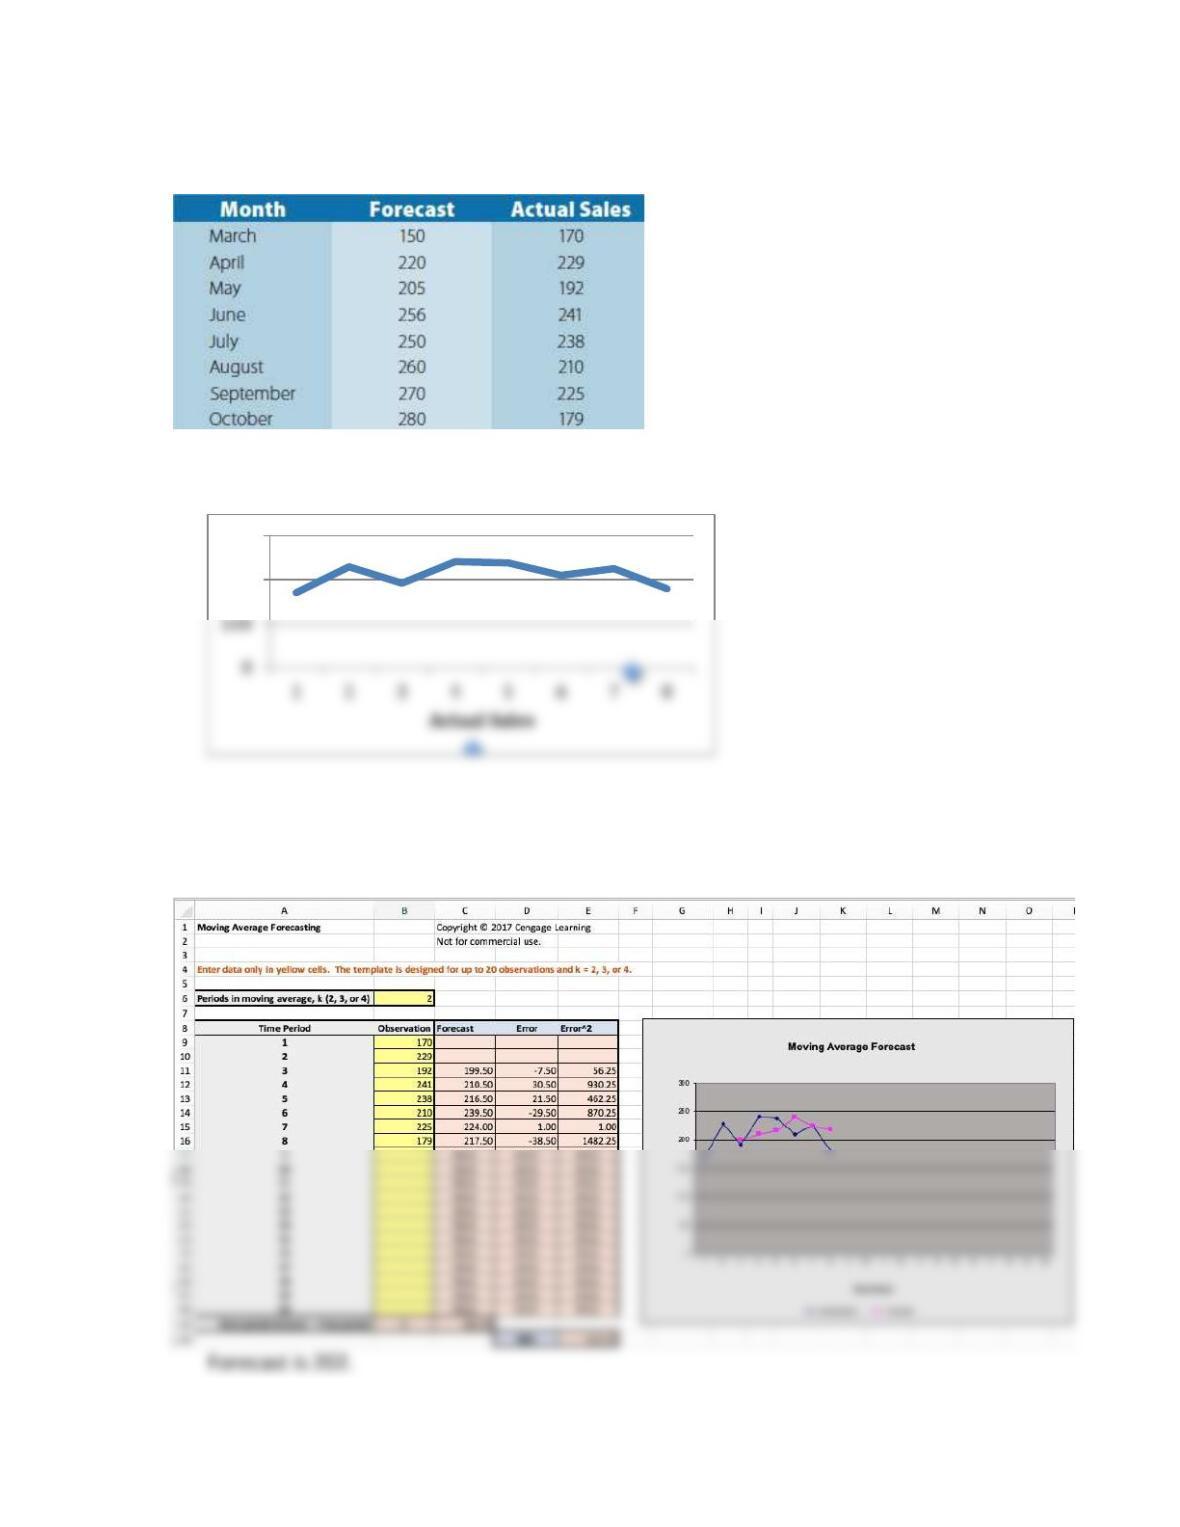
35. For the coffee maker sales data in problem 33, use the Exponential Smoothing Excel
template with
= 0.2 to compute the exponential smoothing forecasts for February
through July.
22
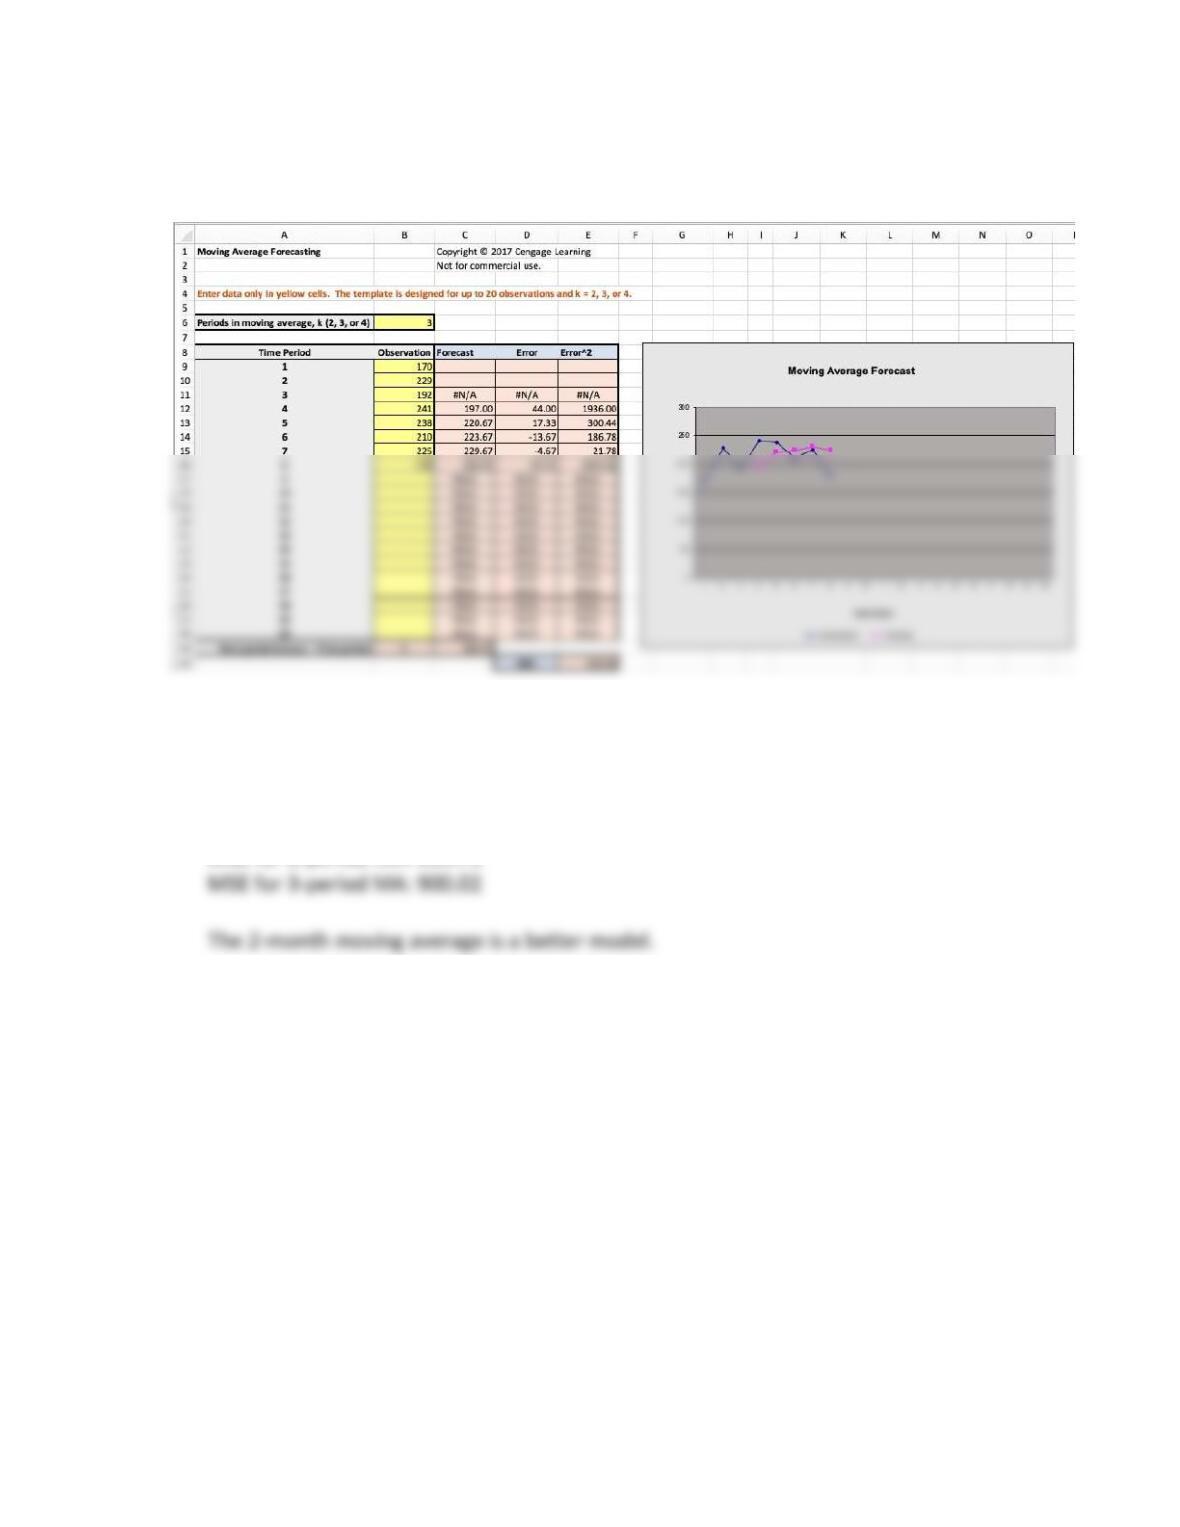
36. Forecasts and actual sales of digital music players at Just Say Music are as follows:
a. Plot the data and provide insights about the time series.
The time series appears to be relatively stable.
b. What is the forecast for November, using a two-period moving average?
200
300
23
c. What is the forecast for November, using a three-period moving average?
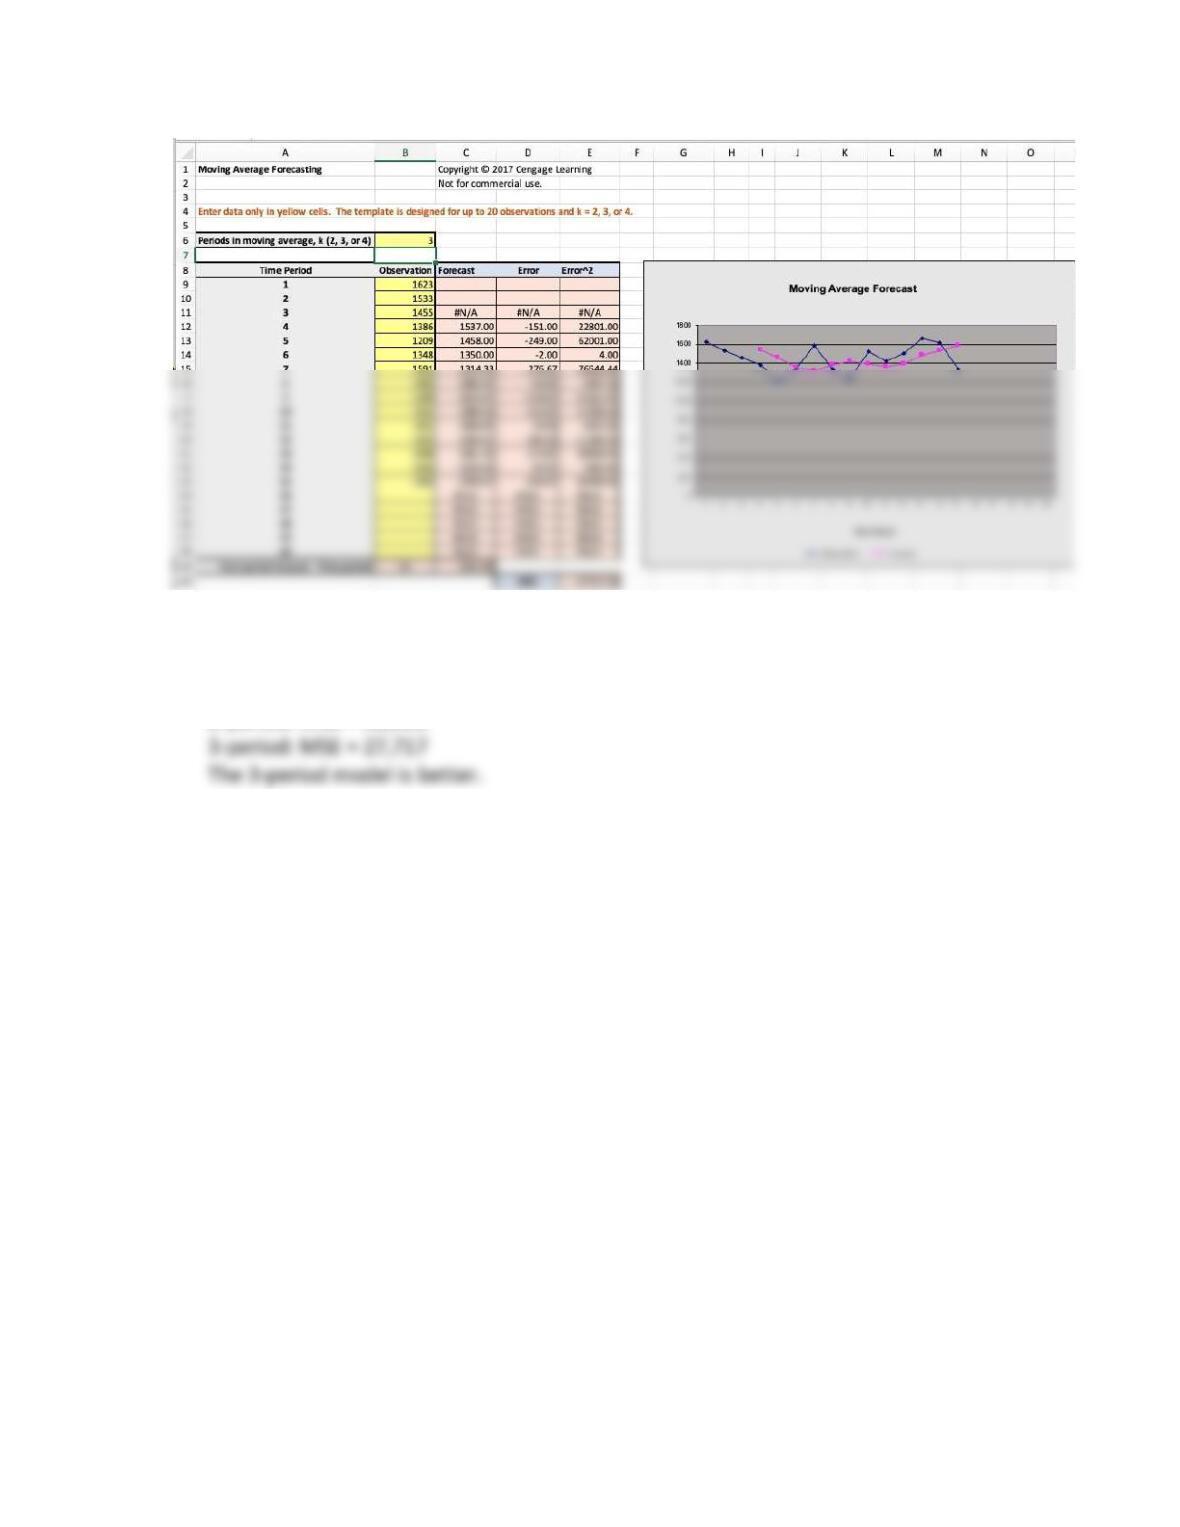
Forecast is 204.67
d. Compute MSE for the two- and three-period moving average models using the Moving
Average Excel template and compare your results.
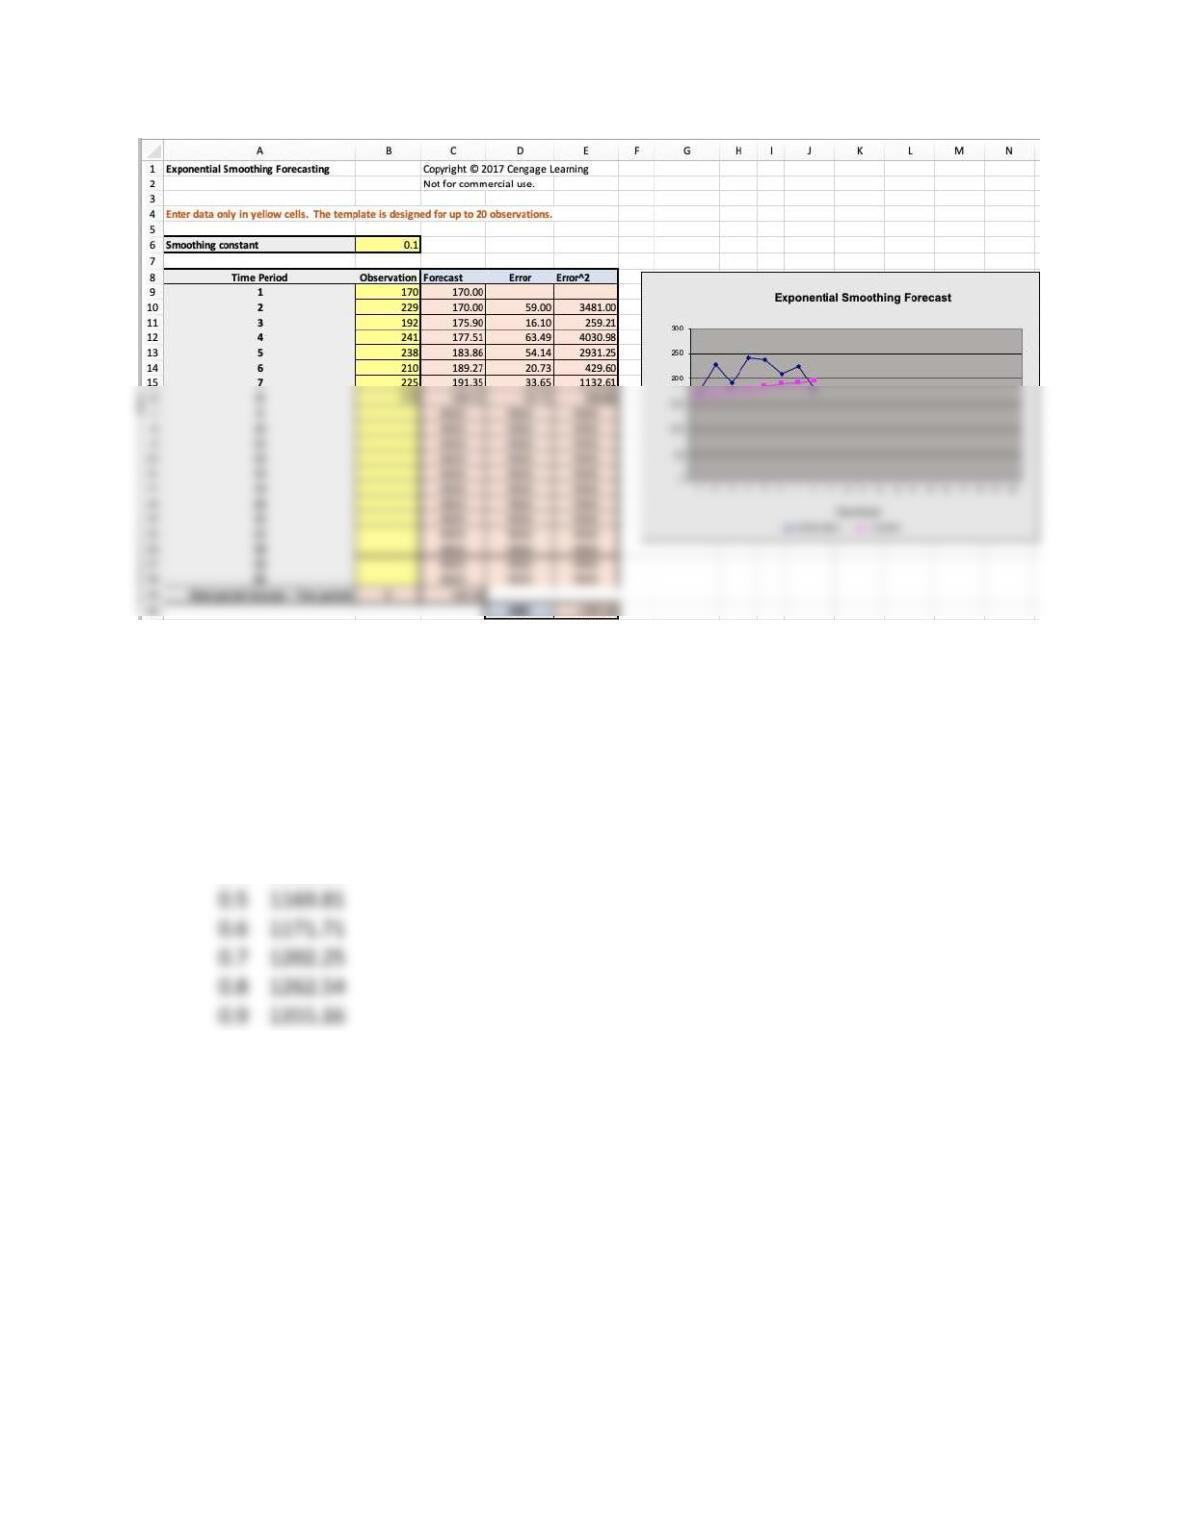
37. For the actual sales data at Just Say Music in Problem 36, find the best single exponential
smoothing model by evaluating the MSE for
from 0.1 to 0.9, in increments of 0.1. How
does this model compare with the best moving average model found in Problem 36?
One example calculation with the template is shown below.
24
Summary:
0.5
1169.81
0.6
1171.71
0.7
1202.25
0.8
1262.54
0.9
1355.16
A smoothing constant of 0.5 has the smallest MSE.
38. To plan factory staffing levels, Luke’s Surfboards, needs to forecast sales for the next two
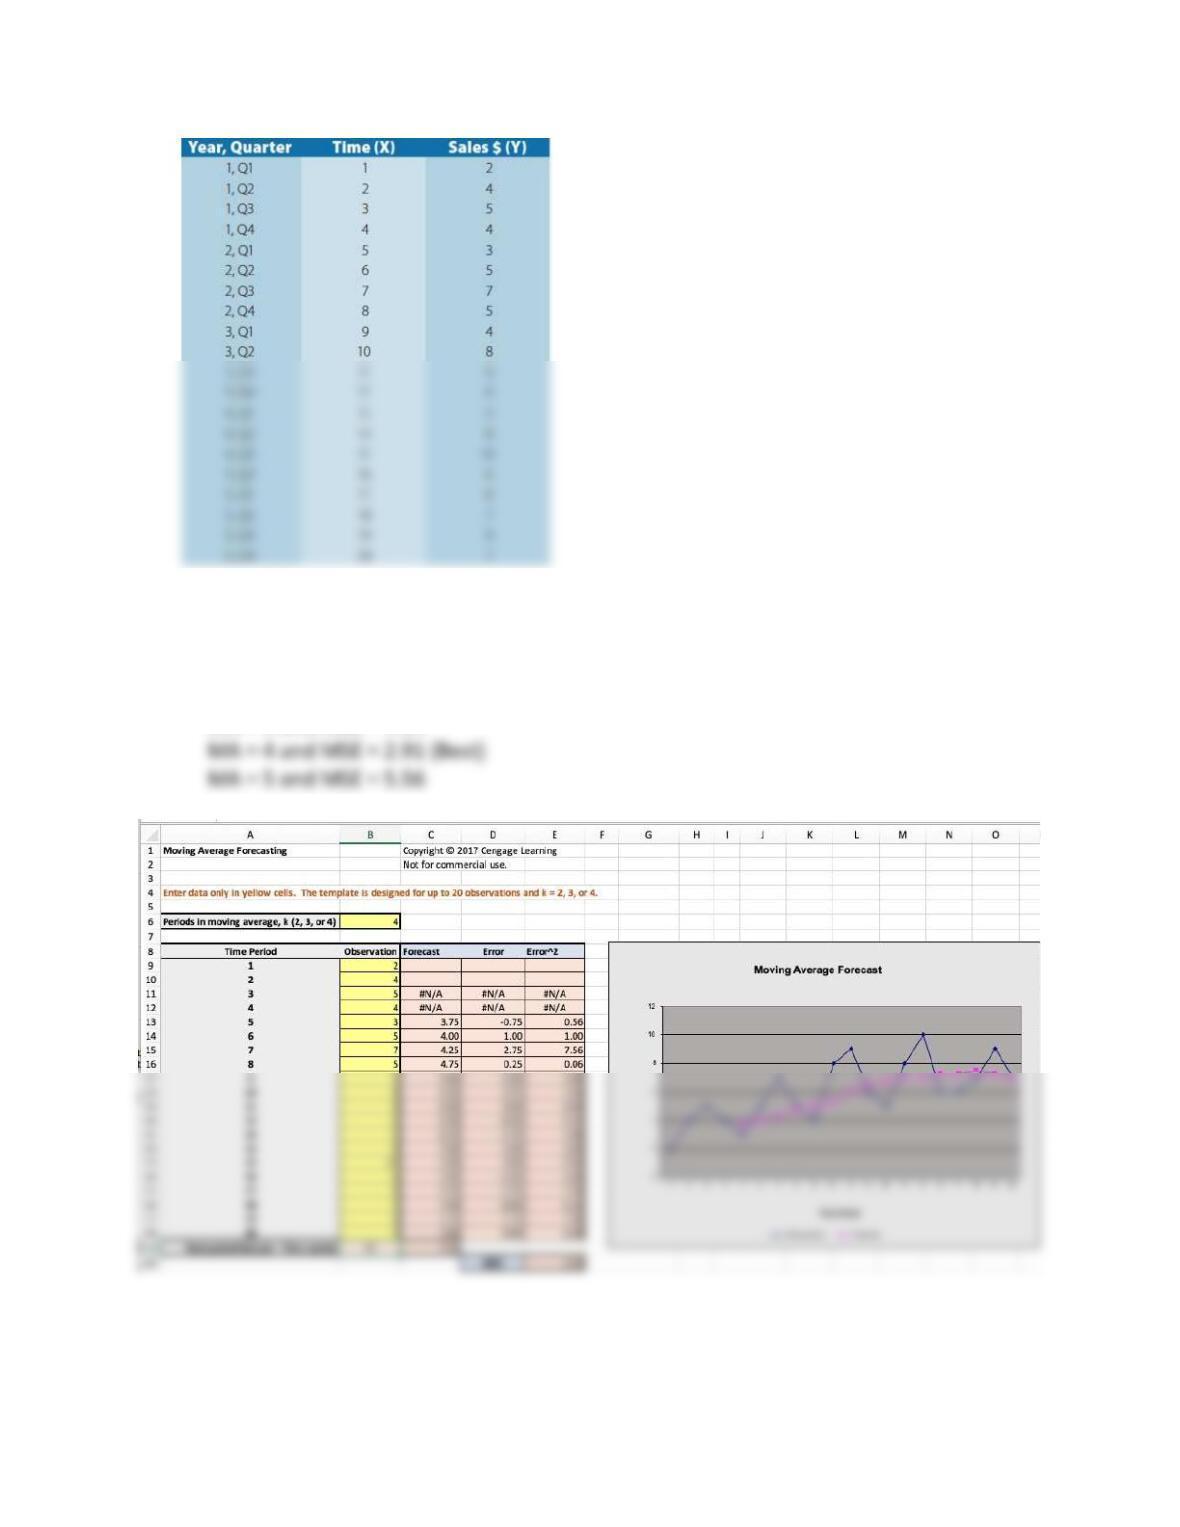
quarters. Sales of surfboards for the last five years are shown below in millions of dollars.
These data are available in the worksheet C9 Excel P38 Data in MindTap.
Alpha
MSE
0.1
1787.36
0.2
1430.95
0.3
1272.33
0.4
1199.04
25
a. Use the Moving Average Excel template to find the best moving average model with k = 2,
3, 4, and 5 periods.
MA = 2 and MSE = 5.35
26
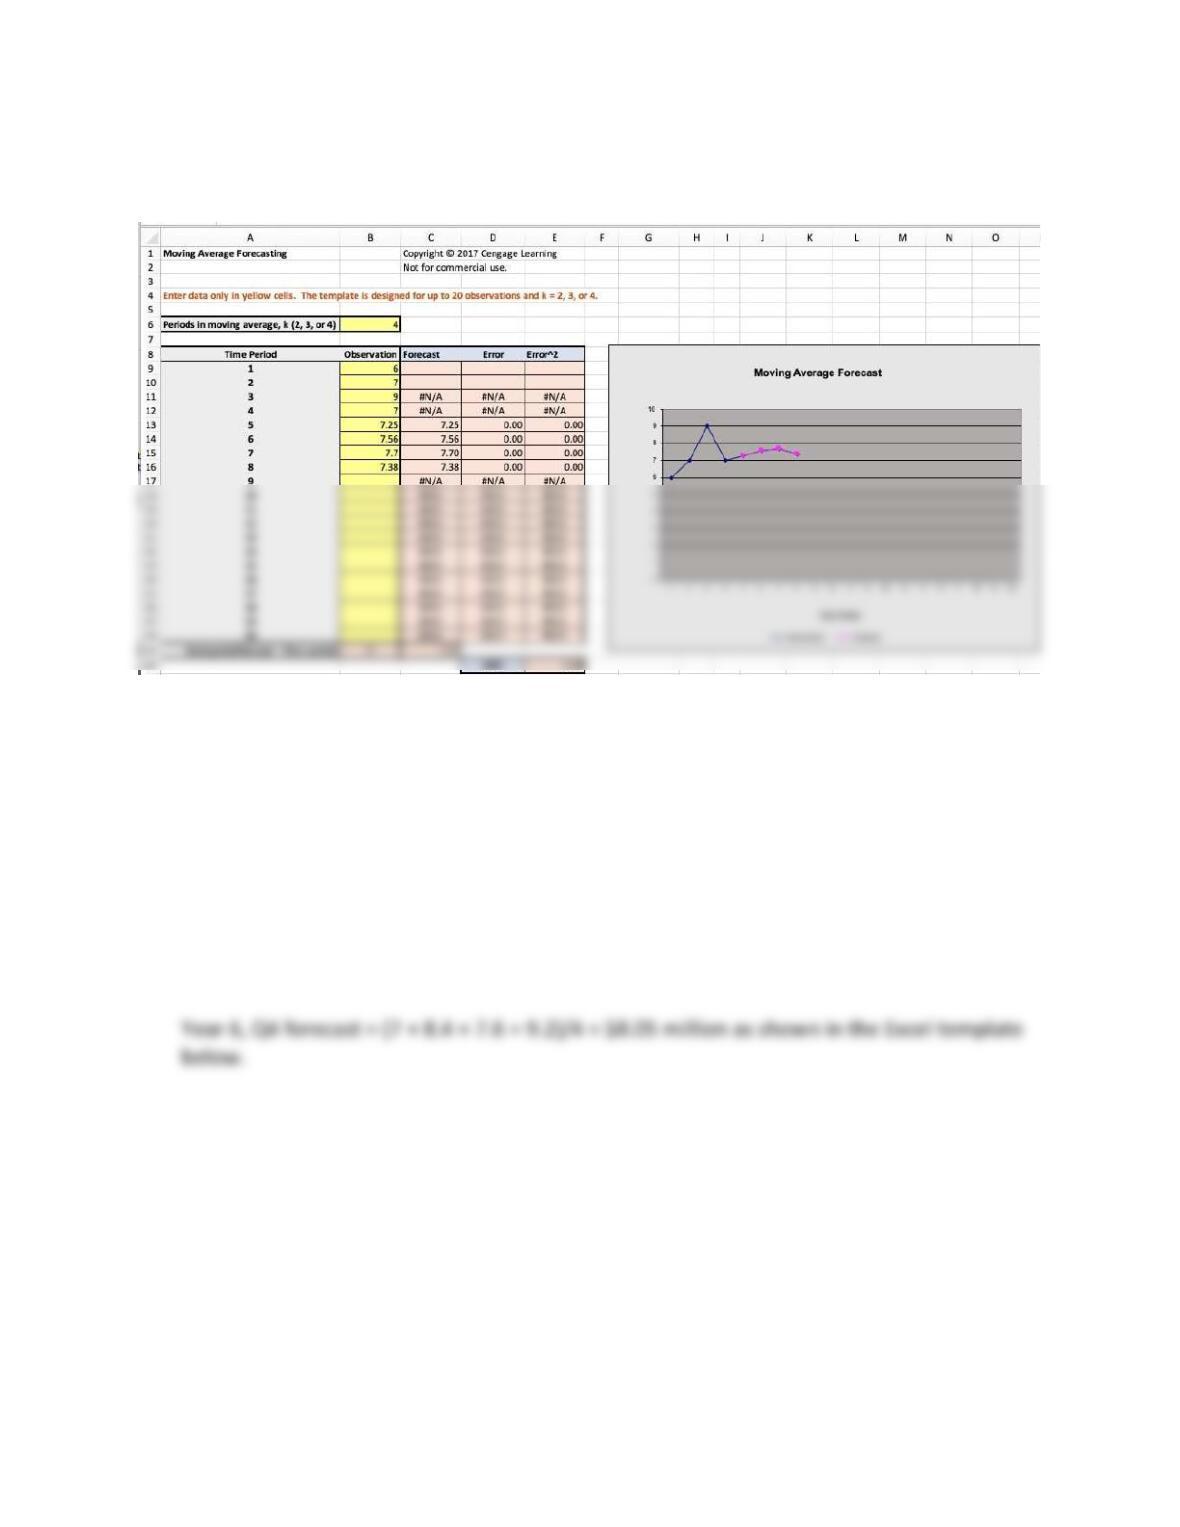
b. Using the best moving average model found in (a), what are the quarterly forecasts for
year six, assuming that actual sales in each quarter will equal forecasted sales?
Year, Quarter Sales $(Y)
6, Q1 7.25
6, Q2 7.56
6, Q3 7.70
6, Q4 7.38
In practice we would use actual sales as they become available.
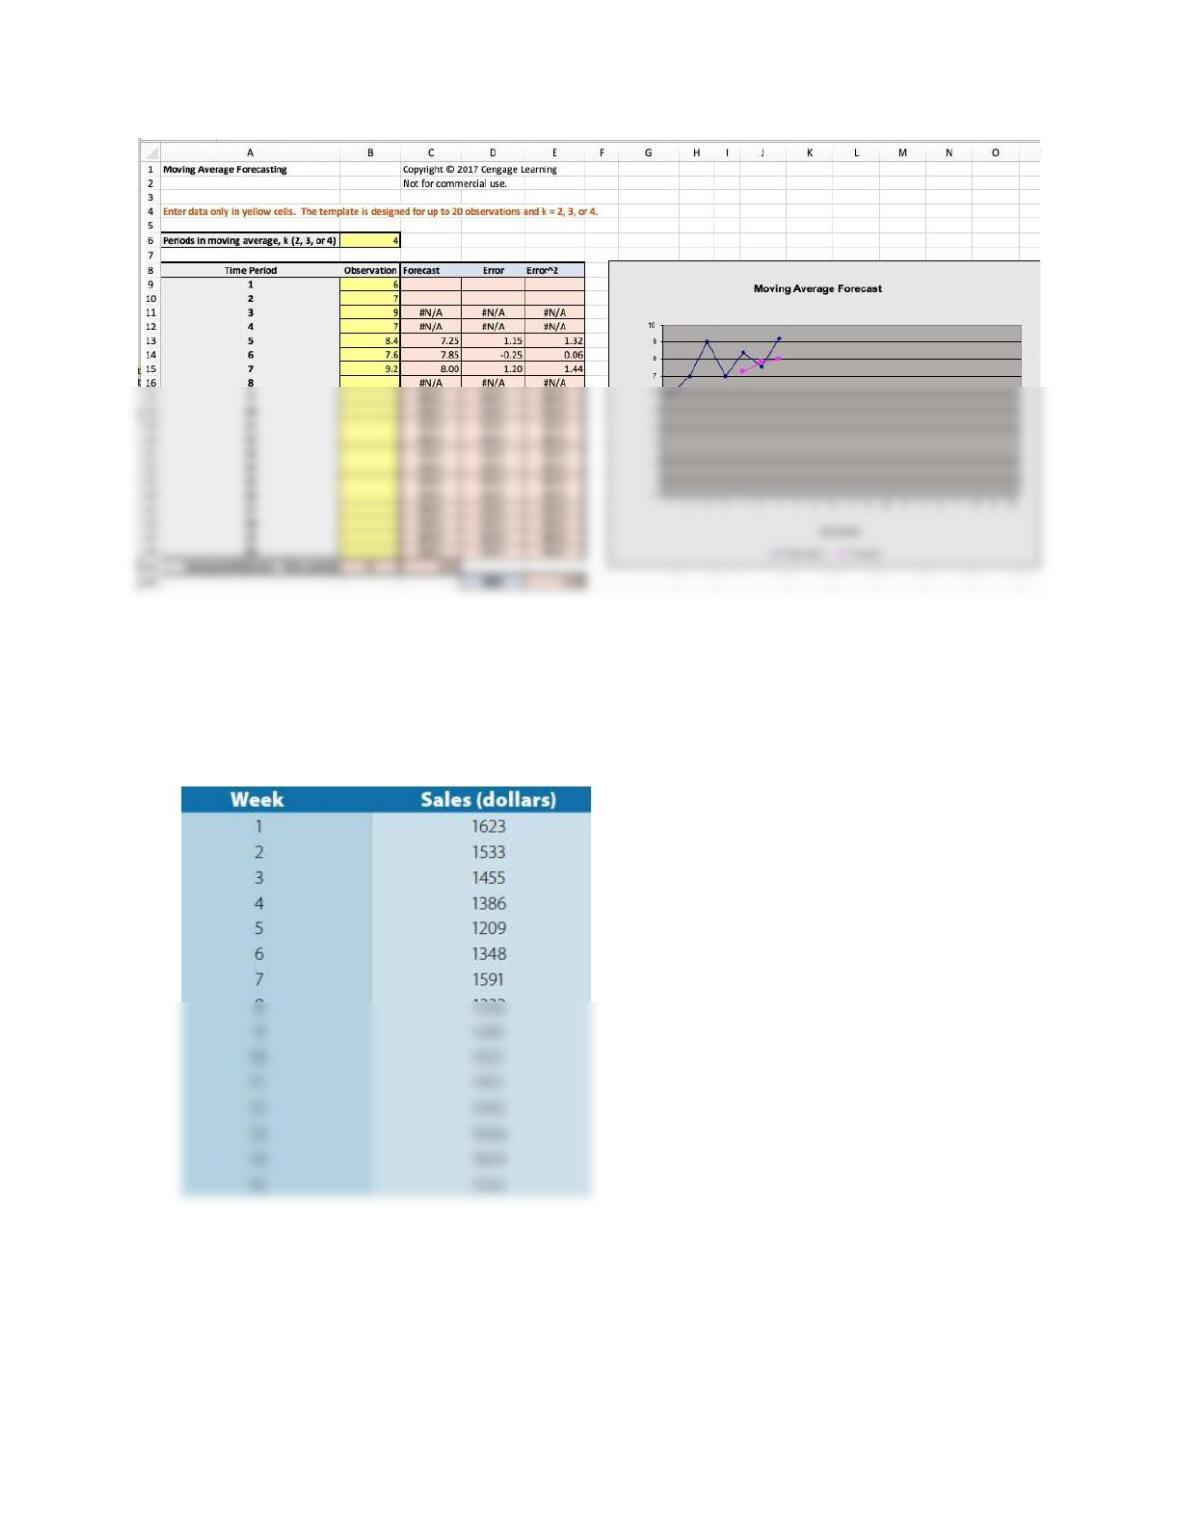
c. If actual sales for quarter 1, 2, and 3 for Year 6 were $8.4, $7.6, and $9.2 million, what is
the sales forecast for the fourth quarter?
27
39. A restaurant wants to forecast its weekly sales. Historical data (in dollars) for fifteen weeks
are shown below and can be found in the Excel worksheet C9 Excel P39 Data in MindTap.
Use Excel and the Moving Average template to answer the following questions. (Note: You
may copy the data from the worksheet to the appropriate Excel template.)
a. Plot the data and provide insights about the time series.
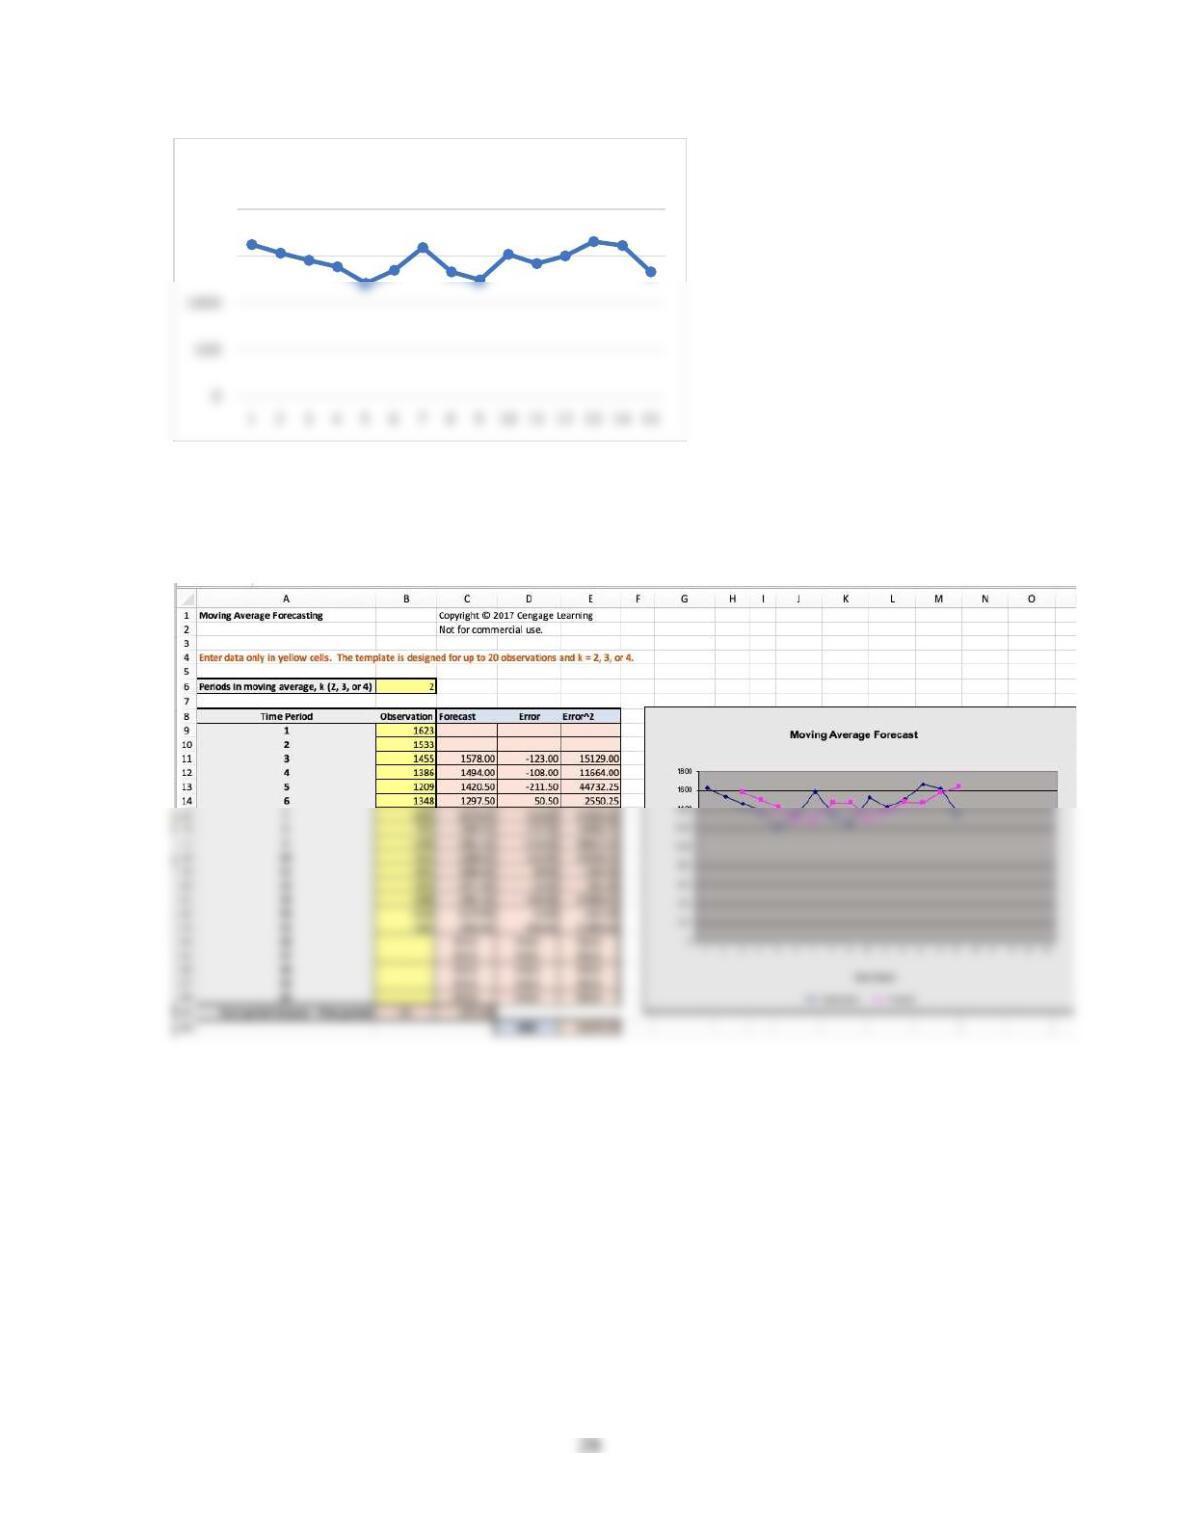
The data are relatively stable.
b. What is the forecast for week 16, using a two-period moving average?
c. What is the forecast for week 16, using a three-period moving average?
1500
2000
Time Series Data
29
d. Compare MSE for the two- and three-period moving average models to determine the
best model.
40. For the restaurant sales data in problem 39, use the Exponential Smoothing Excel template
in MindTap to find the best exponential smoothing model by evaluating the MSE for
from 0.1 to 0.9, in increments of 0.1. How does this model compare with the best
moving average model found in problem 7?
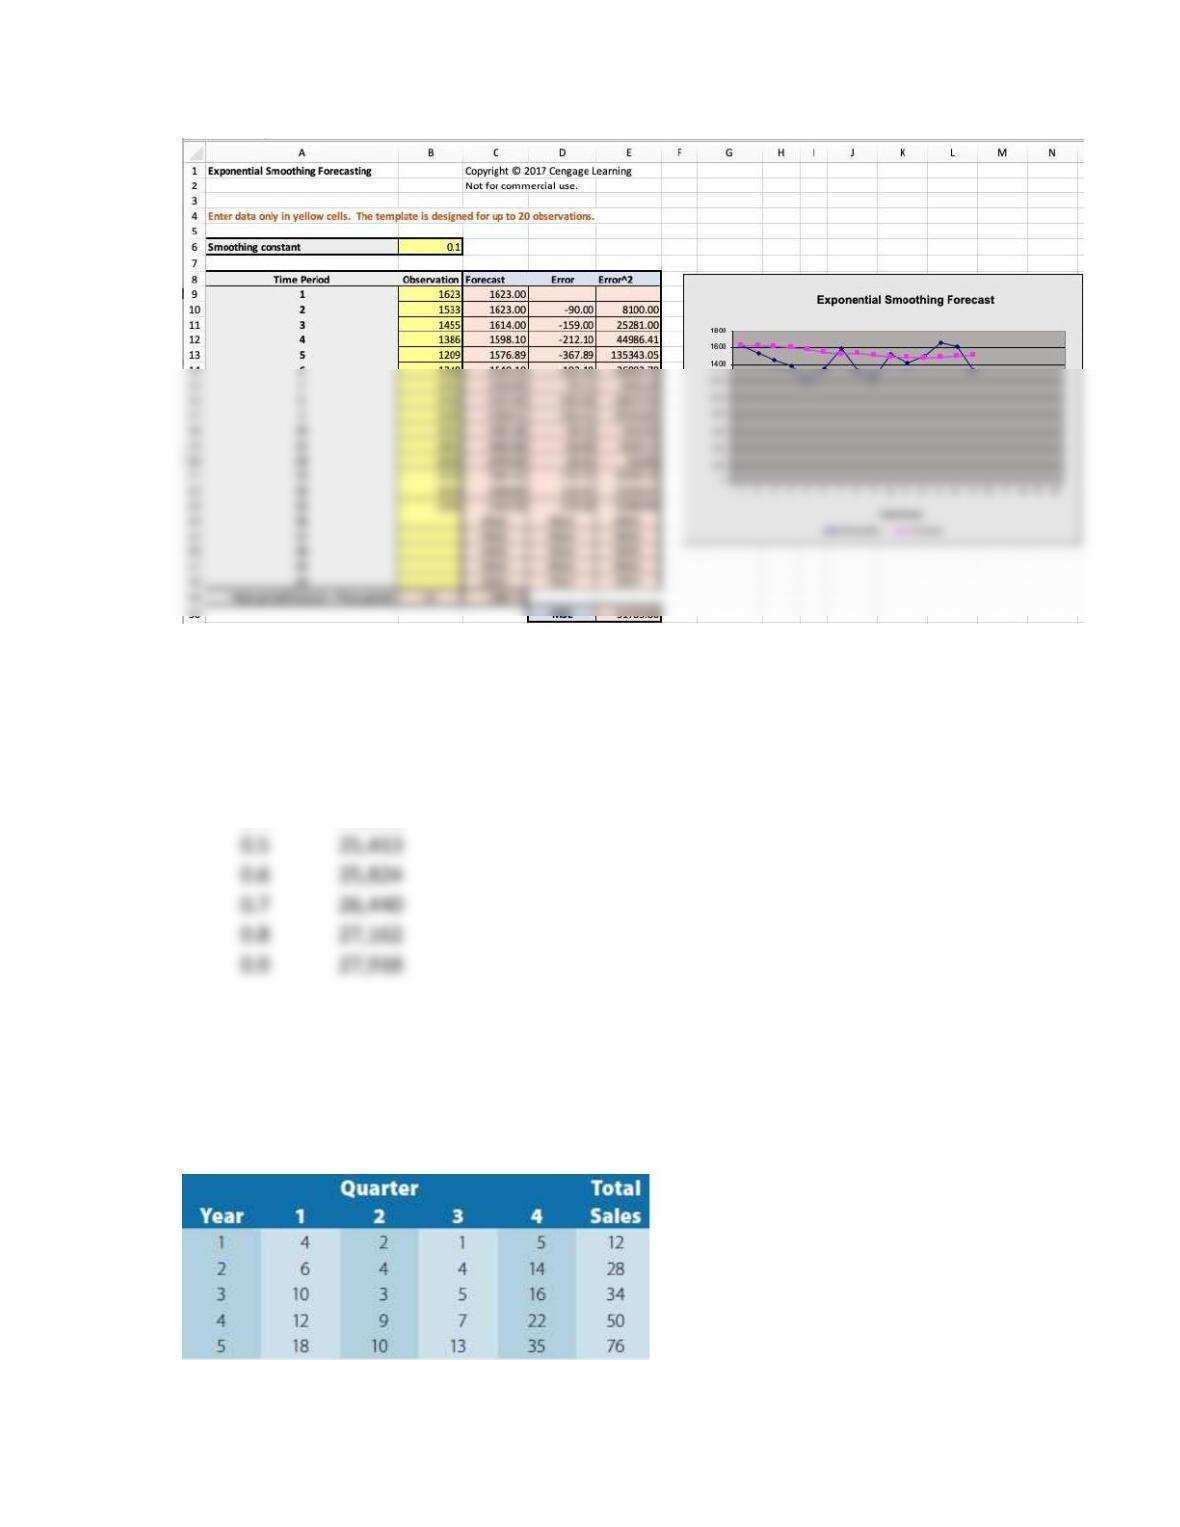
One example using the template is shown below.
30
Summary
Alpha MSE
0.1
31,784
0.2
27,453
0.3
25,892
0.4
25,358
0.5
25,413
0.6
25,824
0.7
26,440
0.8
27,162
0.9
27,918
A smoothing constant of 0.4 is the best. This ES model with alpha = 0.4 has a smaller MSE
(25358) than the moving average model (27717) with n = 3 (see problem 6).
41. Consider the quarterly sales data for Kilbourne Health Club shown below.
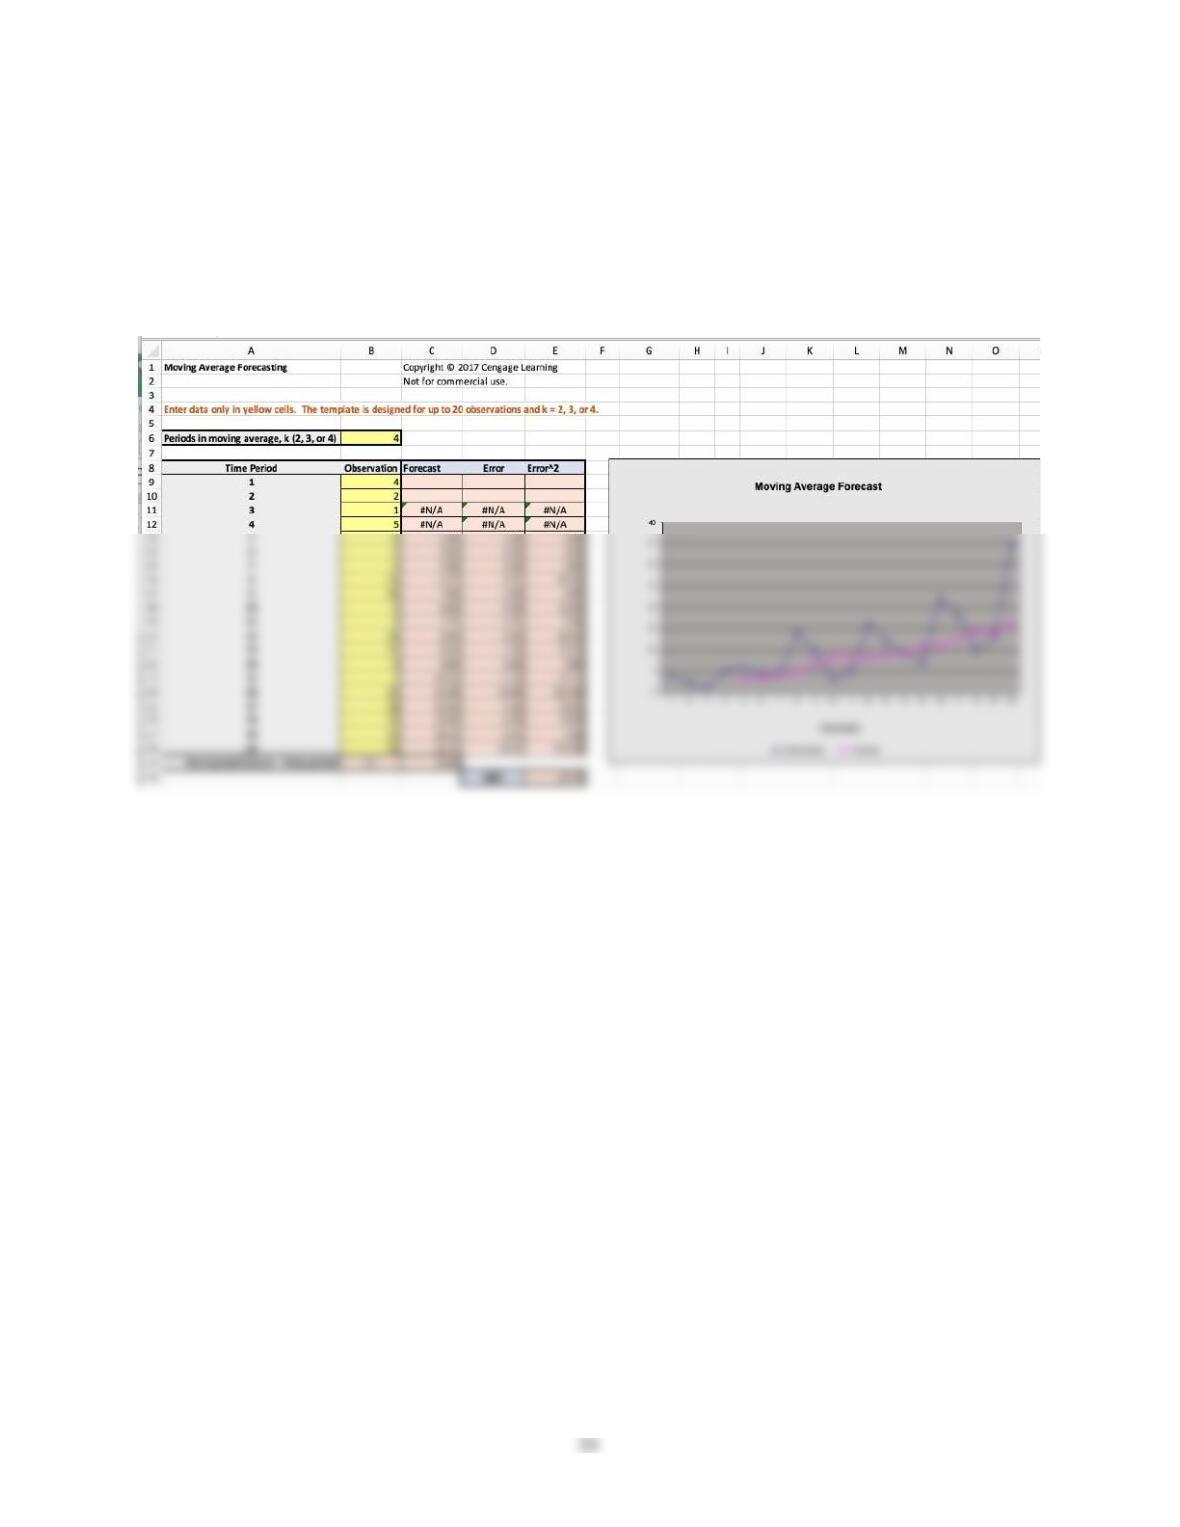
These data are available in a simpler format in the Excel worksheet C9 Excel P41 in
MindTap.
a. Use the Moving Average Excel template to develop a four-period moving average model
and compute MAD, MAPE, and MSE for your forecasts.
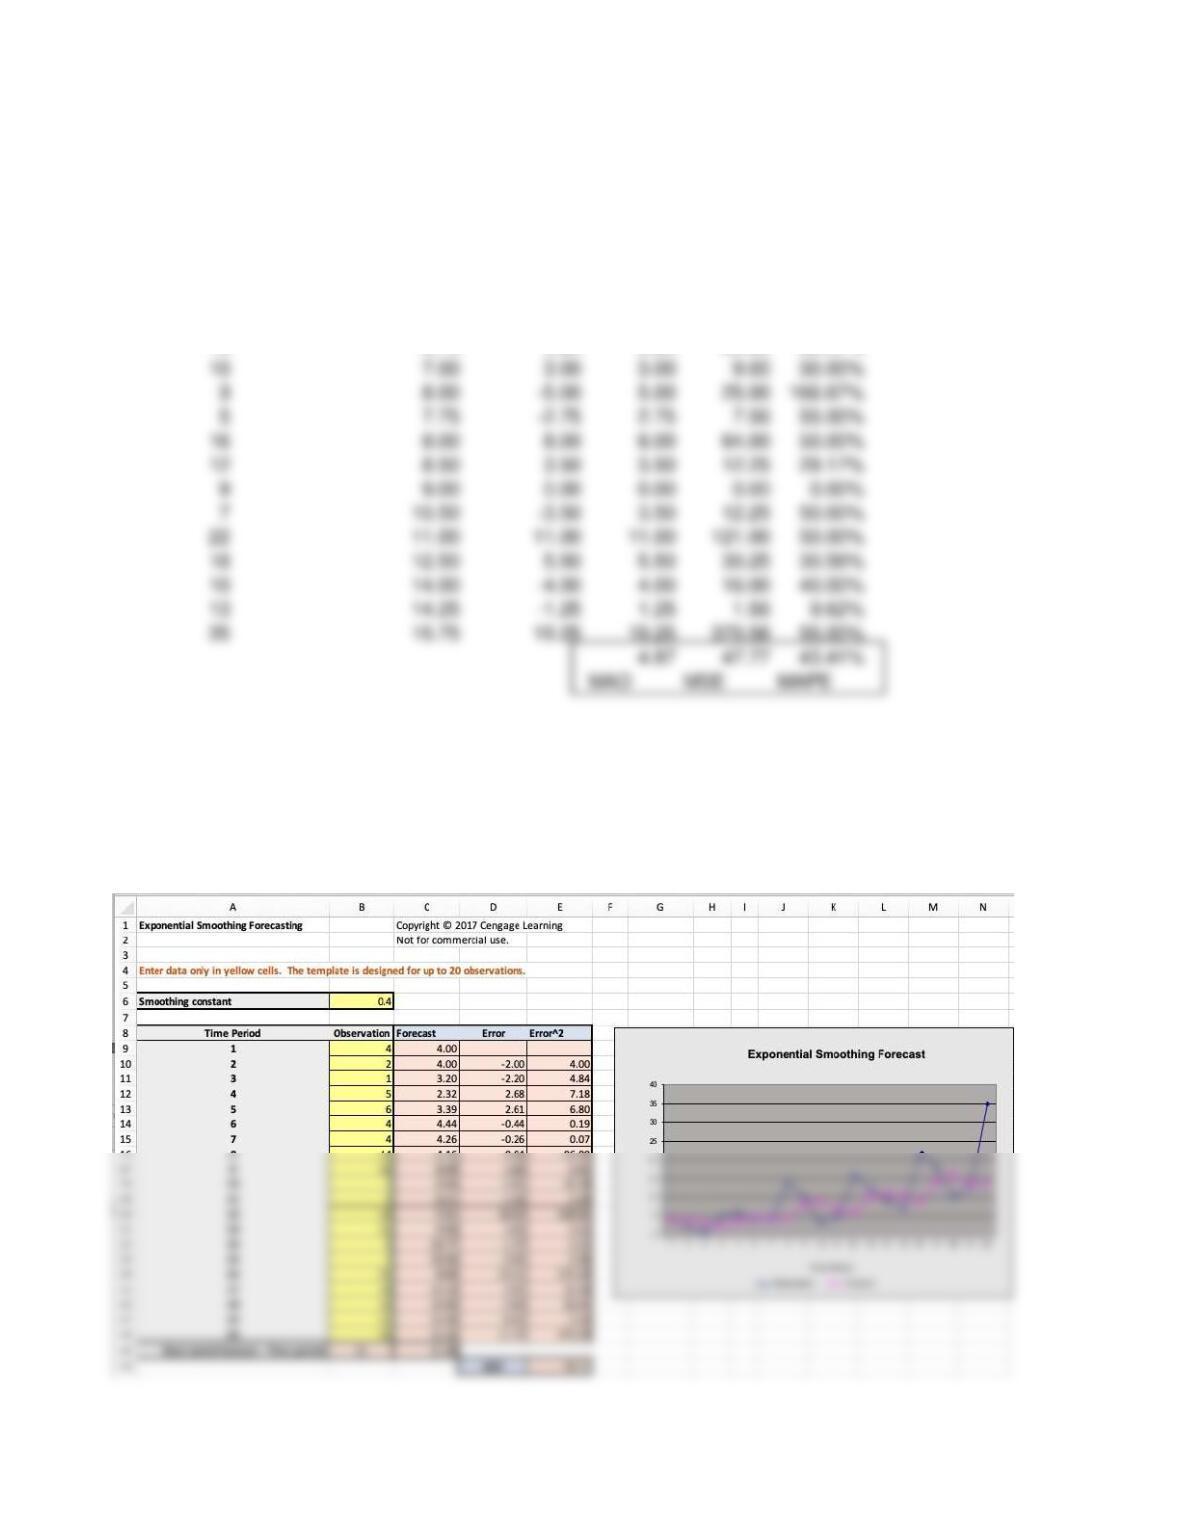
A spreadsheet may be used to compute the forecast errors. MSE = 47.77, MAD 4.97, MAPE =
43.41%. The headings below for MAD, MSE, and MAPE are Sales, 4 period MA forecast, error,
absolute error, squared error, and MAPE percentage.
32
b. Use the Exponential Smoothing Excel template to find a good value of
for a single
exponential smoothing model and compare your results to part (a) using only MSE.
One example is shown below.
Sales
4
2
1
5 4 Period MA Forecast Error
6 3.00 3.00 3.00 9.00 50.00%
4 3.50 0.50 0.50 0.25 12.50%
4 4.00 0.00 0.00 0.00 0.00%
33
= 0.2 MSE = 54.53
= 0.3 MSE = 51.24
The best value for alpha is around 0.2 to 0.4, but the difference is not very large.
For the moving average, we find
MA = 2 and MSE = 69.88
42. The number of component parts used in a production process each of the last 10 weeks is
as follows.
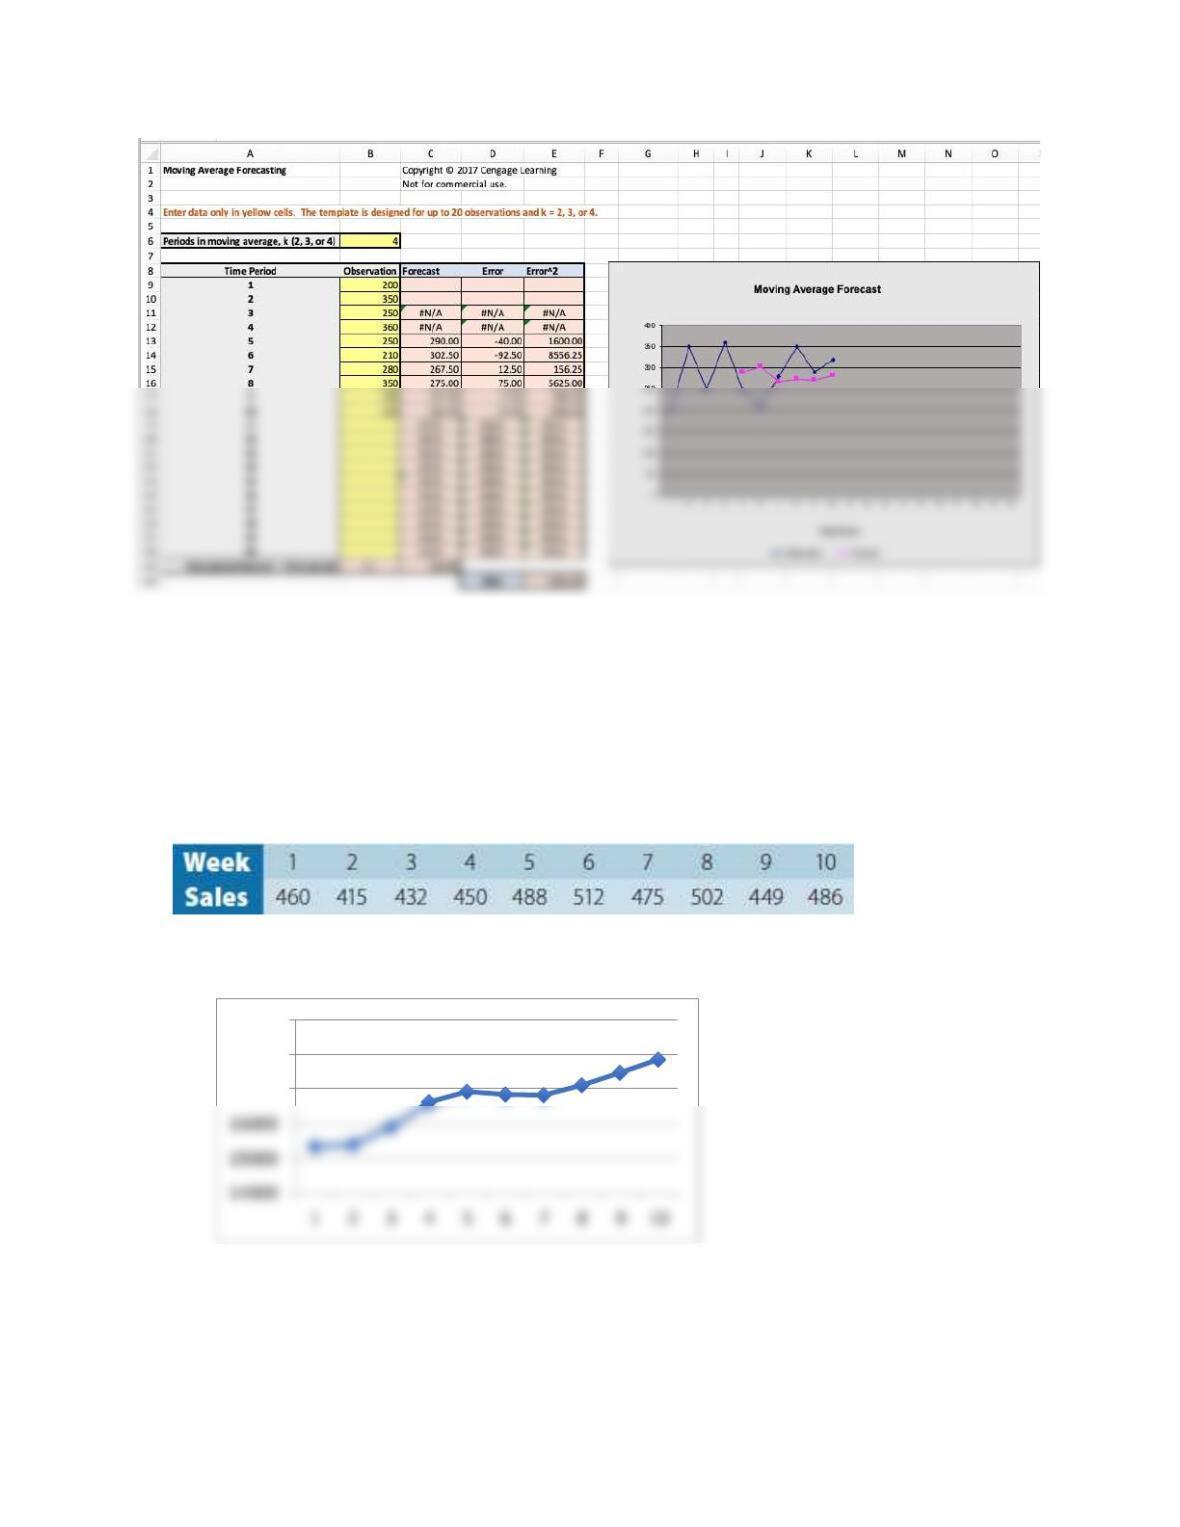
a. Use the Moving Average Excel template to develop moving average models with two,
three, and four periods. Compare them using MSE to determine which is best. From
the results below, the four-period forecast is the best.
For the moving average, we find
MA = 2 and MSE = 3,803
MA = 3 and MSE = 4,356
34
b. Using Equation 9.6, what is the best alpha value (smoothing constant) to begin your
analysis using exponential smoothing based on the results of part (a)?
= 2/[k + 1] = 2/[4 + 1] = 0.4
43. The monthly sales of a new business software package at a local discount software store
were as follows:
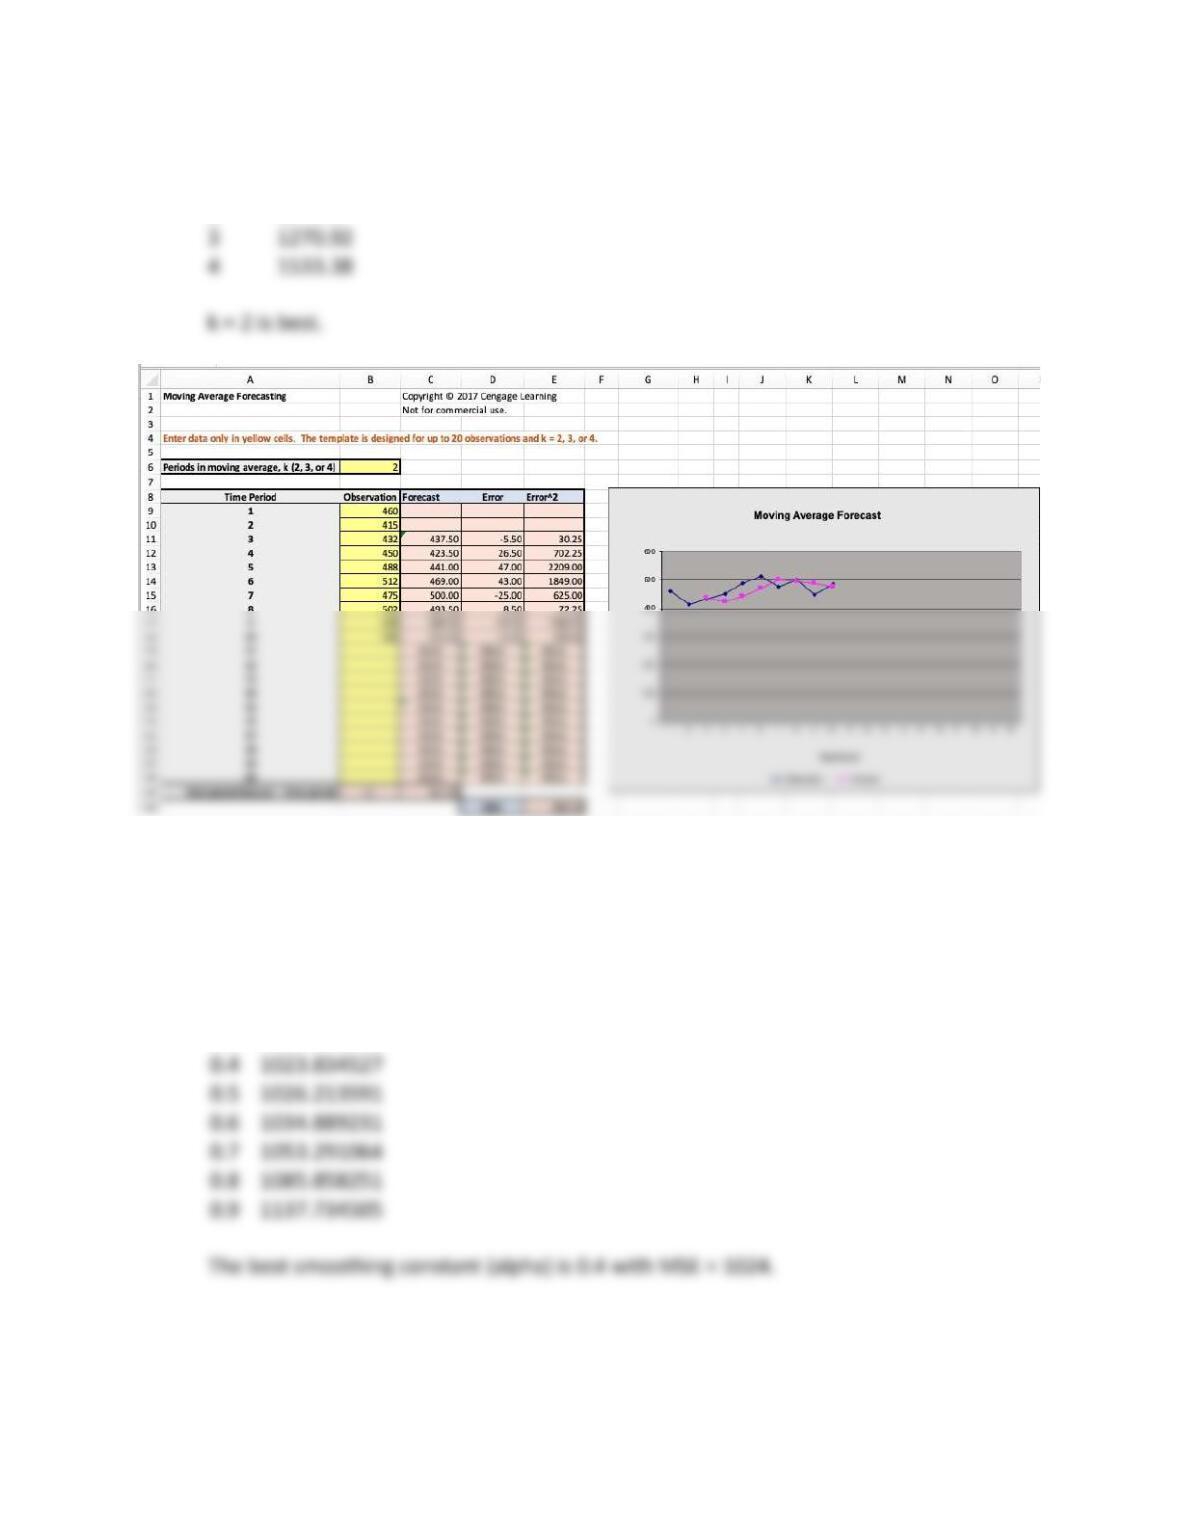
a. Plot the data on a spreadsheet and provide insights about the time series.
The time series is relatively stable.
b. Use the Moving Average Excel template to find the best number of weeks to use in a
moving-average forecast based on MSE.
17000
18000
19000
35
k MSE
2 894.78
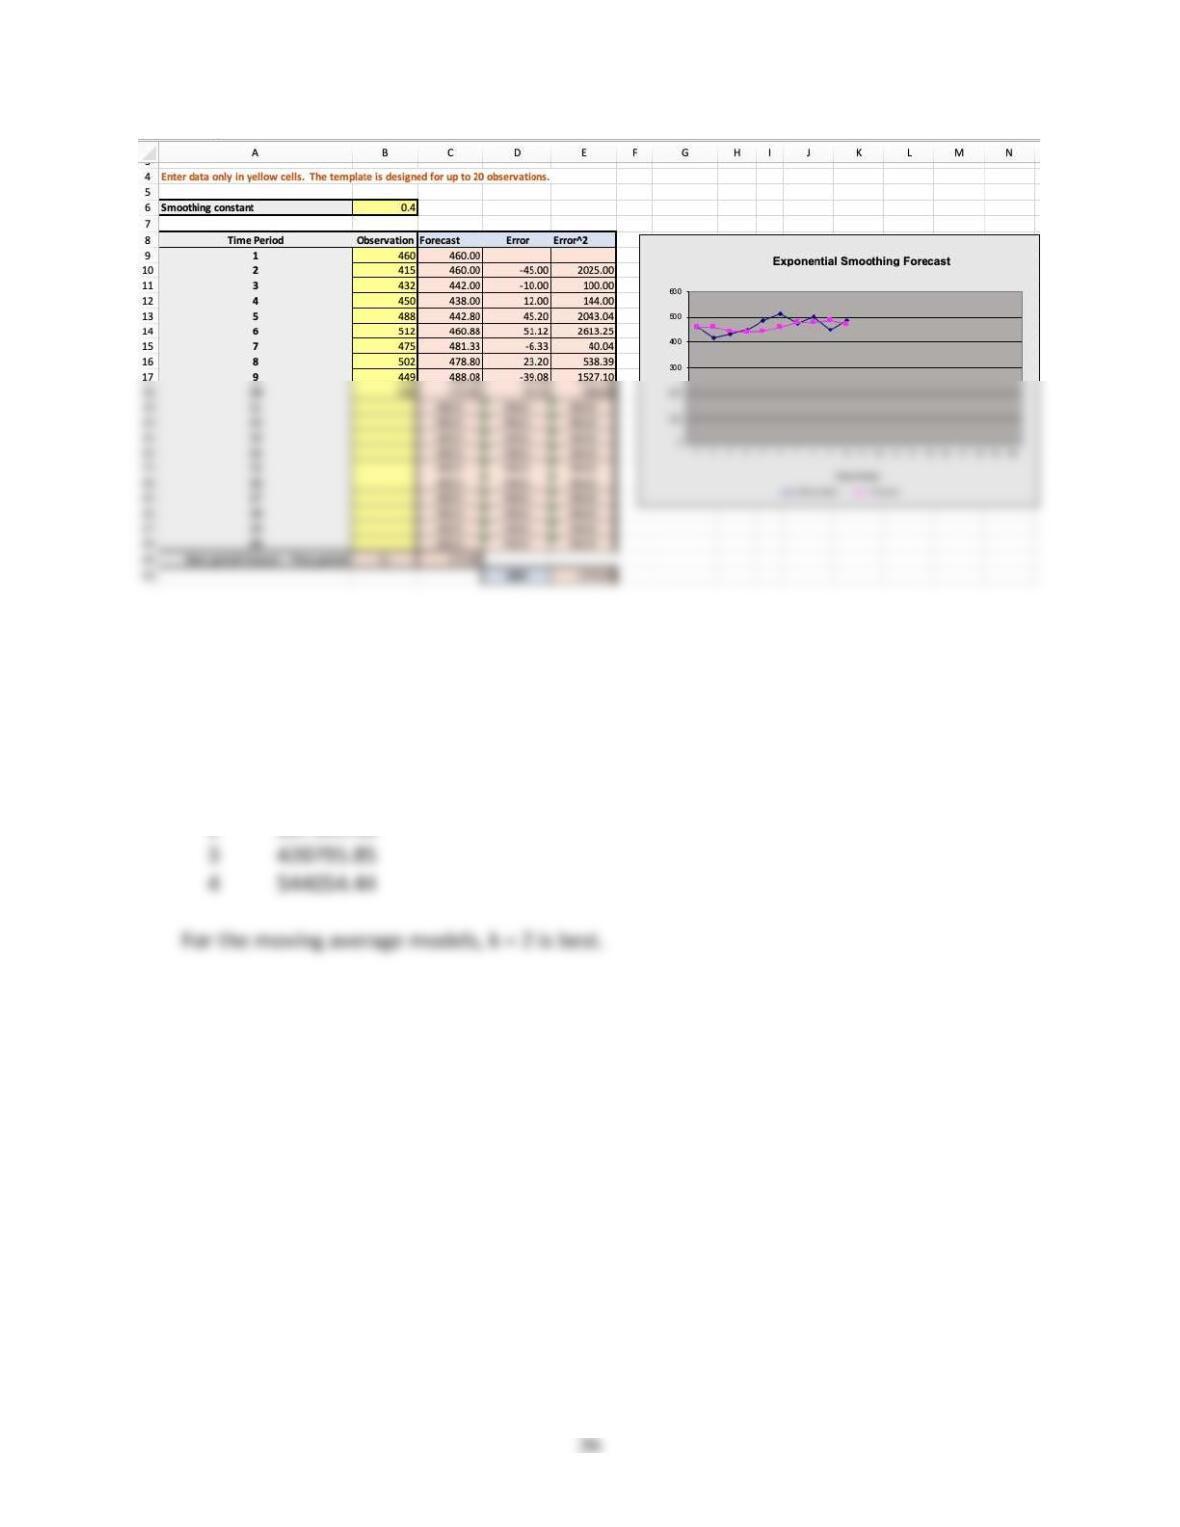
c. Use the Exponential Smoothing Excel template to find the best single exponential
smoothing model to forecast these data.
Alpha MSE
0.1
1039.080177
0.2
1032.628238
0.3
1026.055445
0.4
1023.834527
0.5
1026.213591
0.6
1034.889231
0.7
1053.291064
0.8
1085.858251
0.9
1137.734505
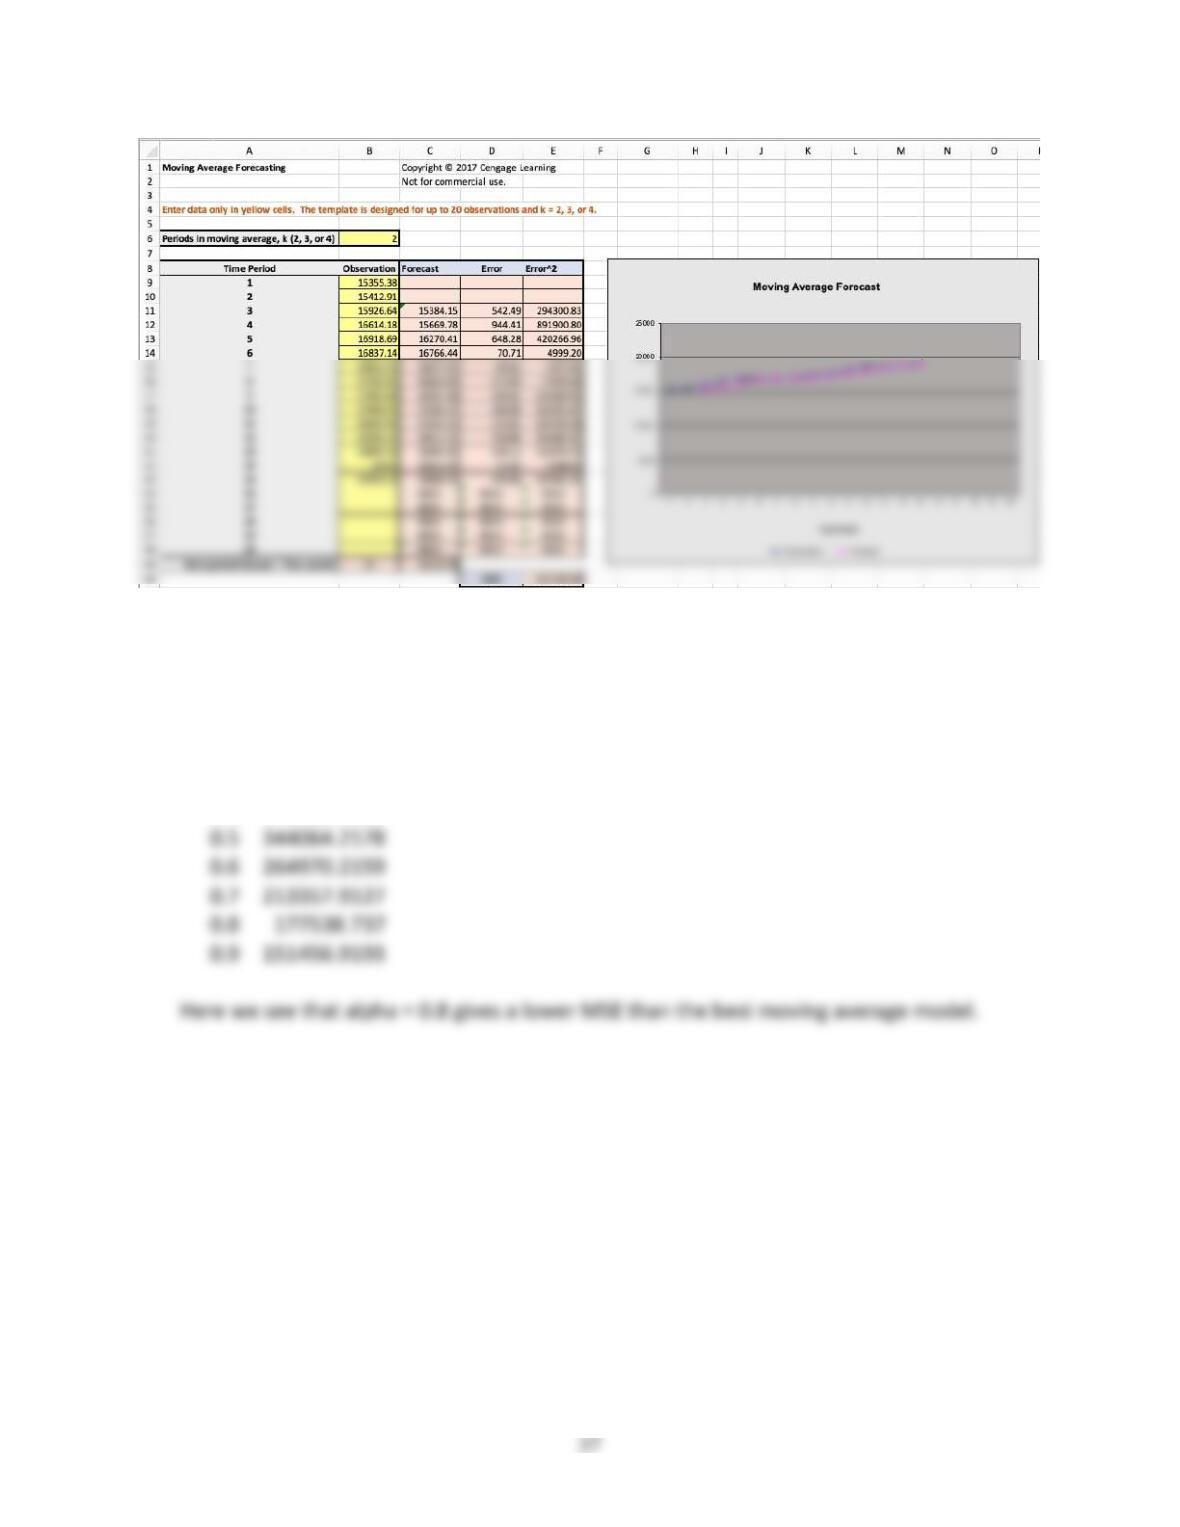
44. Using the factory energy cost data in Exhibit 9.11, find the best moving average and
exponential smoothing models using the Moving Average and Exponential Smoothing Excel
templates. Compare their forecasting ability with the regression model developed in the
chapter. Which model would you choose and why?
k MSE
For exponential smoothing:
Alpha MSE
0.1
2437086.953
0.2
1218910.64
0.3
716342.3987
0.4
475299.1805
0.5
344064.2178
0.6
264970.2159
0.7
213357.9127
0.8
177538.737
0.9
151456.9193
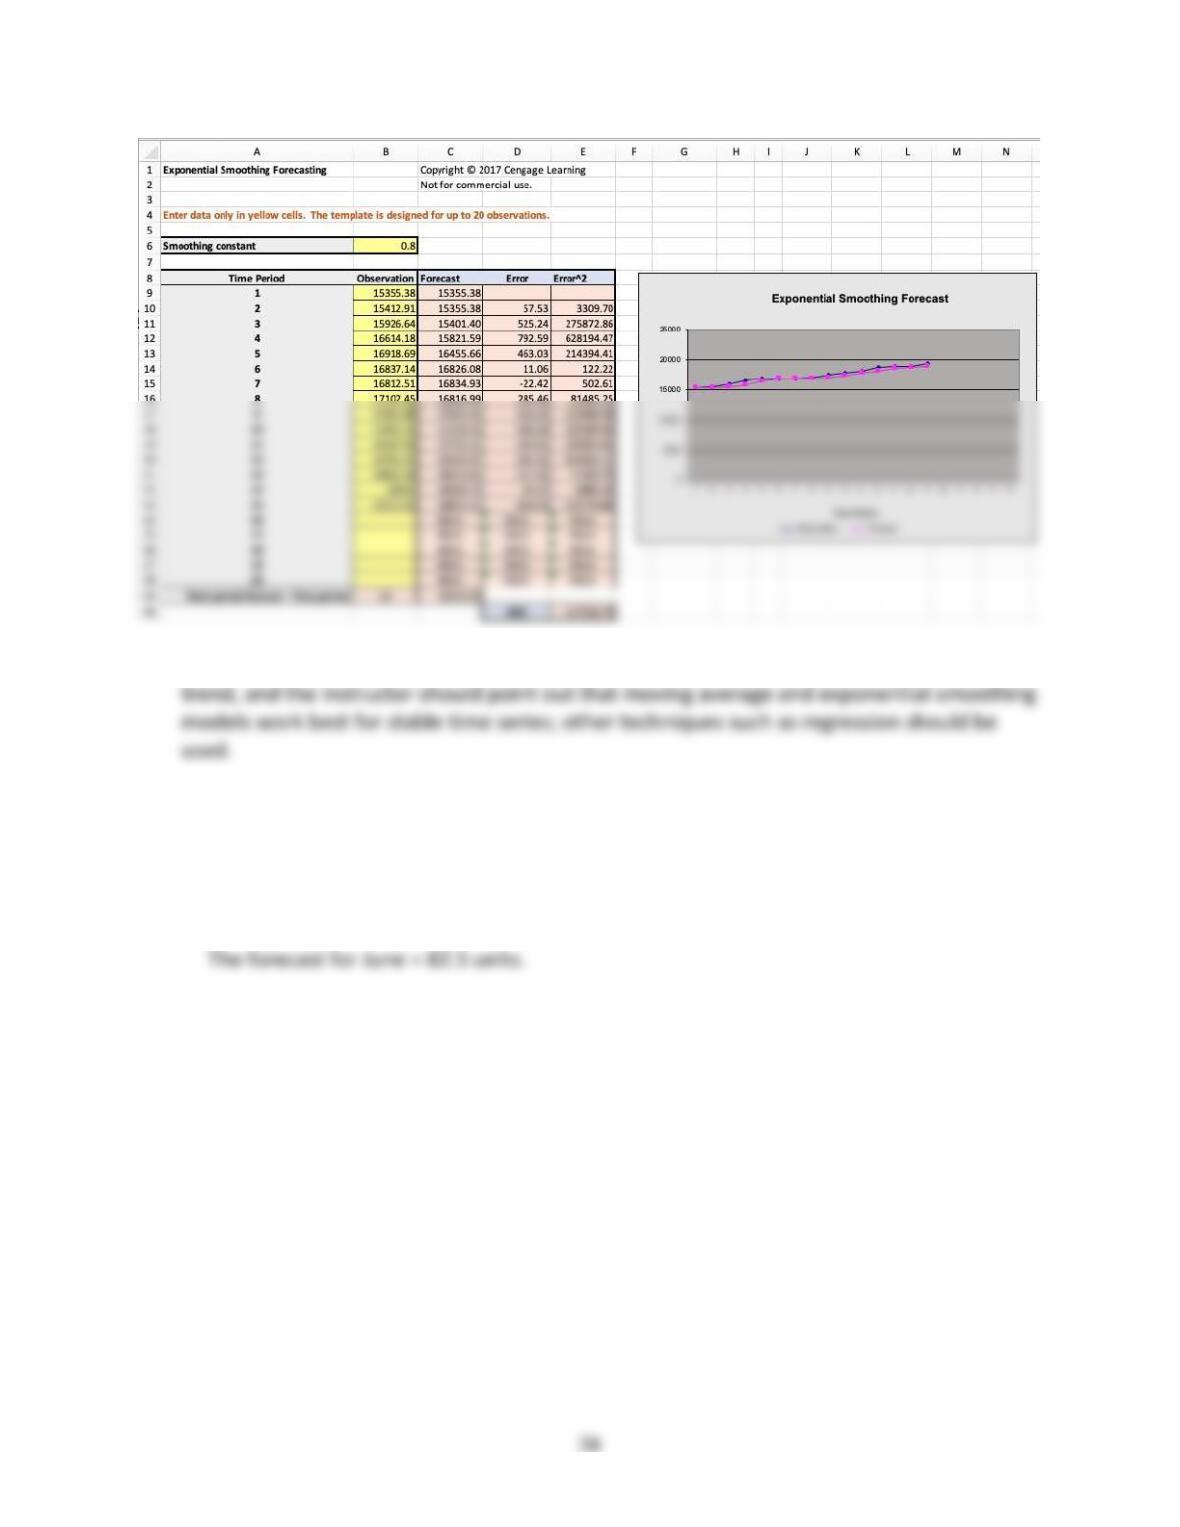
Note that in both cases, the forecasts lag the data. This occurs because we have a linear
45. The historical demand for the Panasonic Model 304 Pencil Sharpener is: January, 80;
February, 100; March, 60; April, 80; and May, 90 units.
a. Using a four-month moving average and the Moving Average Excel template, what is the
forecast for June?