
Period Demand Forecast
10 248
11 370

Period Demand Forecast
10 248
11 370

Period Demand Forecast
10 248 252.00
a = 0.25
11 370 251.00
1-a = 0.75

Month Demand Forecast Forecast Absolute Absolute % MFE = -2
Error Deviation Error MAD = 15
Jan-16 119 MAPE = 0.15
Feb-16 72
Apr-16 82 101 -19 19 0.24
Jun-16 131 92 39 39 0.30
Aug-16 116 108 8 8 0.07
Oct-16 95 105 -10 10 0.11
Dec-16 90 91 -1 10.01
Jan-17 91
Month Demand Forecast Forecast Absolute Absolute % MFE = 1
Error Deviation Error MAD = 14
Feb-16 72
Apr-16 82 97 -15 15 0.18
Jun-16 131 82 49 49 0.37
Aug-16 116 119 -3 30.03
Oct-16 95 100 -5 50.05
Dec-16 90 91 -1 10.01
Month Demand Forecast Forecast Absolute Absolute %
a = 0.3
Error Deviation Error
1-a = 0.7
Feb-16 72 105.70 -33.70 33.70 0.47 MAD = 17.07
Apr-16 82 100.81 -18.81 18.81 0.23
Jun-16 131 91.22 39.78 39.78 0.30
Aug-16 116 105.51 10.49 10.49 0.09
Oct-16 95 102.76 -7.76 7.76 0.08
Period Demand Forecast Forecast Absolute Absolute % MFE = -7
1221 MAPE = 0.12
2247 221 26 26 0.11
3228 247 -19 19 0.08
Period Demand Forecast Forecast Absolute Absolute % Weight on Period t-3: 0.25
Error Deviation Error Weight on Period t-2: 0.35
1221 Weight on Period t-1: 0.4
2247
3228 MFE = -19
4233 233 0 0 0.00 MAD = 24
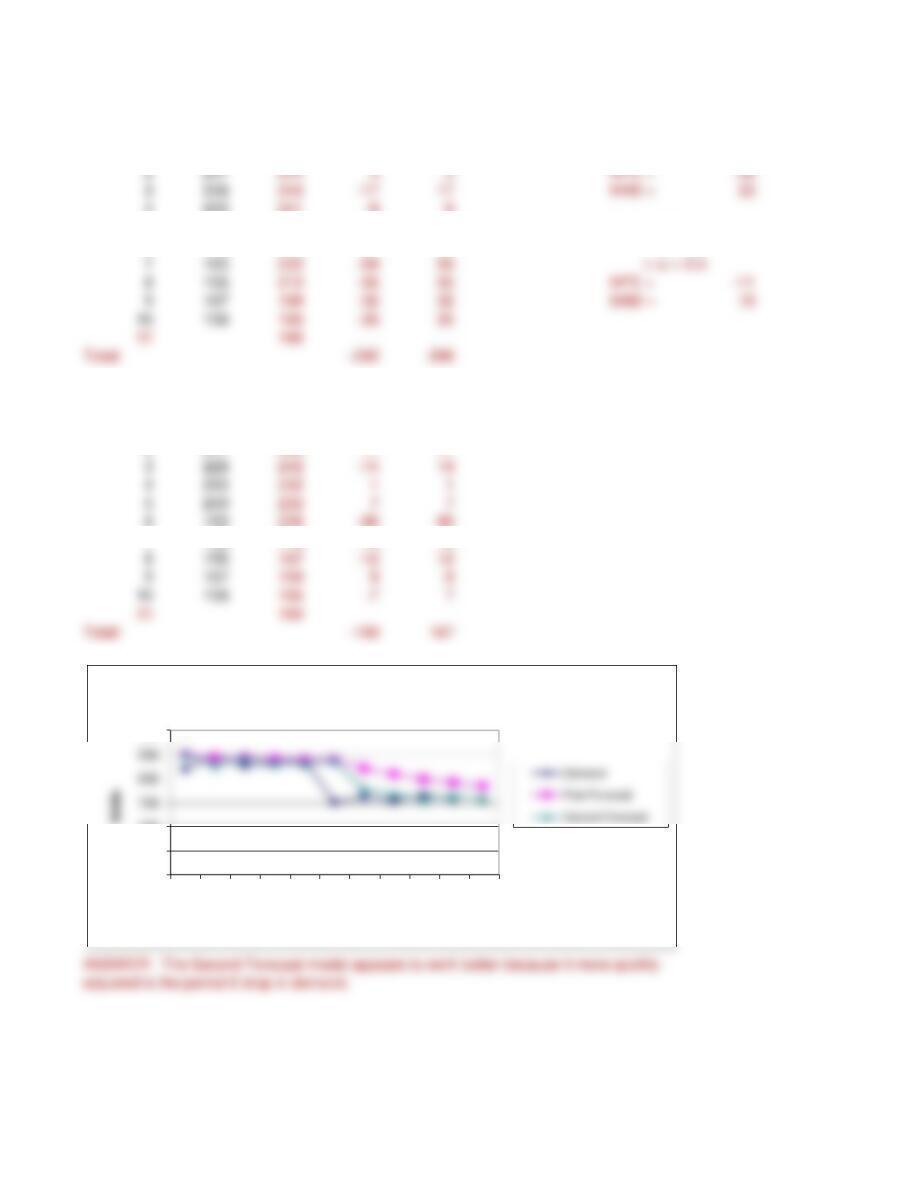
Period Demand First Forecast Absolute First Forecast
Forecast Error Deviation
a = 0.2
1221 250
1-a = 0.8
4233 241 -8 8
5240 240 0 0 Second Forecast
6152 240 -88 88
a = 0.7
1-a = 0.3
Period Demand Second Forecast Absolute
Forecast Error Deviation
1221 250
2247 230 17 17
6152 238 -86 86
7163 178 -15 15
0
50
100
300
1 2 3 4 5 6 7 8 9 10 11
Period
Plot of Demand vs. Forecasts

Month Demand Forecast Forecast Adjusted Unadj. Trend Forecast b.
Mar 220
Apr 2240 Forcast c.
May 1790 2000 2000 700
a = 0.5
b = 0.3
a = 0.5
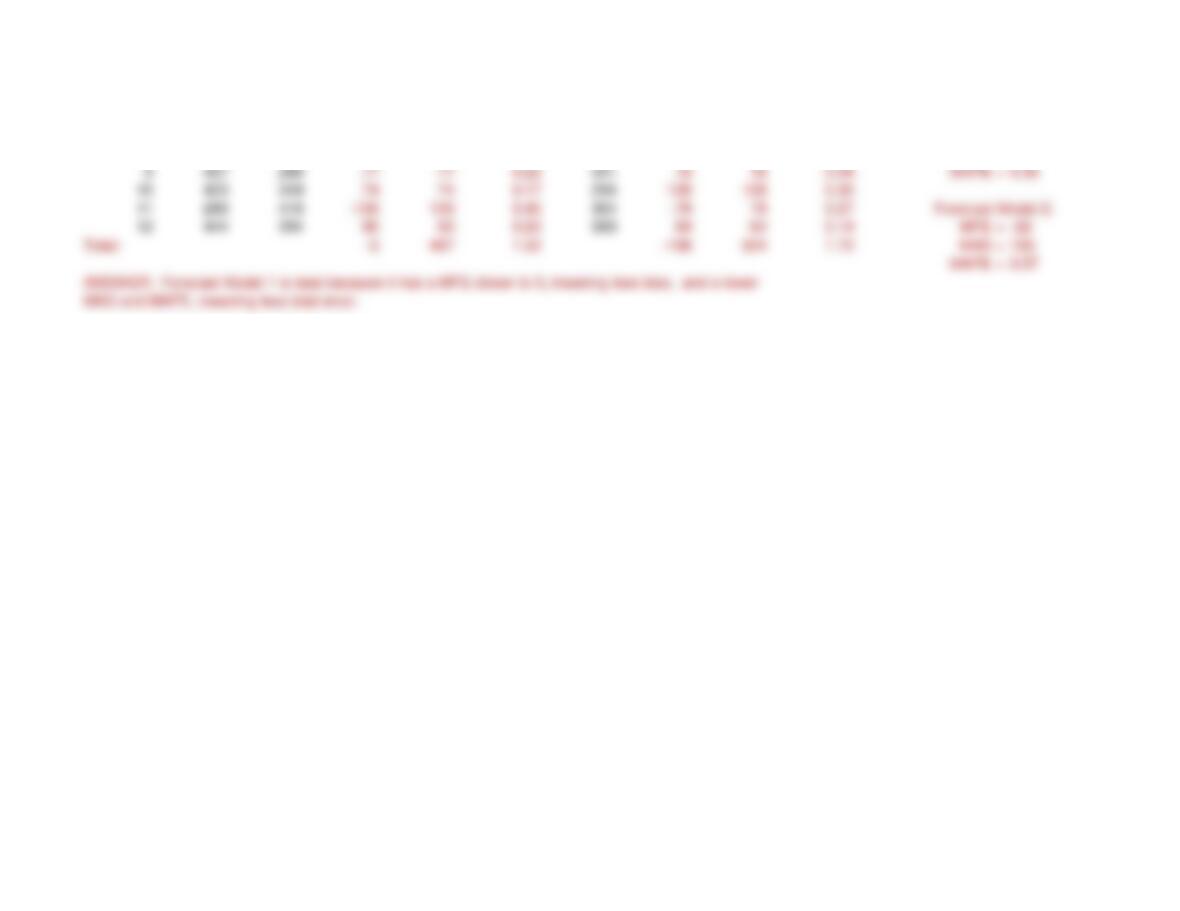
Period Actual Forecast Forecast Absolute Absolute % Forecast Forecast Absolute Absolute % Forecast Model 1:
Demand Model 1 Error Deviation Error Model 2 Error Deviation Error MFE = -1
8248 364 -116 116 0.47 486 -238 238 0.96 MAD = 97