Problem 9-18
Buenosdientes Candy Company
Scatter Diagram
This spreadsheet is designed for up to 25 single values. Enter data ONLY in yellow-shaded cells.
Enter the number of values in cell E6. Then enter your data below.
If X-axis value differ from those shown, then substitute and clear unneeded ones.
Number of VALUES (<= 30) 25
12345678910 11 12 13 14 15 16 17 18 19 20 21 22 23 24 25
Defects 156738243489816 14 3687462367
Sample Defects
1 1
2 5
3 6
4 7
5 3
6 8
7 2
8 4
9 3
10 4
11 8
12 9
13 8
16 3
17 6
18 8
19 7
20 4
21 6
22 2
23 3
24 6
25 7
16
18
Samples
Prob. 9-18 Defects Per Sample of 100
Problem 9-18
Buenosdientes Candy Company
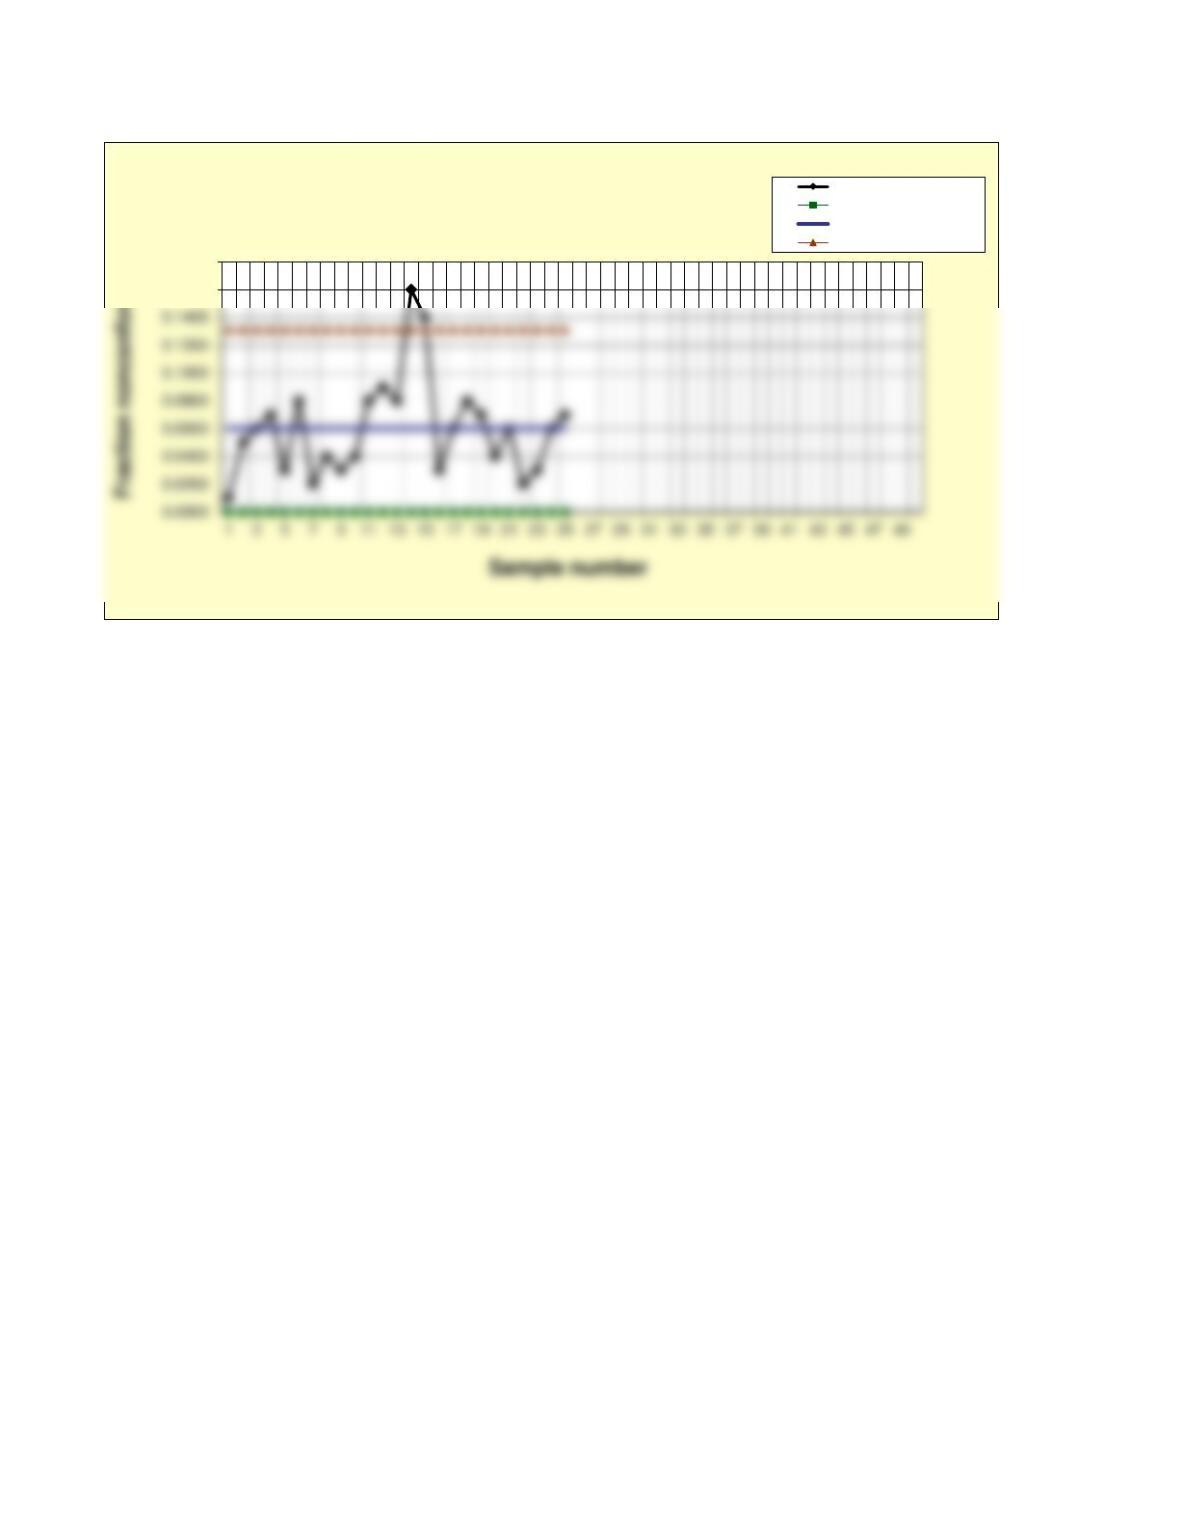
Fraction Nonconforming (p) Chart
This spreadsheet is designed for up to 50 samples. Enter data ONLY in yellow-shaded cells.
Click on the sheet tab to display the control chart (some rescaling may be needed).
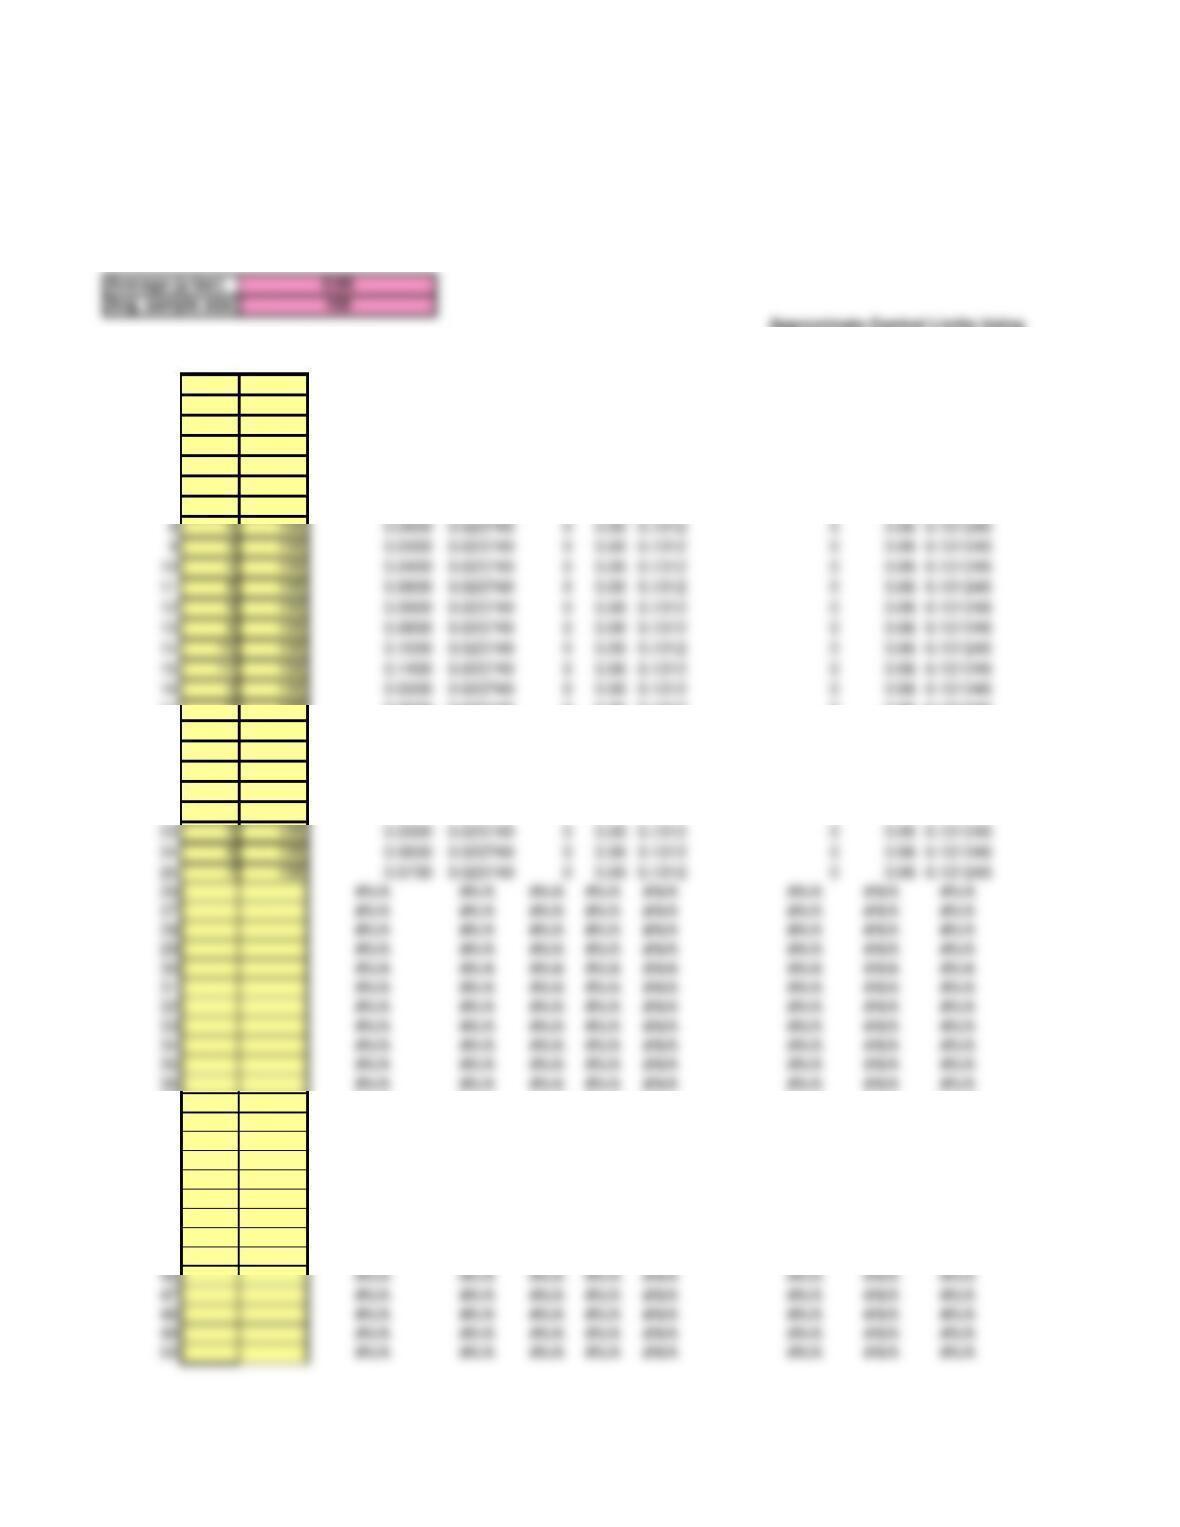
Approximate Control Limits Using
Sample Fraction Standard Average Sample Size Calculations
Sample Value Size Nonconforming Deviation LCLp CL UCLp LCLp CL UCLp
1 1 100 0.0100 0.023749 0 0.06 0.1312 0 0.06 0.131246
2 5 100 0.0500 0.023749 0 0.06 0.1312 0 0.06 0.131246
3 6 100 0.0600 0.023749 0 0.06 0.1312 0 0.06 0.131246
4 7 100 0.0700 0.023749 0 0.06 0.1312 0 0.06 0.131246
5 3 100 0.0300 0.023749 0 0.06 0.1312 0 0.06 0.131246
6 8 100 0.0800 0.023749 0 0.06 0.1312 0 0.06 0.131246
7 2 100 0.0200 0.023749 0 0.06 0.1312 0 0.06 0.131246
8 4 100 0.0400 0.023749 0 0.06 0.1312 0 0.06 0.131246
9 3 100 0.0300 0.023749 0 0.06 0.1312 0 0.06 0.131246
10 4100 0.0400 0.023749 0 0.06 0.1312 0 0.06 0.131246
11 8100 0.0800 0.023749 0 0.06 0.1312 0 0.06 0.131246
12 9100 0.0900 0.023749 0 0.06 0.1312 0 0.06 0.131246
13 8100 0.0800 0.023749 0 0.06 0.1312 0 0.06 0.131246
16 3100 0.0300 0.023749 0 0.06 0.1312 0 0.06 0.131246
17 6100 0.0600 0.023749 0 0.06 0.1312 0 0.06 0.131246
18 8100 0.0800 0.023749 0 0.06 0.1312 0 0.06 0.131246
19 7100 0.0700 0.023749 0 0.06 0.1312 0 0.06 0.131246
20 4100 0.0400 0.023749 0 0.06 0.1312 0 0.06 0.131246
21 6100 0.0600 0.023749 0 0.06 0.1312 0 0.06 0.131246
22 2100 0.0200 0.023749 0 0.06 0.1312 0 0.06 0.131246
23 3100 0.0300 0.023749 0 0.06 0.1312 0 0.06 0.131246
24 6100 0.0600 0.023749 0 0.06 0.1312 0 0.06 0.131246
26 #N/A #N/A #N/A #N/A #N/A #N/A #N/A #N/A
27 #N/A #N/A #N/A #N/A #N/A #N/A #N/A #N/A
28 #N/A #N/A #N/A #N/A #N/A #N/A #N/A #N/A
29 #N/A #N/A #N/A #N/A #N/A #N/A #N/A #N/A
30 #N/A #N/A #N/A #N/A #N/A #N/A #N/A #N/A
31 #N/A #N/A #N/A #N/A #N/A #N/A #N/A #N/A
32 #N/A #N/A #N/A #N/A #N/A #N/A #N/A #N/A
33 #N/A #N/A #N/A #N/A #N/A #N/A #N/A #N/A
34 #N/A #N/A #N/A #N/A #N/A #N/A #N/A #N/A
35 #N/A #N/A #N/A #N/A #N/A #N/A #N/A #N/A
36 #N/A #N/A #N/A #N/A #N/A #N/A #N/A #N/A
37 #N/A #N/A #N/A #N/A #N/A #N/A #N/A #N/A
38 #N/A #N/A #N/A #N/A #N/A #N/A #N/A #N/A
39 #N/A #N/A #N/A #N/A #N/A #N/A #N/A #N/A
40 #N/A #N/A #N/A #N/A #N/A #N/A #N/A #N/A
41 #N/A #N/A #N/A #N/A #N/A #N/A #N/A #N/A
42 #N/A #N/A #N/A #N/A #N/A #N/A #N/A #N/A
43 #N/A #N/A #N/A #N/A #N/A #N/A #N/A #N/A
44 #N/A #N/A #N/A #N/A #N/A #N/A #N/A #N/A
45 #N/A #N/A #N/A #N/A #N/A #N/A #N/A #N/A
46 #N/A #N/A #N/A #N/A #N/A #N/A #N/A #N/A
47 #N/A #N/A #N/A #N/A #N/A #N/A #N/A #N/A
48 #N/A #N/A #N/A #N/A #N/A #N/A #N/A #N/A
49 #N/A #N/A #N/A #N/A #N/A #N/A #N/A #N/A
0.1600
0.1800
Prob 9-18 Attribute (p) Chart
Fraction nonconforming
Lower control limit
Center line
Upper control limit