1
Instructor’s Manual – OMSC2 – Collier/Evans – C9 Forecasting and Demand Planning
This chapter introduces students to forecasting and demand planning concepts. We discuss the
importance of forecasting, explain basic concepts of forecasting and time series, apply simple
moving average, exponential smoothing models, and regression, discuss judgmental forecasting
and how forecasting is applied in practice.
Two Excel spreadsheet templates – Moving Average and Exponential Smoothing are available in
MindTap and illustrated in solved problems to assist students in doing homework problems.
Questions and problems are provided in four categories:
1. Review questions
2. Discussion questions and experiential activities
The chapter has three cases:
1. United Dairies, Inc. is the first case study. It focuses on predicting future demand for a
2. The second case, BankUSA: Forecasting Help desk Demand by Day, allows students to
3. The integrative case study, Hudson Jewelers, with case assignment questions in all chapters,
KEY TERMS
Bias is the tendency of forecasts to consistently be larger or smaller than the actual values of the
time series.
Grassroots forecasting is asking those who are close to the end consumer, such as salespeople,
about the customers’ purchasing plans.
Irregular variation is a one-time variation that is explainable.
Judgmental forecasting relies upon opinions and expertise of people in developing forecasts.
A moving average (MA) forecast is an average of the most recent “ k” observations in a time
series.
Seasonal patterns are characterized by repeatable periods of ups and downs over short periods
of time.
Single exponential smoothing (SES) is a forecasting technique that uses a weighted average of
past time-series values to forecast the value of the time series in the next period.
3
REVIEW QUESTIONS
1. Define forecasting and explain why it is important.
Forecasting is the process of projecting the values of one or more variables into the future.
Forecasting is a key component in many types of integrated operating systems, such as
supply chain management, customer relationship management, and revenue management
2. How is forecasting used throughout the value chain?
Accurate forecasts are needed throughout the value chain, as illustrated in Exhibit 9.1,
3. Describe the different time horizons used in forecasting and provide examples of each.
Long-range forecasts cover a planning horizon of 1 to 10 years and are necessary to plan
for the expansion of facilities and to determine future needs for land, labor, and
4. What is a time series? Explain the four characteristics that time series may exhibit and
provide some practical examples.
A time series is a set of observations measured at successive points in time or over
Examples (all-time series have random and/or irregular variations):
Trends: U.S. employment growth or decline, demand for iPads, eBook versus hard copy
book sales, disposable income by ZIP code, hotel and rental car reservations, USA Gross
Domestic Product, television viewers, etc.
5. Explain the importance of selecting the proper planning horizon in forecasting.
The planning horizon is the length of time on which a forecast is based. Long-range forecasts
cover a planning horizon of 1 to 10 years and are necessary to plan for the expansion of
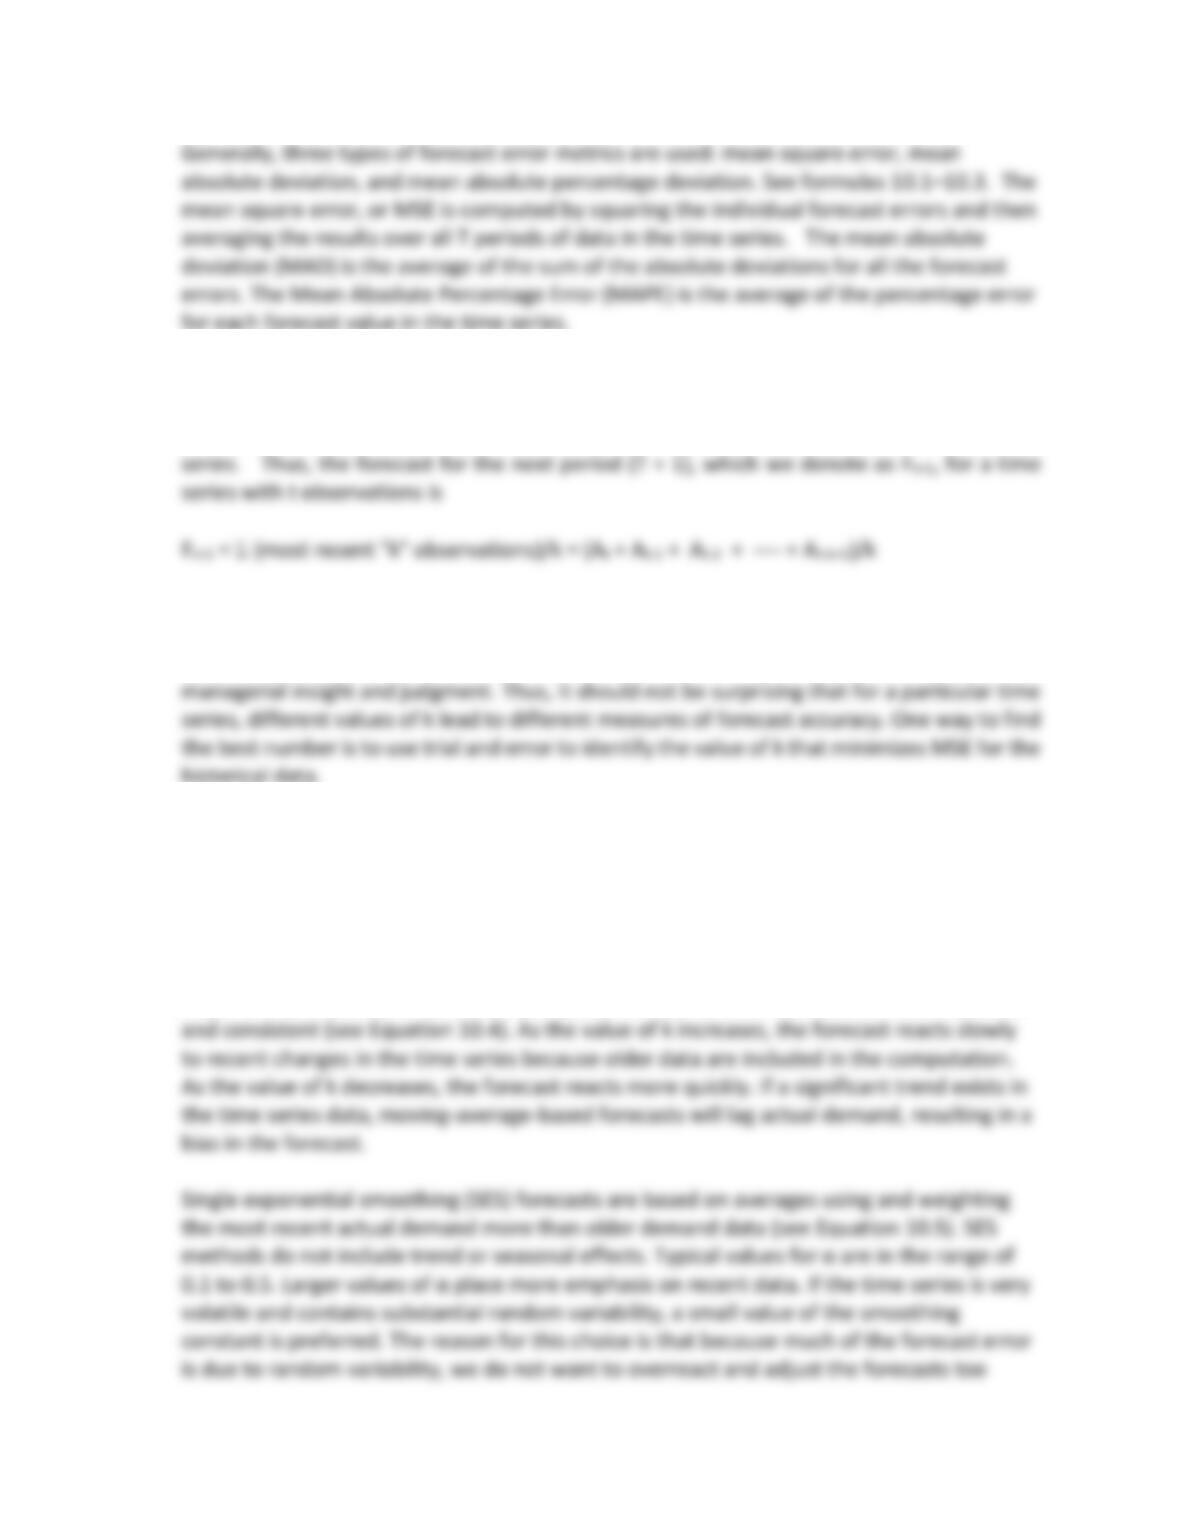
6. Define forecast error. Explain how to calculate the three common measures of forecast
accuracy.
All forecasts are subject to error and understanding the nature and size of errors is
important to making good decisions. Forecast error is the difference between the observed
5
7. Explain how to compute single moving average forecasts.
A moving average (MA) forecast is an average of the most recent “k” observations in a time
8. Explain how to determine the number of data values (k) in a moving average forecast.
The number of data values to be included in the moving average is often based on
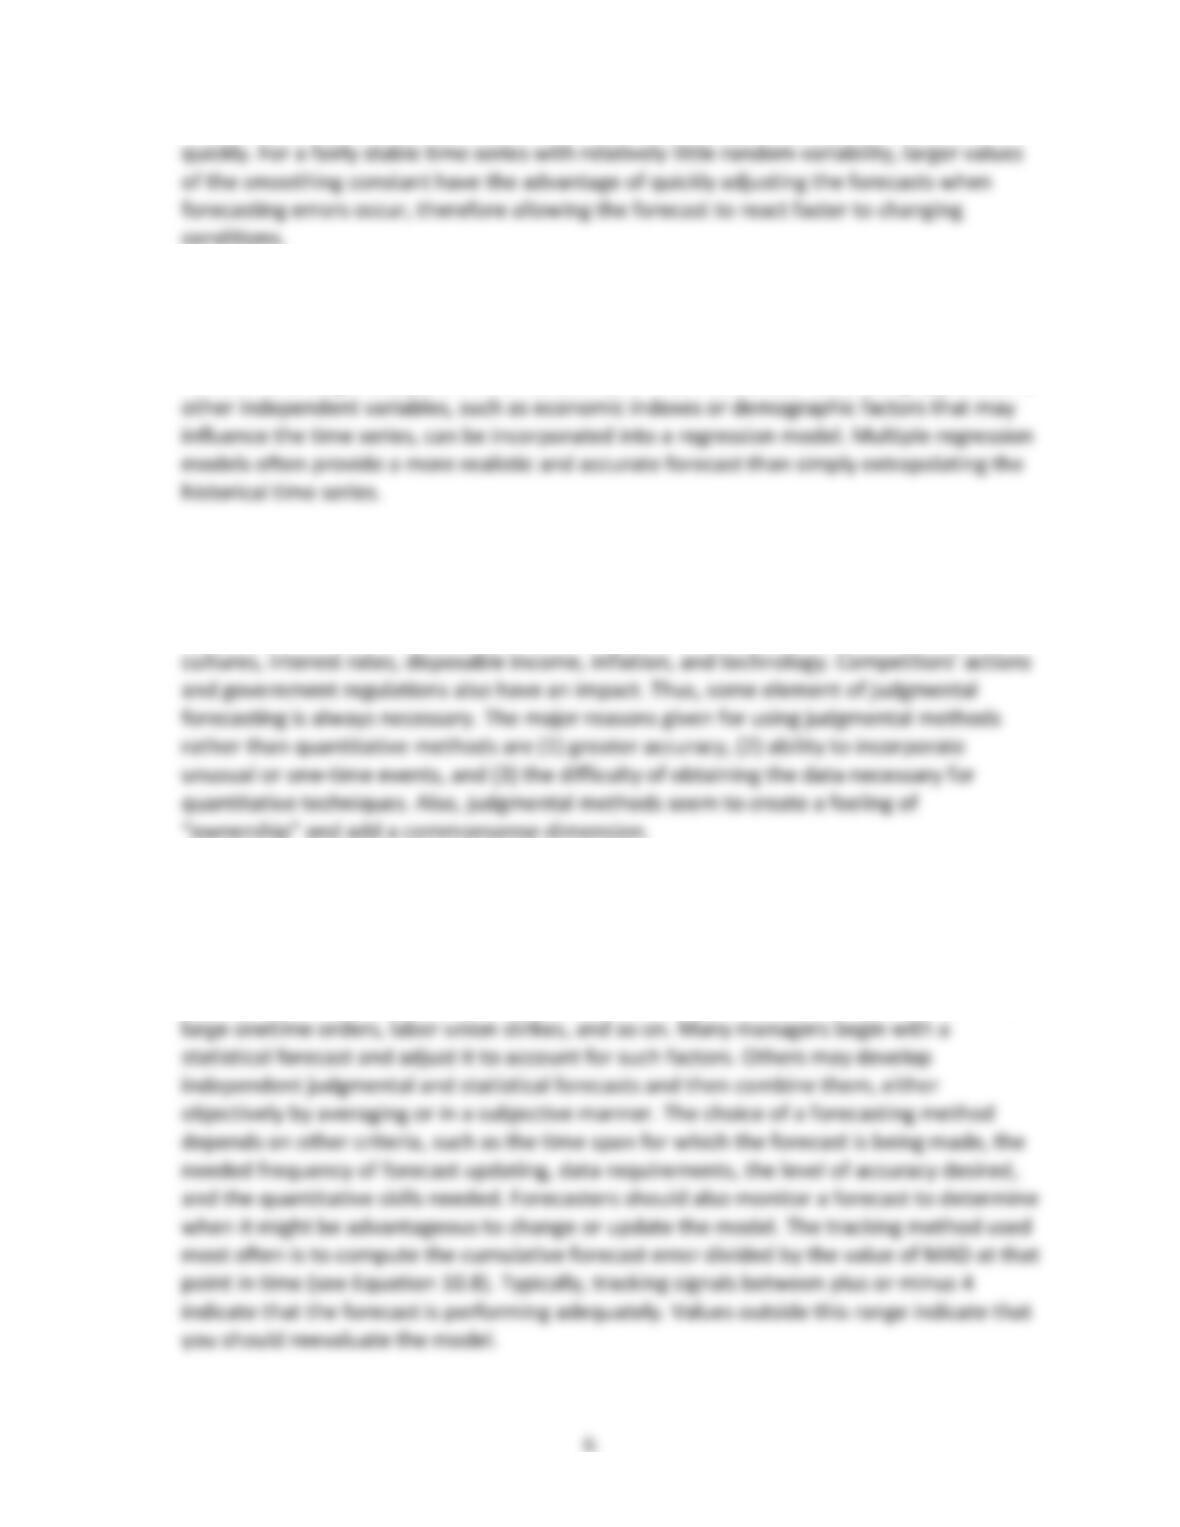
9. Explain how to apply simple moving average and exponential smoothing models.
The simple moving average concept is based on the idea of averaging random fluctuations
in a time series to identify the underlying direction in which the time series is changing.
Moving average (MA) methods work best for short planning horizons when there is no
major trend, seasonal, or business cycle patterns; that is, when demand is relatively stable
10. Describe how to apply regression as a forecasting approach.
Simple regression models forecast the value of a time series (the dependent variable) as a
function of a single independent variable, time. In more advanced forecasting applications,
11. Explain the role of judgment in forecasting.
When no historical data are available, only judgmental forecasting is possible. The demand
for goods and services is affected by a variety of factors, such as global markets and
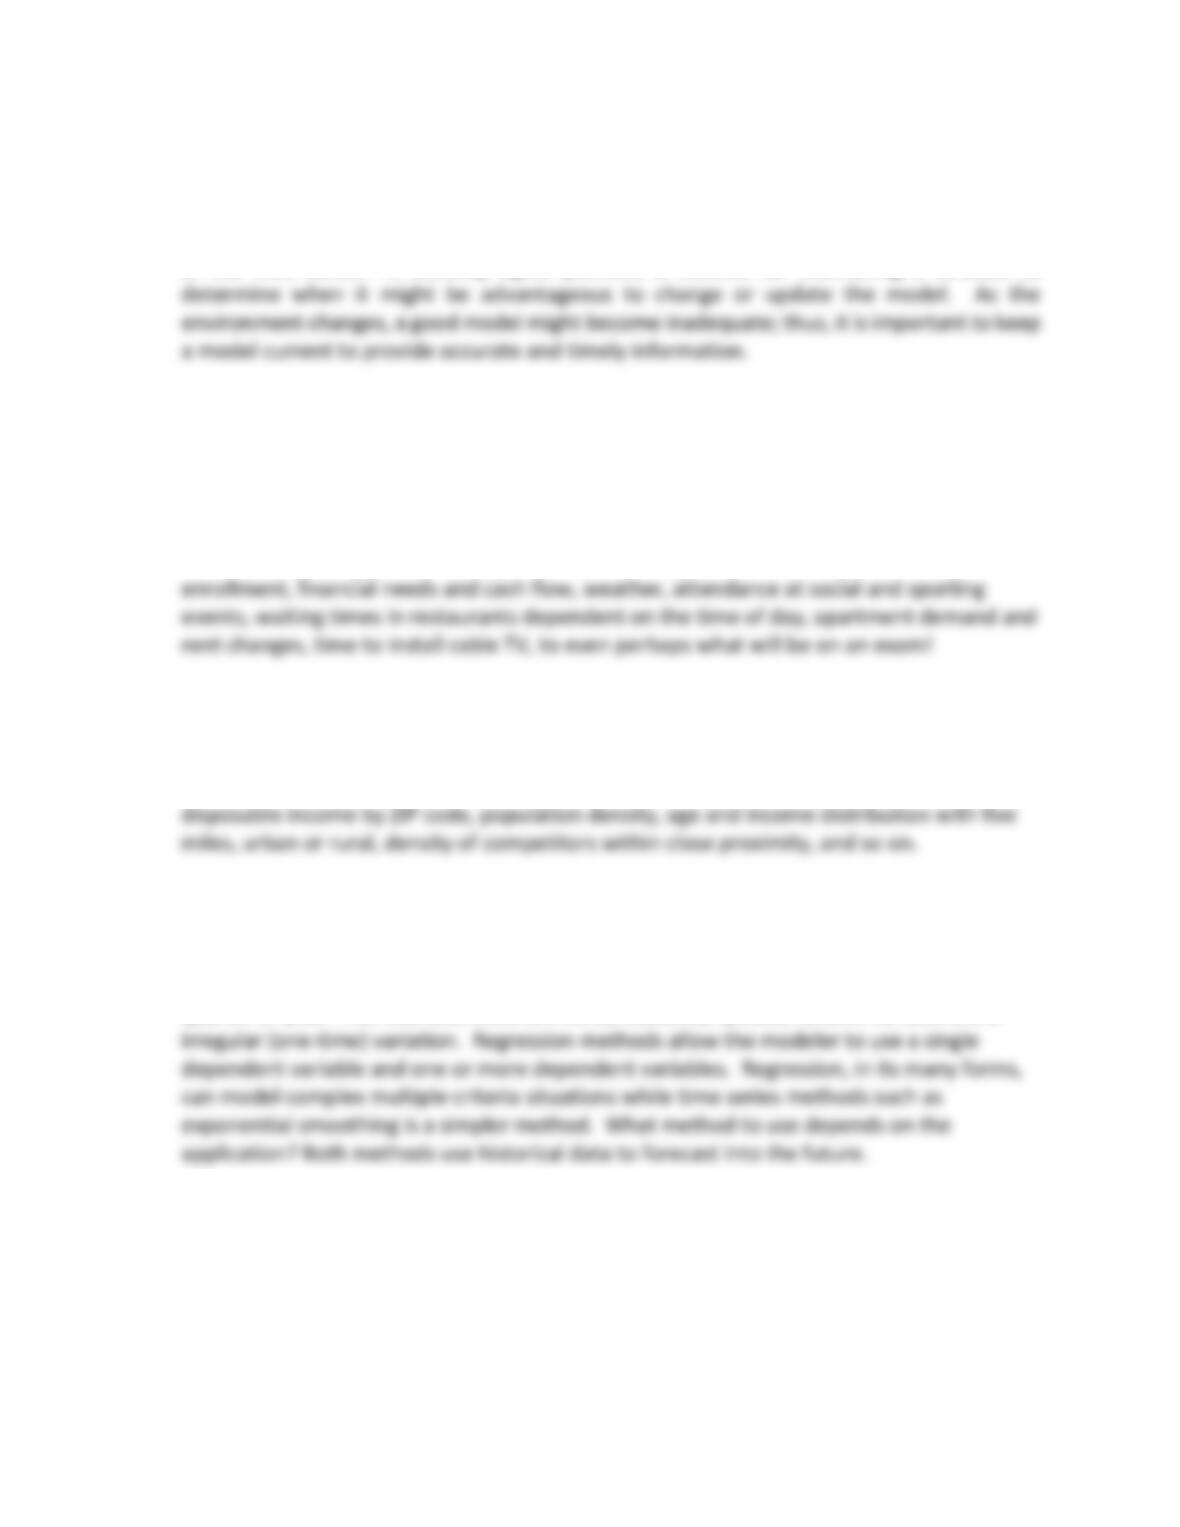
12. Describe how statistical and judgmental forecasting techniques are applied in practice.
In practice, managers use a variety of judgmental and quantitative forecasting techniques.
Statistical methods alone cannot account for such factors as sales promotions, competitive
strategies, unusual economic or environmental disturbances, new product introductions,
7
13. What is bias in forecasting? Explain the importance of using tracking signals to monitor
forecasts.
Bias is the tendency of forecasts to consistently be larger or smaller than the actual values
DISCUSSION QUESTIONS AND EXPERIENTIAL ACTIVITIES
14. Discuss some forecasting issues that you encounter in your daily life. How do you make
your forecasts?
Students might suggest such things as cell phone usage, vehicle mileage, university
15. Suppose that you were thinking about opening a new restaurant. How would you go about
forecasting demand and sales?
Sister restaurants in similar locations and demographics using variables such as customer
16. If a manager asked you whether to use time-series forecasting models or regression-based
forecasting models, what would you tell him or her?
Time series methods always include time as a variable such as by hour, day, week, month,
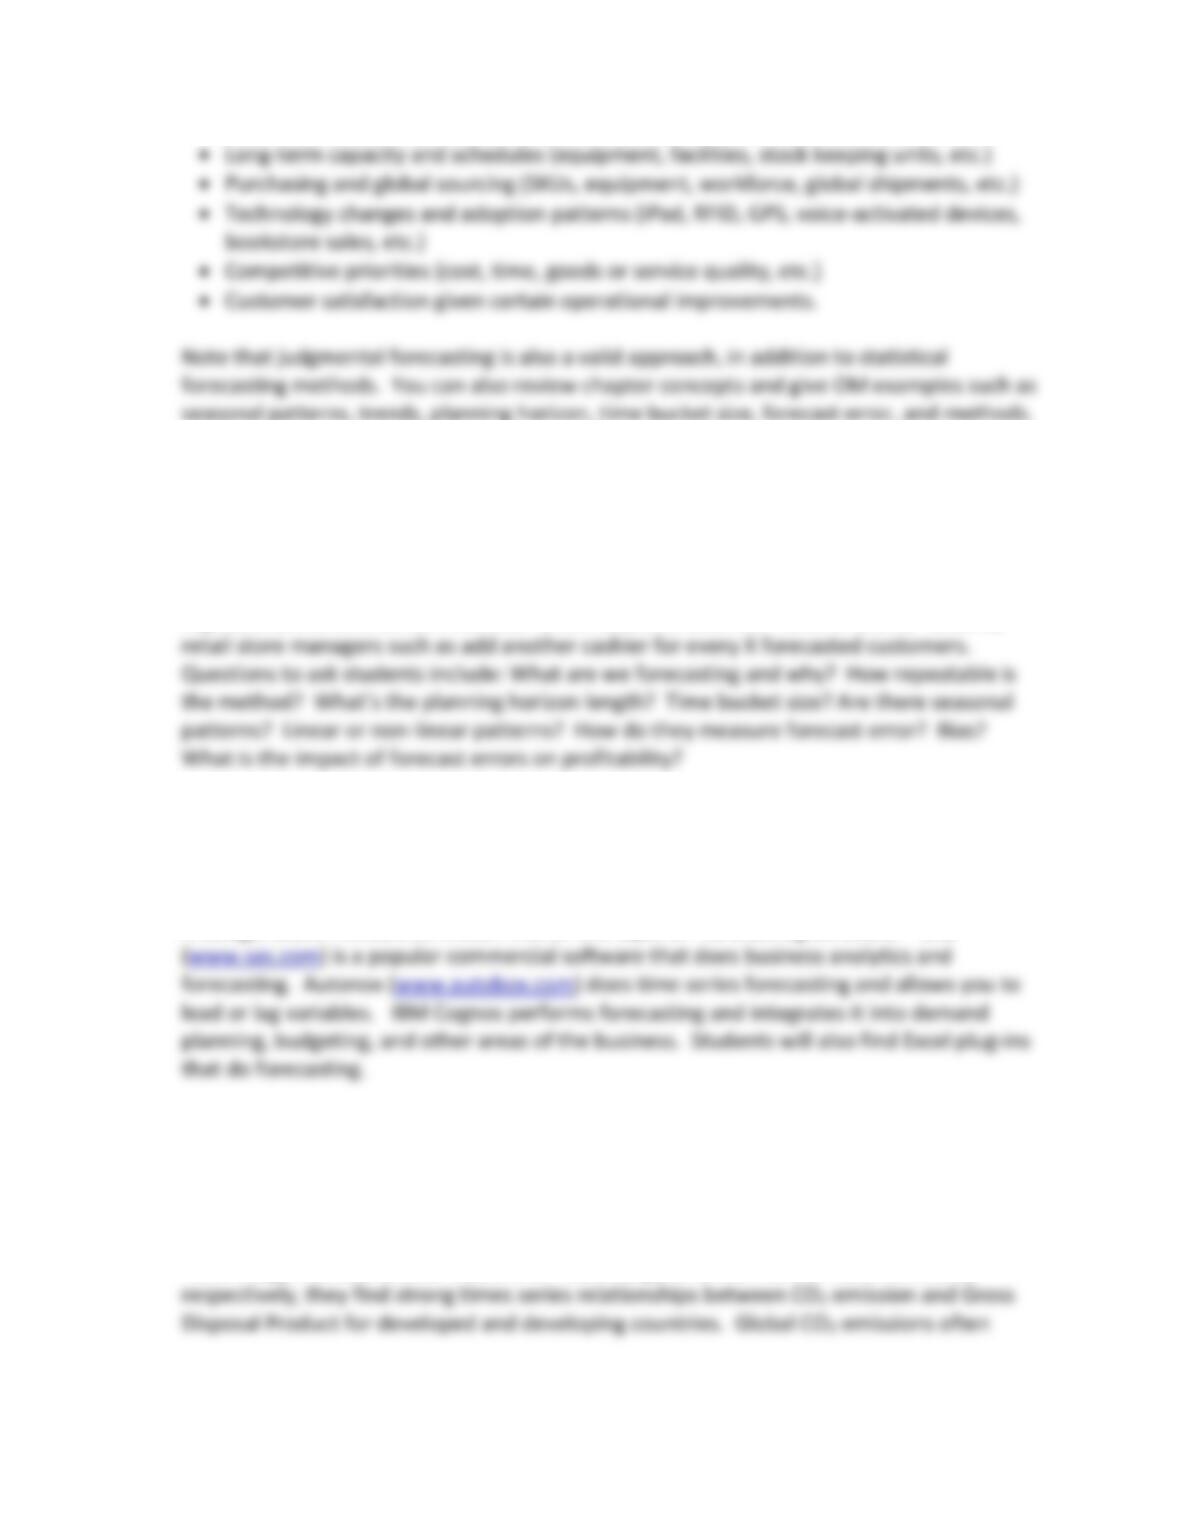
17. Looking back at the chapters you have studied so far, discuss how good forecasting can
improve operations decisions in these areas.
Good forecasting is essential to improve process and value chain performance.
• Demand forecasting (goods and services, setup assembly line, etc.)
• Short-term capacity and schedules (call center or factory staffing, etc.)
8
18. Interview a current or previous employer about how he or she makes forecasts. Document
in one page what you discovered, and describe it using the ideas discussed in this chapter.
Students will find companies and managers who use a wide range of methods to make
forecasts such as the Delphi Method, grass roots forecasting, linear and non-linear
regression, and time series methods. Often students discover “rules of thumb” used by
19. Research and write a short paper (two pages maximum) that summarizes the capabilities of
commercial software available for forecasting. How does such software compare with
using Excel?
A Google search reveals 24 million hits on the topic of “forecasting software.” SAS
20. Search the Internet for some time-series data that relates to sustainability, for example,
environmental emissions. What types of patterns do these data exhibit? Apply forecasting
techniques in this chapter to forecast ten years into the future.
In an article by R. Schmalensee, T.M. Stoker, and R.A Jackson, Massachusetts Institute of
Technology, Massachusetts Institute of Technology, and U.S. Federal Reserve Board,
COMPUTATIONAL PROBLEMS AND EXERCISES
These exercises require you to apply the formulas and methods described in the chapter. The
problems should be solved manually.
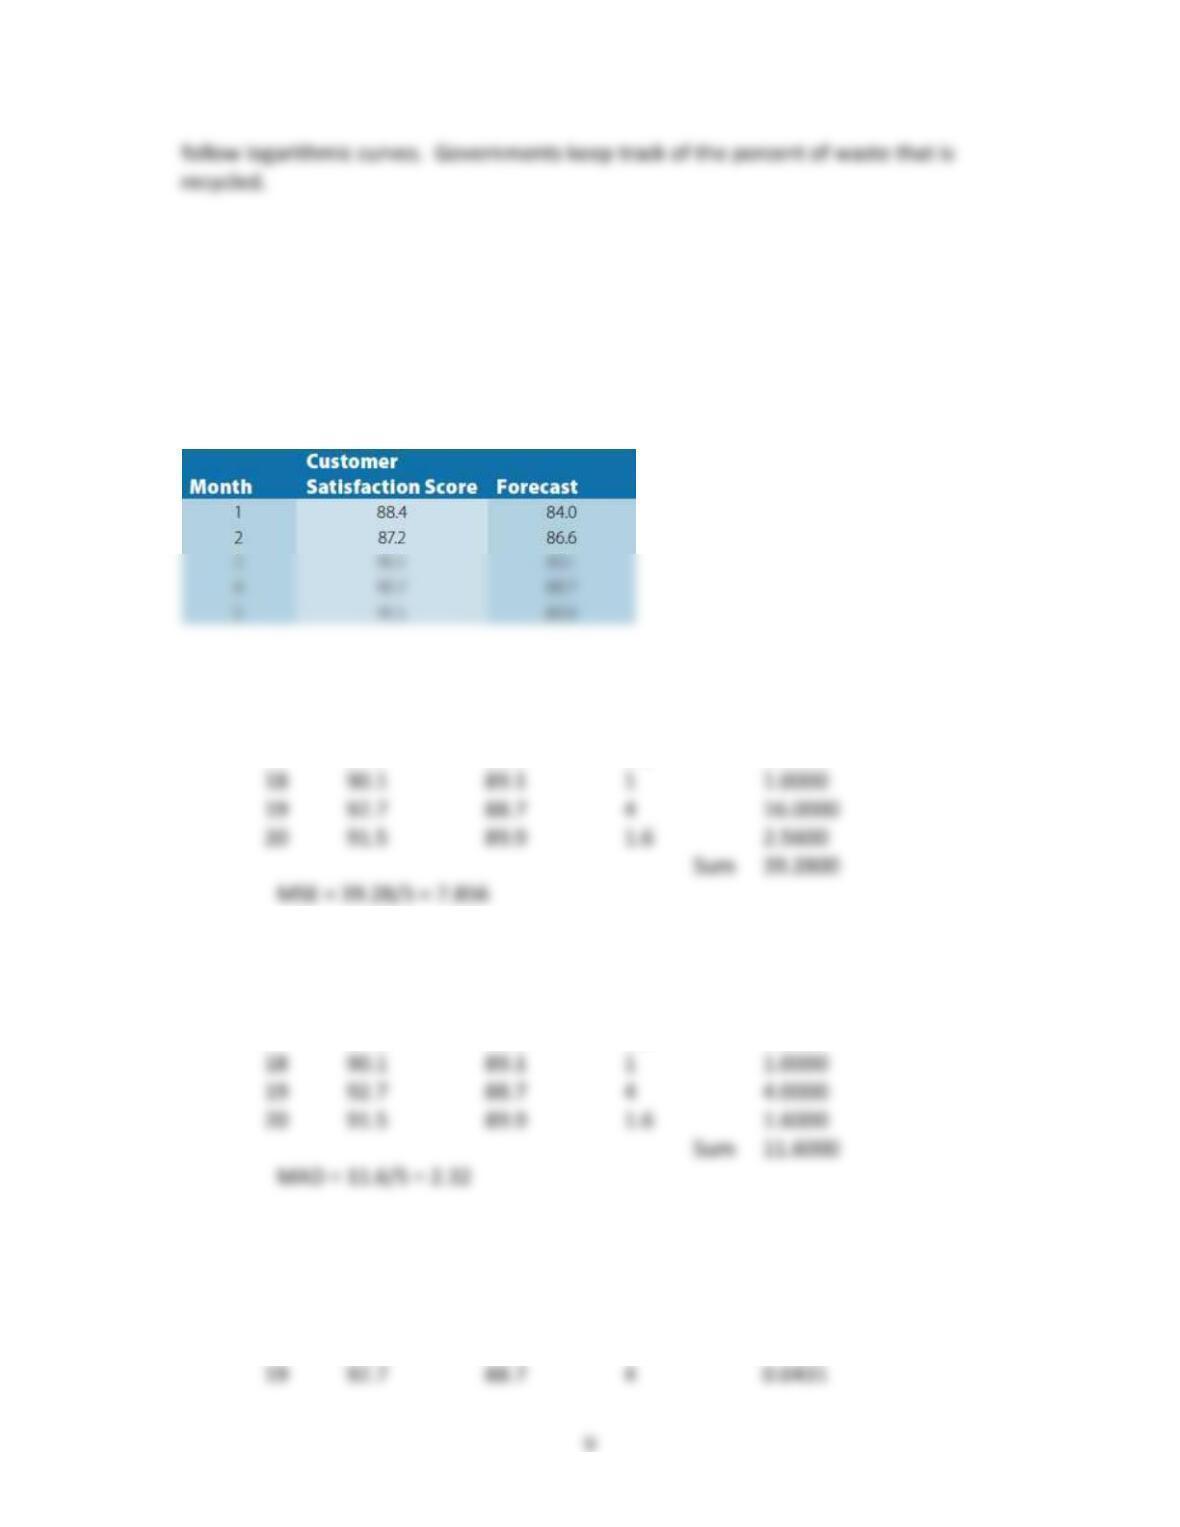
21. Compute MSE, MAD, and MAPE (Equations 9.1 to 9.3) for the following customer
satisfaction data.
MSE
Month, t Demand, A Forecast, F Error, A – F Squared Error
16 88.4 84 4.4 19.3600
17 87.2 86.6 0.6 0.3600
MAD
Month, t Demand, A Forecast, F Error, A – F Absolute Error
16 88.4 84 4.4 4.4000
17 87.2 86.6 0.6 0.6000
MAPE
Month, t Demand, A Forecast, F Error, A – F Absolute Error/A
16 88.4 84 4.4 0.0498
17 87.2 86.6 0.6 0.0069
18 90.1 89.1 1 0.0111
10
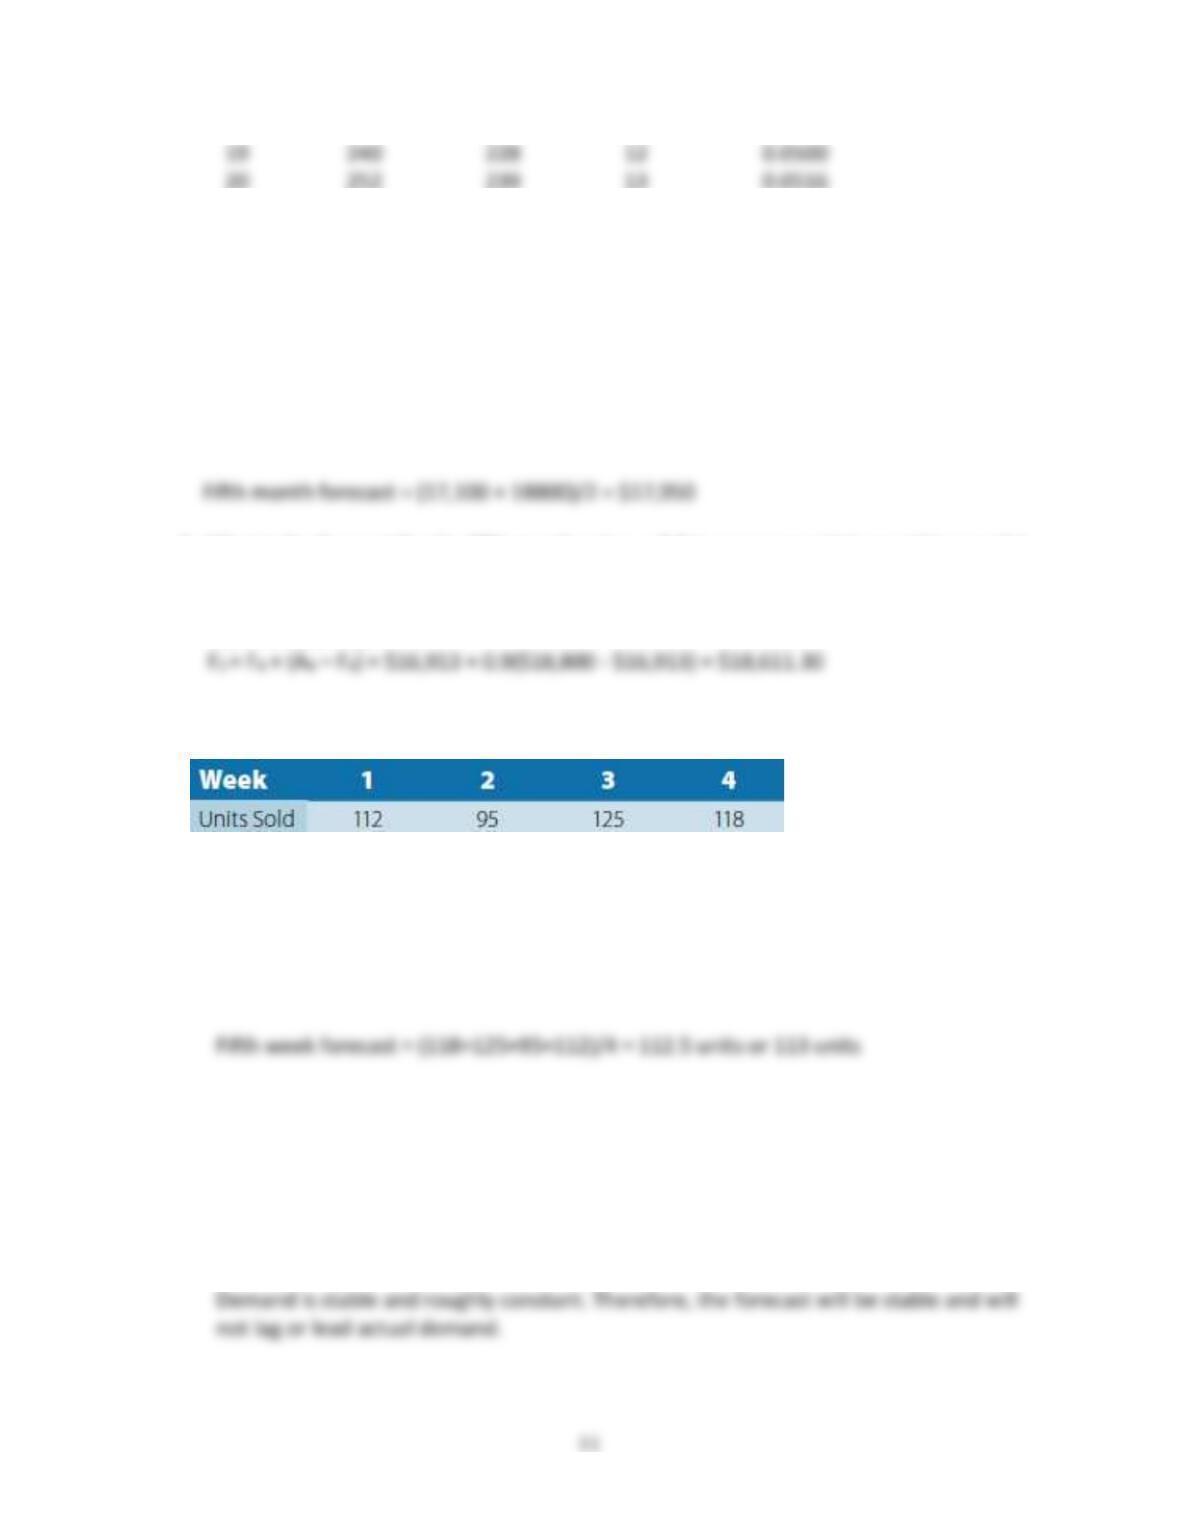
22. ProScript sells writing software that edits and proofs manuscripts. The last six months of
data are shown below.
Compute MSE, MAD, and MAPE (Equations 9.1 to 9.3) for these data.
It is best to do this on a spreadsheet for numerical accuracy.
MSE
Month, t Demand, A Forecast, F Error, A – F Error Squared
16 230 200 30 900
17 197 185 12 144
MAD
Month, t Demand, A Forecast, F Error, A – F Absolute Error
16 230 200 30 30
17 197 185 12 8
MAPE
Month, t Demand, A Forecast, F Error, A – F Absolute Error/A
16 230 200 30 0.1304
17 197 185 12 0.0609
18 222 210 12 0.0541
Sum = 0.3470
MAPE = 0.3470 x 100/5 = 6.94%
23. Cynthia’s Design Studios had sales the last four months of $13,700, $15,400, $17,100, and
$18,800. Sales are related to how many designers Cynthia has on-duty. The sales forecast
helps her decide on the proper staffing levels.
a. What is the forecast for the fifth month using a two-period moving average?
b. What is the forecast for the fifth month using = 0.9 in an exponential smoothing model
with A4 = $18,800 and F4 = $16,913 to get things started.
Ft+1 = Ft + (At – Ft) =
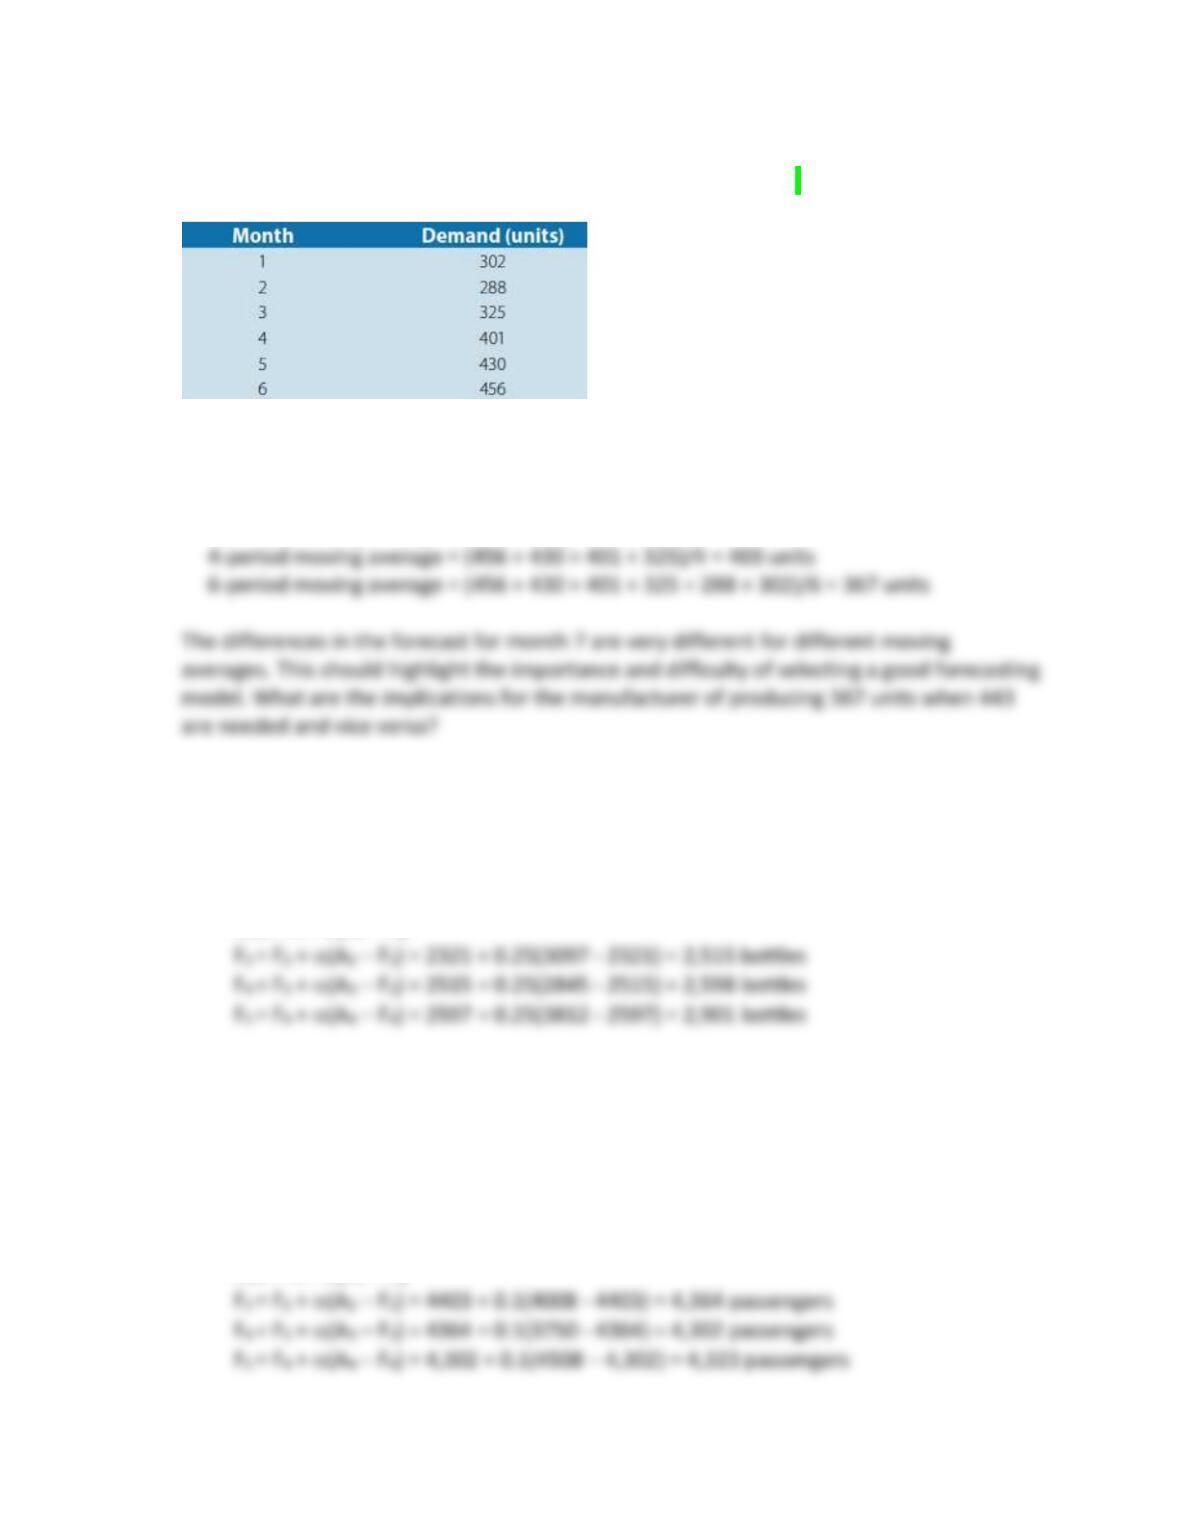
24. Ink cartridges for the Burke Model 901 printer the last four weeks are as follows:
a. What is the three-week moving average for the fifth week?
Fifth week forecast = (118+125+95)/3 = 112.67 or 113 units
b. What is the four-week moving average for the fifth week?
c. Actual sales for week five were 126. With this information, what is the four-week
moving average forecast for week six?
4-period (95+125+118+126)/3 = 116 units
d. What can you conclude about this demand pattern?
12
25. A manufacturer uses a moving average to predict how many replacement parts for Part
#8119 they should produce per month. Past demand is as follows.
What are the forecasts for month seven using two-, four-, and six-period moving averages?
What can we learn from the answers?
2-period moving average = (456 + 430)/2 = 443 units
26. Exotic Wines, Inc. wants to use exponential smoothing with = 0.25 to forecast demand in
bottles sold. The demand the last four months are 2,321, 3,097, 2,845, and 3,812 bottles.
The forecast for bottles was 2,321 bottles for the second month. What is the forecast for
the fifth month?
27. A small airplane company called Just In Time flies between cities in Florida. It is trying to
decide whether to add one extra plane to its fleet next year. Passenger demand that last
four quarters are as follows: Q1 = 4,403, Q2 = 4,008, Q3 = 3,750, and Q4 = 4,508
passengers. The forecast for passengers in the second month was 4,403 passengers.
a. What is the forecast for the fifth month using exponential smoothing with = 0.1?
13
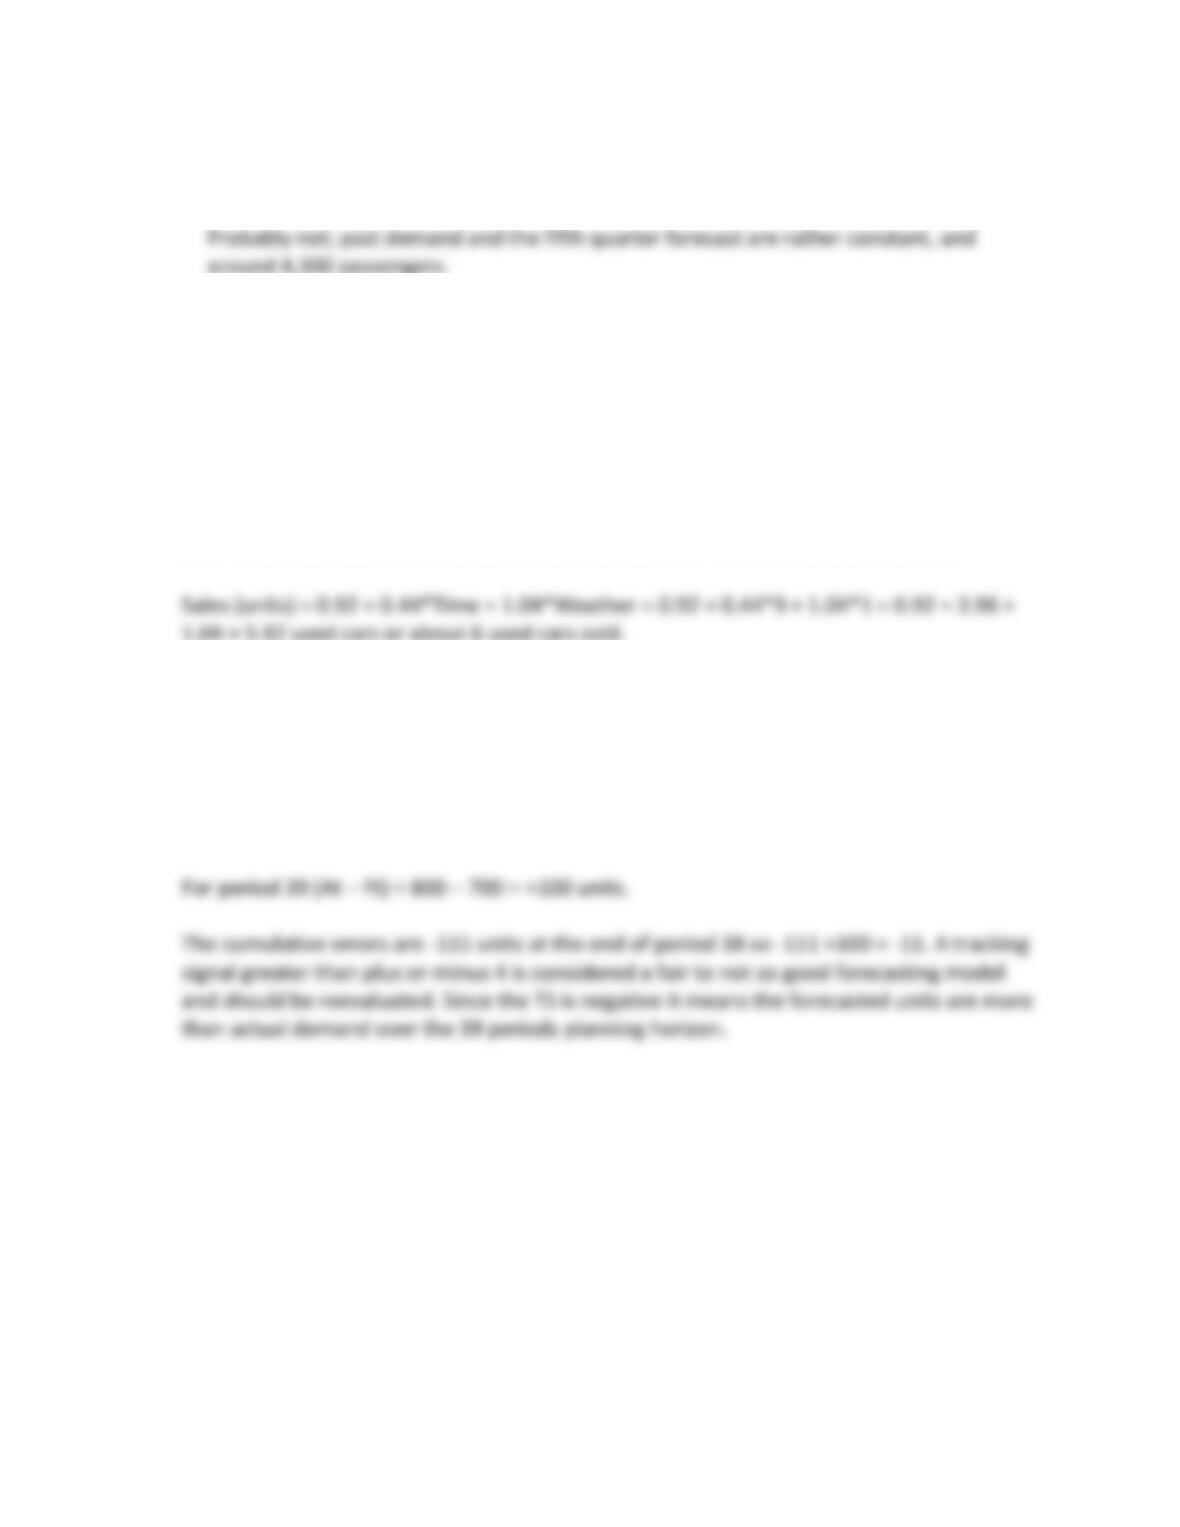
b. Given only what you learned in part (a), should the airline add another plane?
28. A linear regression model is Units = 3,014 – 0.639*Week. For week 38, what is the forecast
for the number of units?
Units = 3,014 – 0.639*38 = 3,014 – 24.282 = 2,989.72 units
29. Ham’s Used Cars sells cars with an upward trend based on time and the degree of bad
weather. Weather is scored with 1 being bad weather and 5 being great weather. Using the
following multiple regression model, Sales (units of used cars) = 0.92 + 0.44*Week +
1.04*Weather, what is the forecast of used car sales for week 9 with bad weather?
1.04 = 5.92 used cars or about 6 used cars sold.
30. What is the tracking signal for the end of period 39 when actual demand is 800 units and
the forecast is 700 units in period 39. The algebraic sum of the forecast errors at the end of
period 38 was -111 units. Assume that MAD is computed at the end of period 39 to be
2.11. What does this tracking signal mean?
Tracking Signal at end of period 39 = Sum (At – Ft)/MAD = -11/2.11 = -5.213
EXCEL-BASED PROBLEMS
For these problems, you may use Excel or the spreadsheet templates in MindTap to assist in
your analysis.
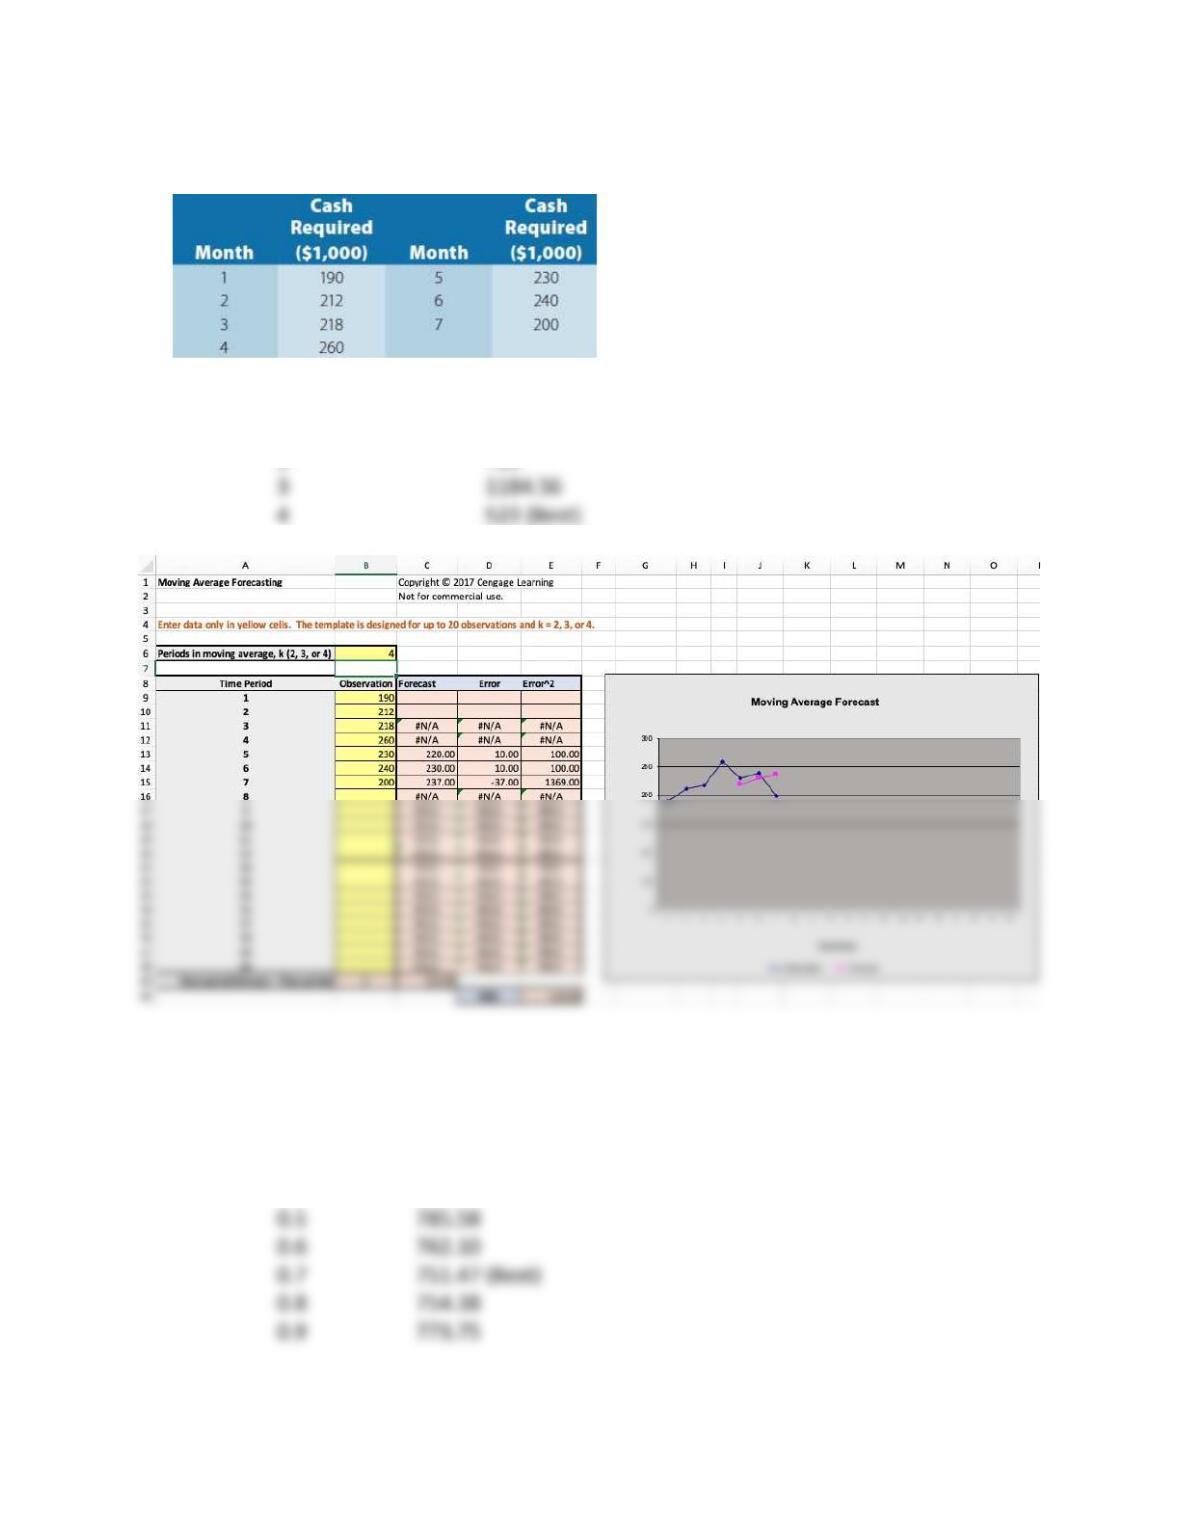
31. Canton Supplies, Inc., is a service firm that employs approximately 100 people. Because of the
necessity of meeting monthly cash obligations, the Chief Financial Officer wants to develop a
forecast of monthly cash requirements. Because of a recent change in equipment and operating
policy, only the past seven months of data are considered relevant. The change in operations has
had a great impact on cash flow. What forecasting model do you recommend? Use the Moving
Average and Exponential Smoothing Excel templates or other Excel tools to help you answer this
14
question.
Using the Moving Average template, we find:
Number of periods (k) MSE
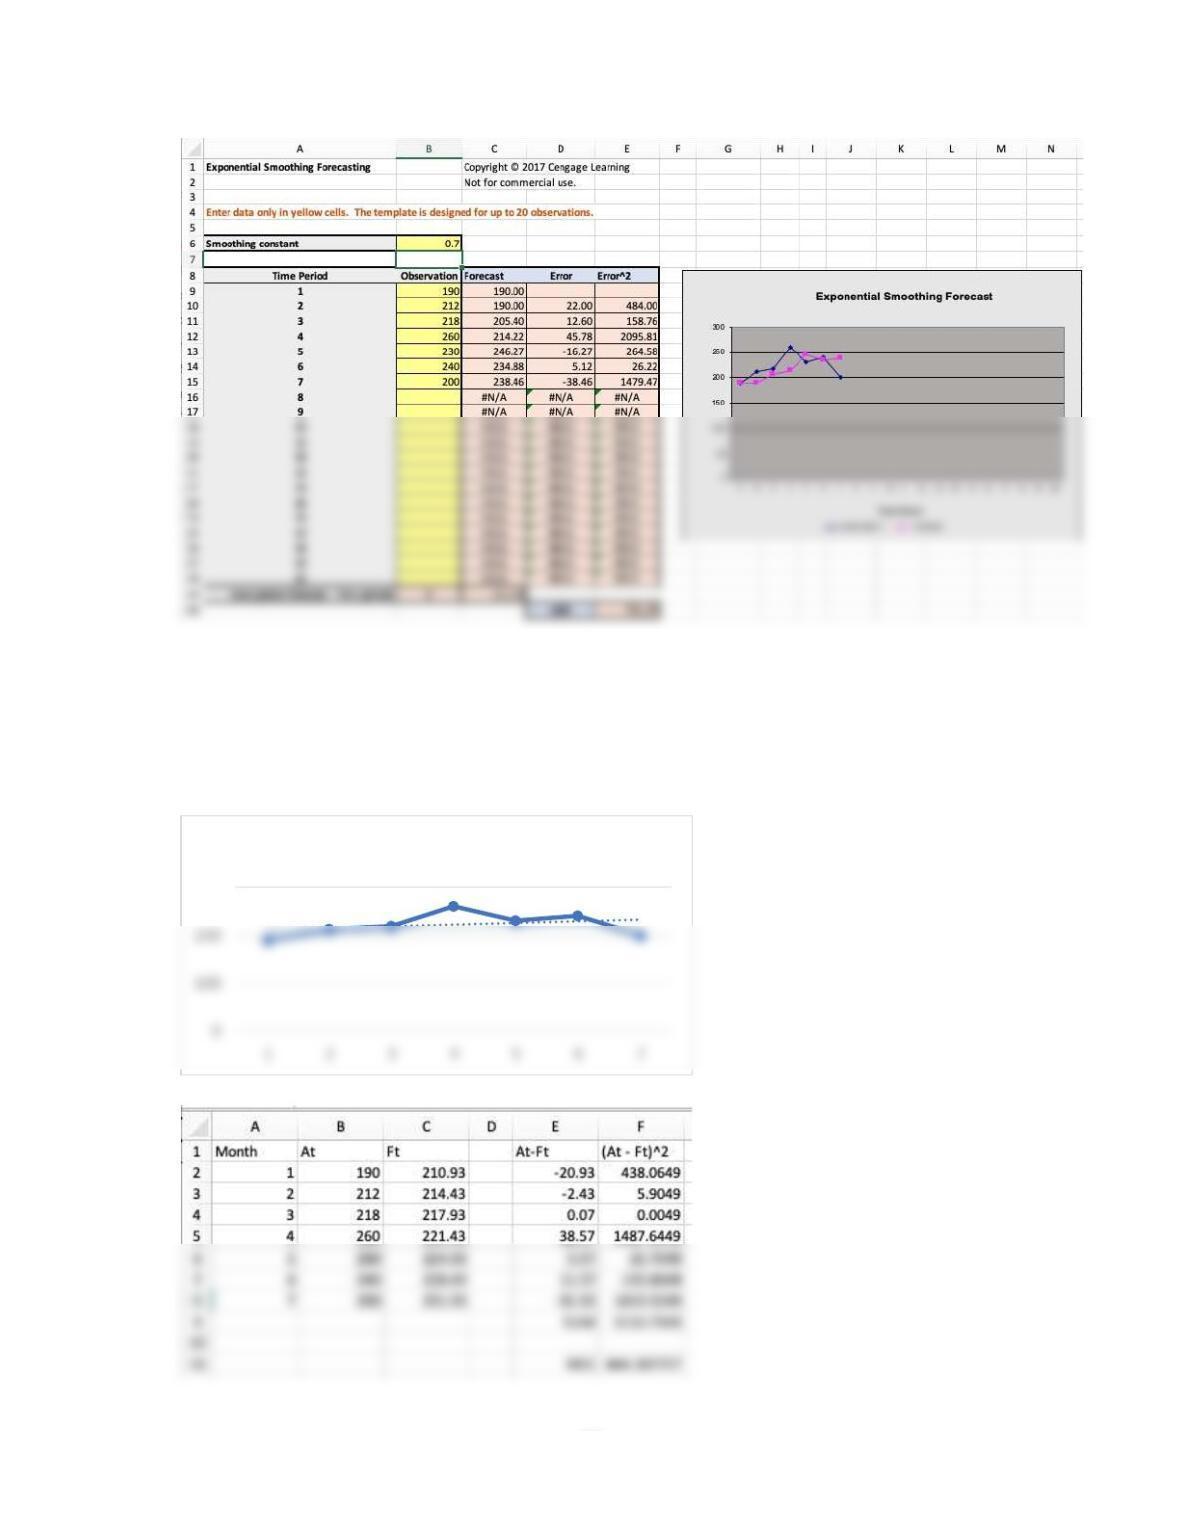
Using the Exponential Smoothing template, we find:
Alpha MSE
0.1 1261.78
0.2 1020.25
0.3 894.24
0.4 825.55
15
The moving average model with k = 4 is the best among all the models evaluated.
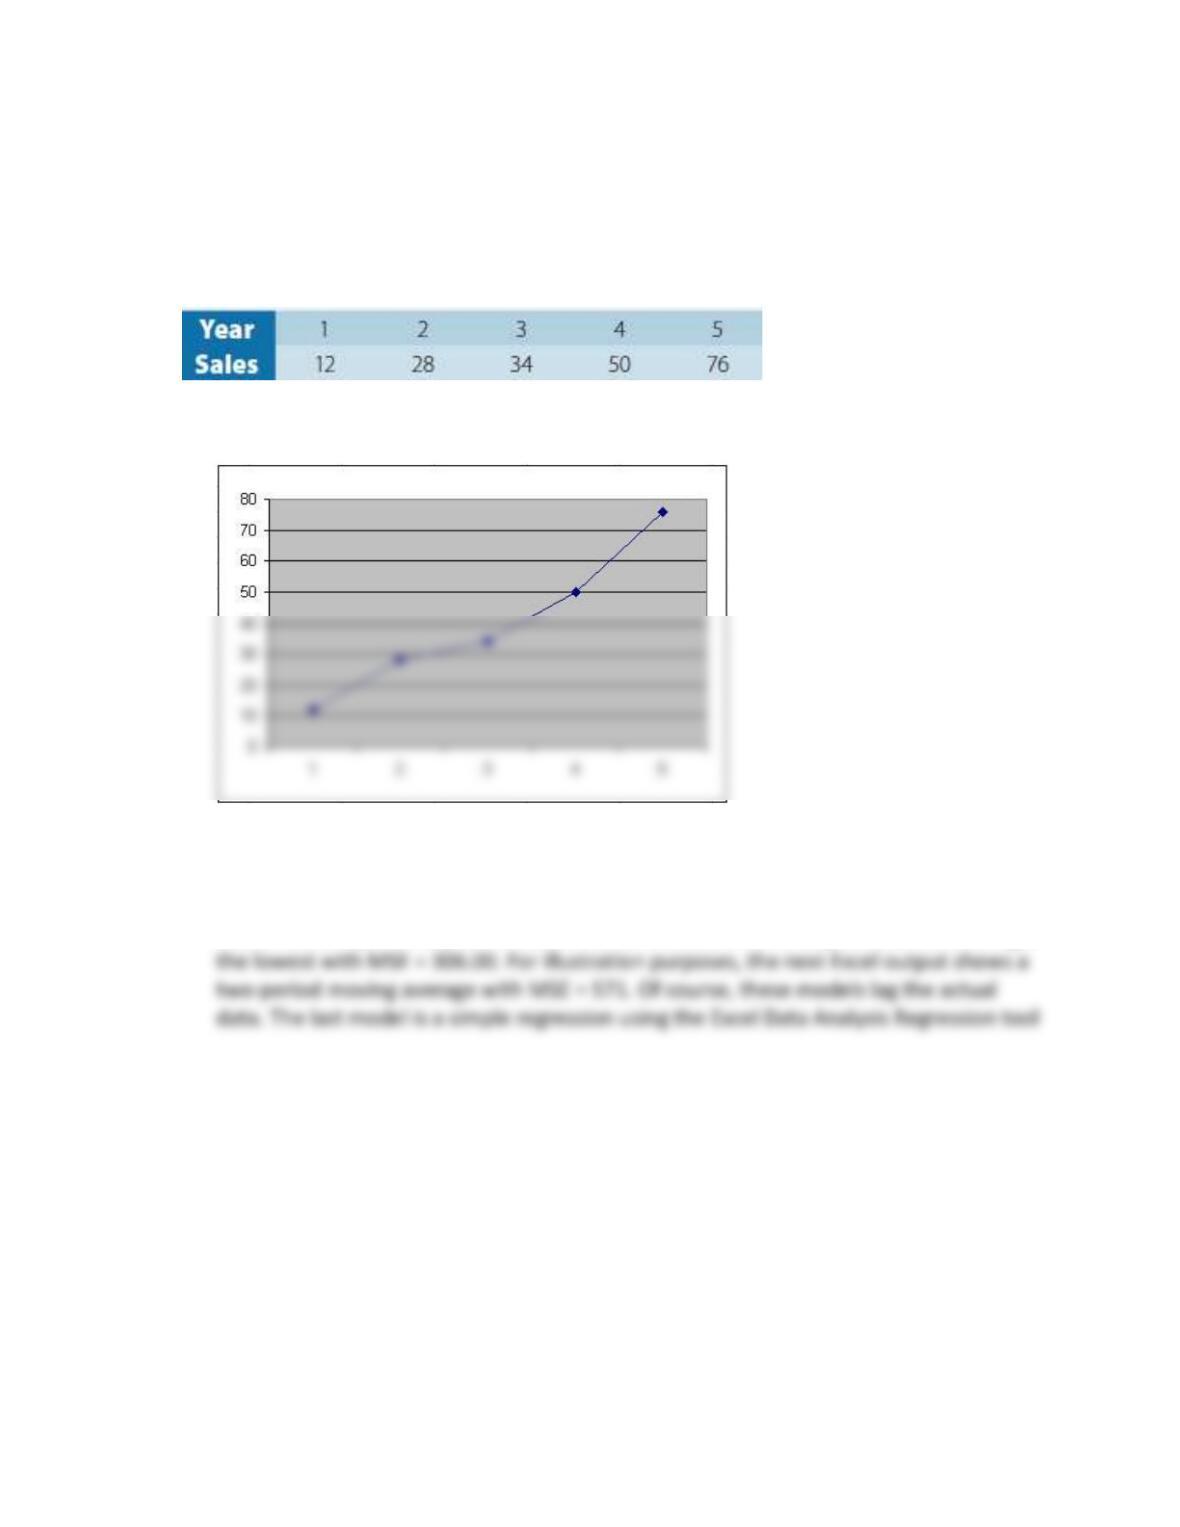
Finally, students might try a regression model. Using a trendline or the Regression tool, we see that
although R2 is only 0.0993, MSE is 444.388, which would provide the best model. The trend line and
MSE calculations are shown below. Note that Ft = 3.5*t + 207.43 in the spreadsheet.
y = 3.5x + 207.43
R² = 0.0993
300
Time Series
16
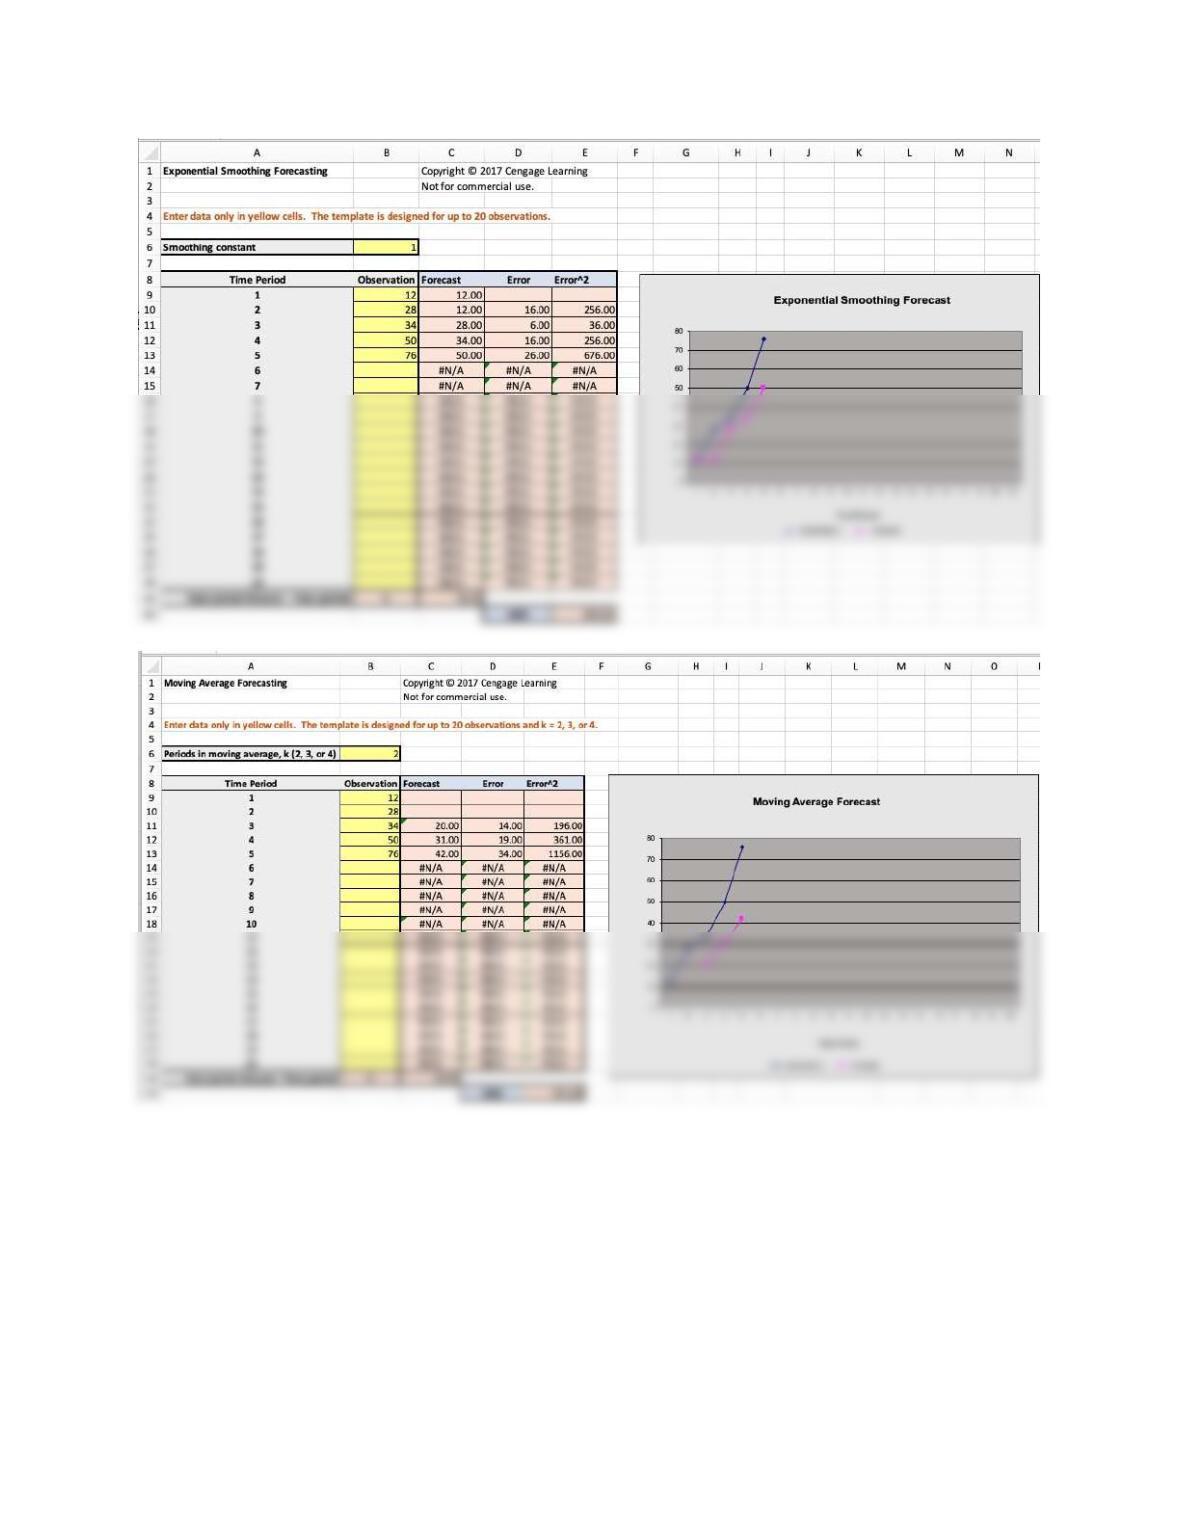
32. The Costello Music Company has been in business five years. During that time, its sales of
electric organs has grown from 12 units to 76 units per year. Fred Costello, the firm’s
owner, wants to forecast next year’s organ sales. The historical data follow.
a. Construct a chart for this time series on a spreadsheet.
b. What forecasting method do you recommend and why? Use appropriate Excel
templates and tools to justify your recommendation.
Students will try a variety of models. With
= 1.0 the MSE for exponential smoothing is
17
18
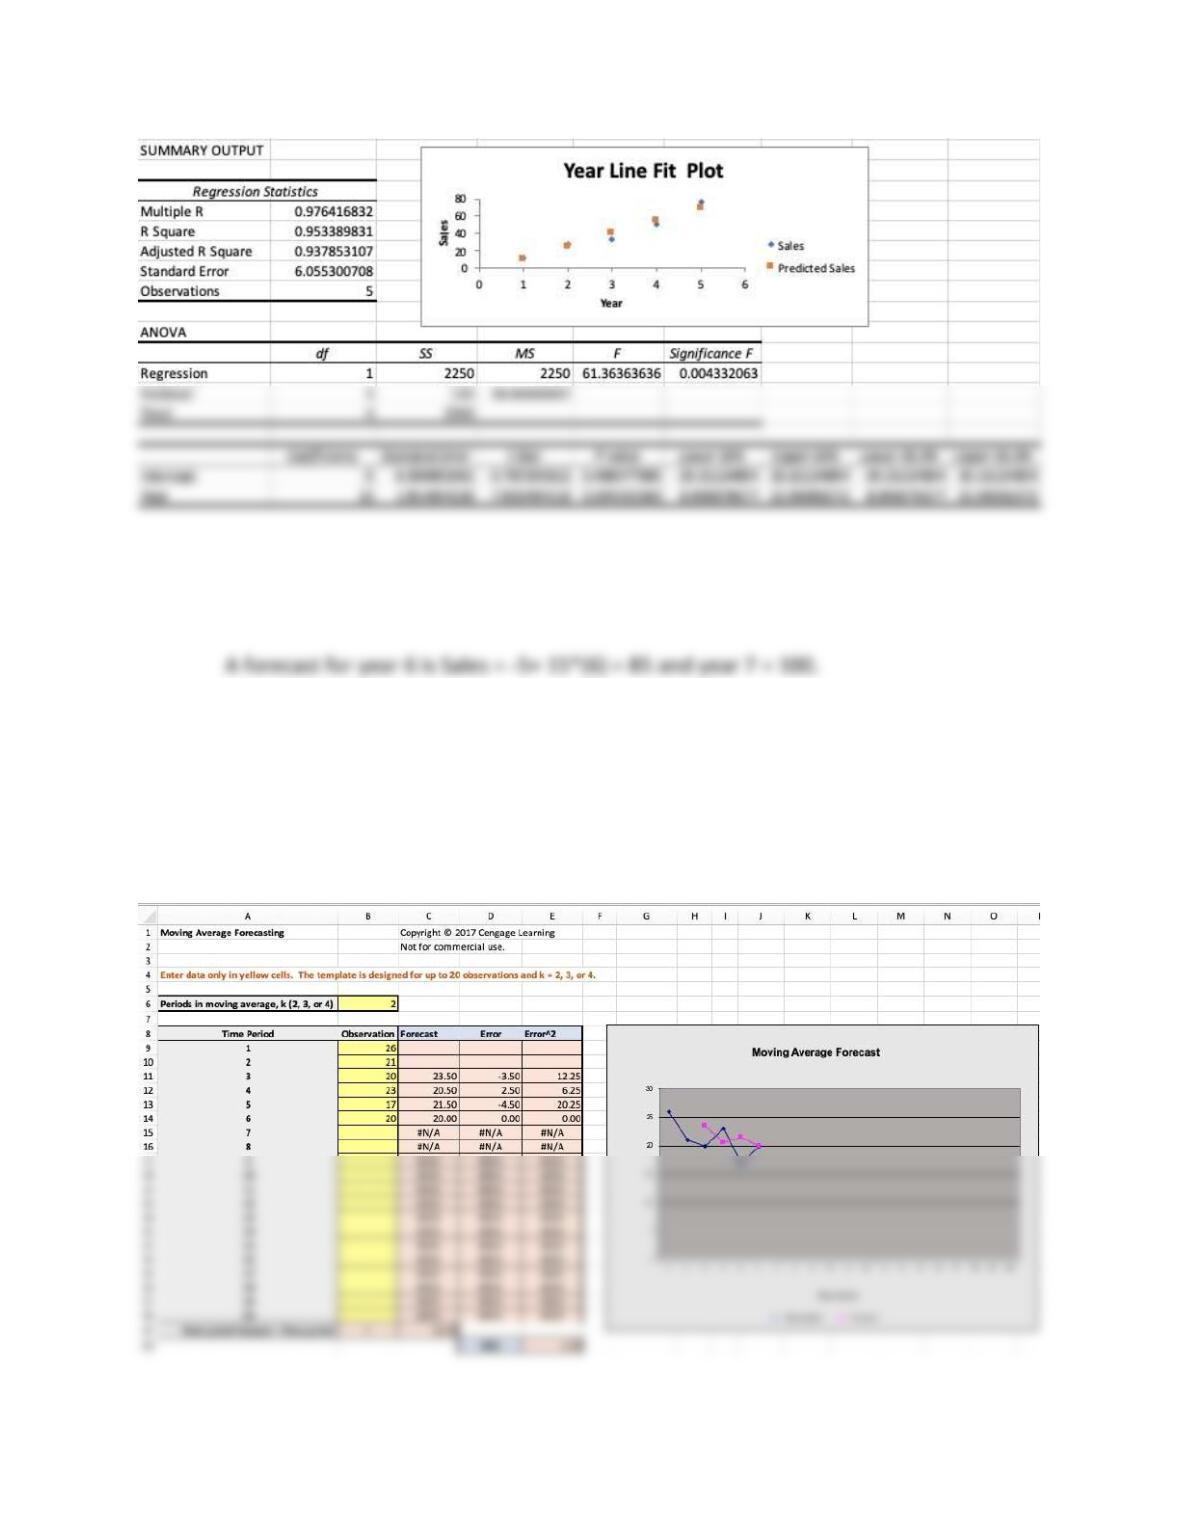
Using regression, we find Sales = -5 + 15*Time. The linear regression is the best model.
c. Use your recommendation to obtain a forecast for Years 6 and 7.
33. The historical sales for a certain model of a single serve coffee maker in units is: January,
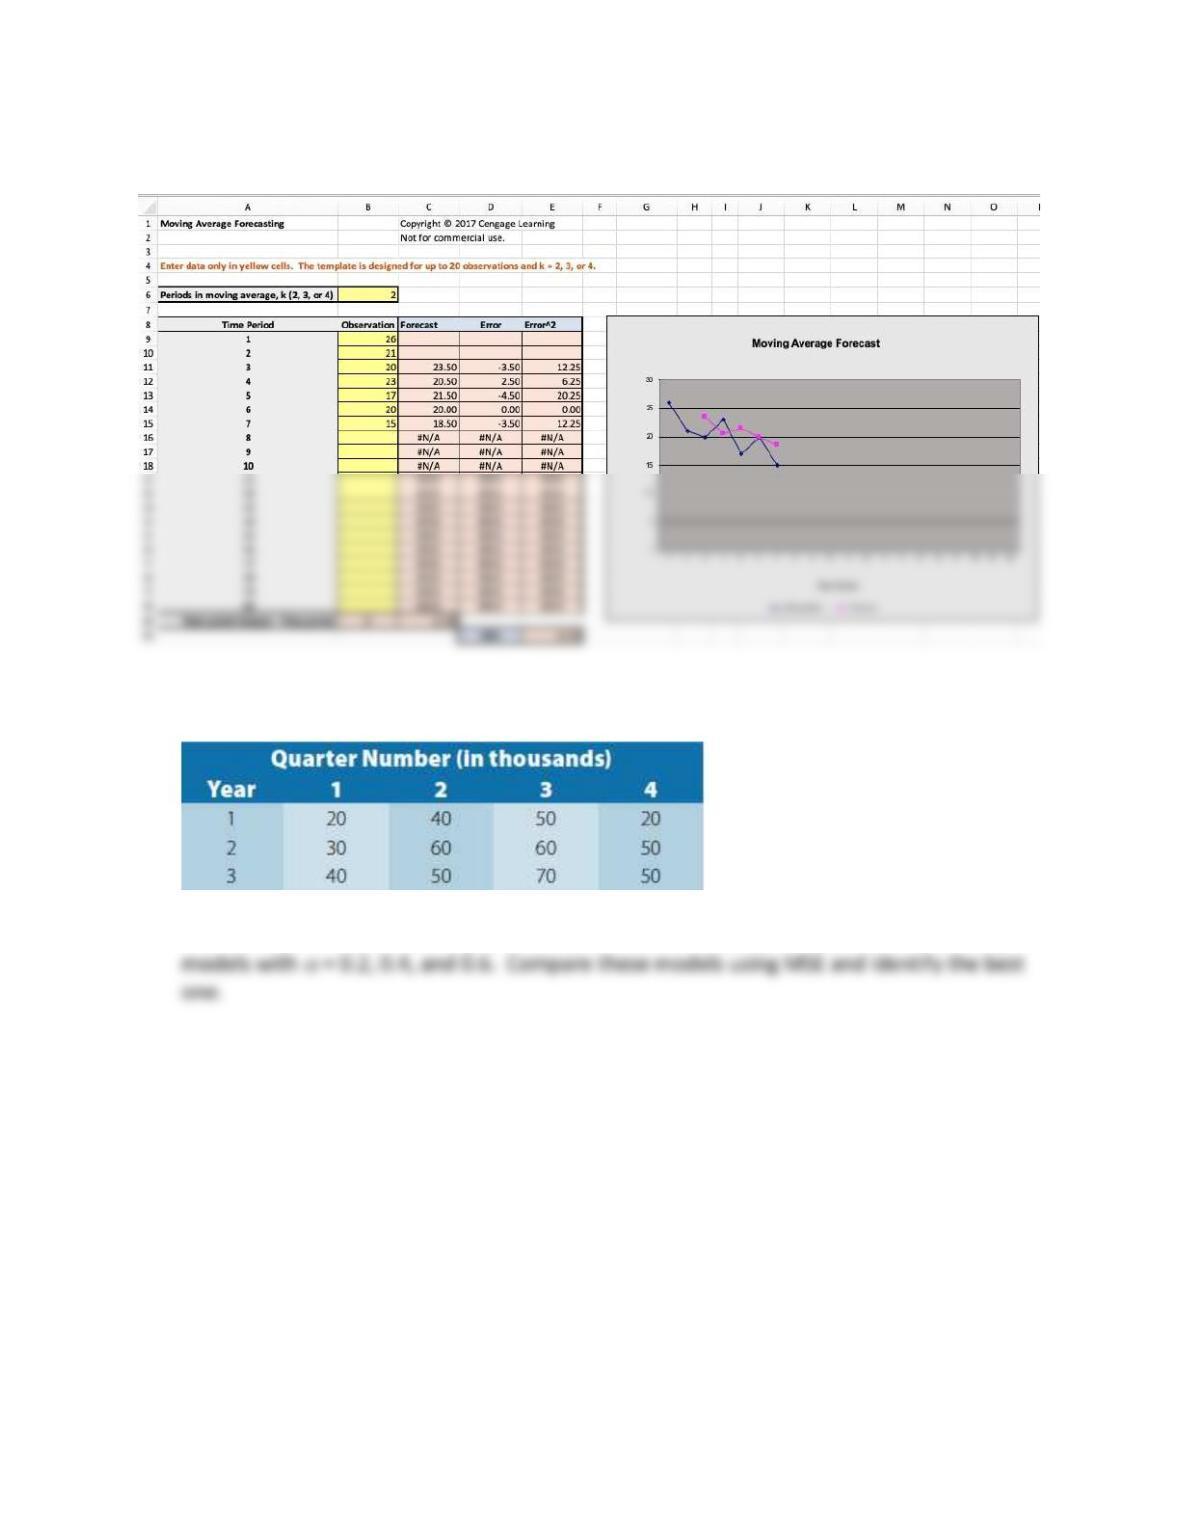
26; February, 21; March, 20; April, 23; May, 17; and June, 20. Using a two-month moving
average, determine the forecast for July using the Moving Average Excel template. If July
experienced a demand of 15, what is the forecast for August?
July forecast:
19
August forecast:
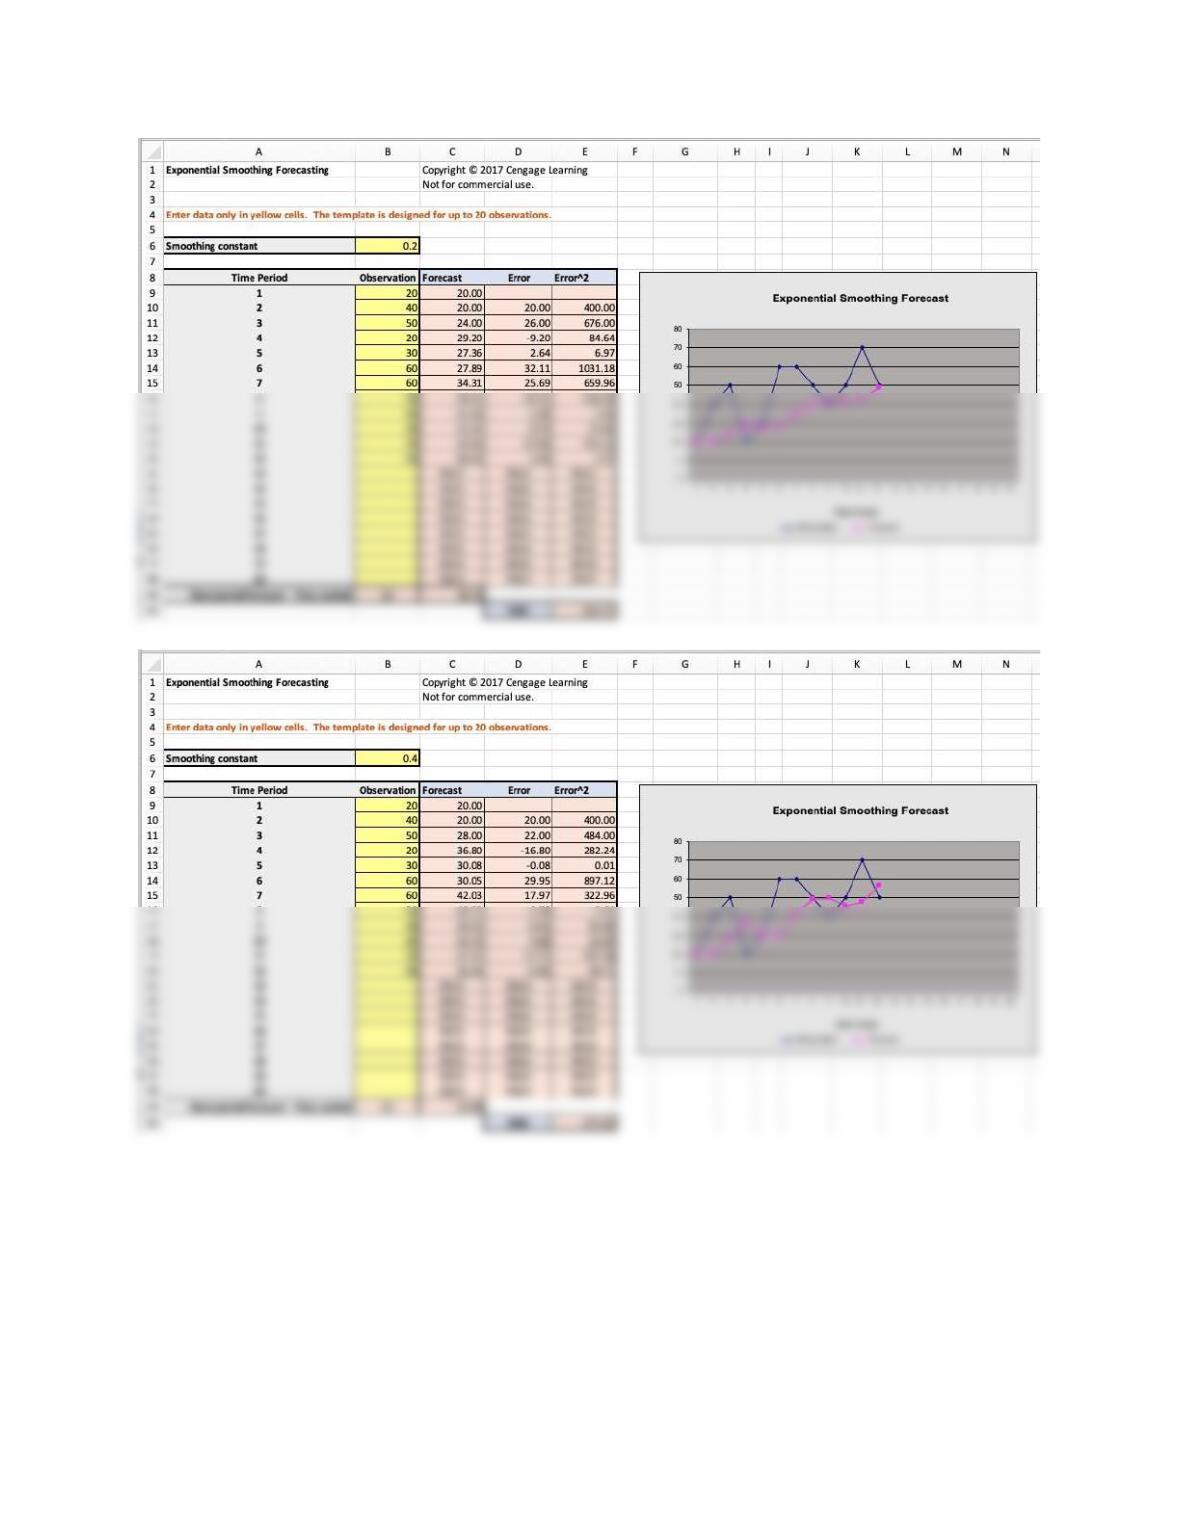
34. The manufacturer of gas outdoor grills provides sales data for the last three years as
follows:
Use the Exponential Smoothing Excel template to develop single exponential smoothing
20