Problem 9-4 Instructor Reserve
Circuitus Corp. Average Assembly Times
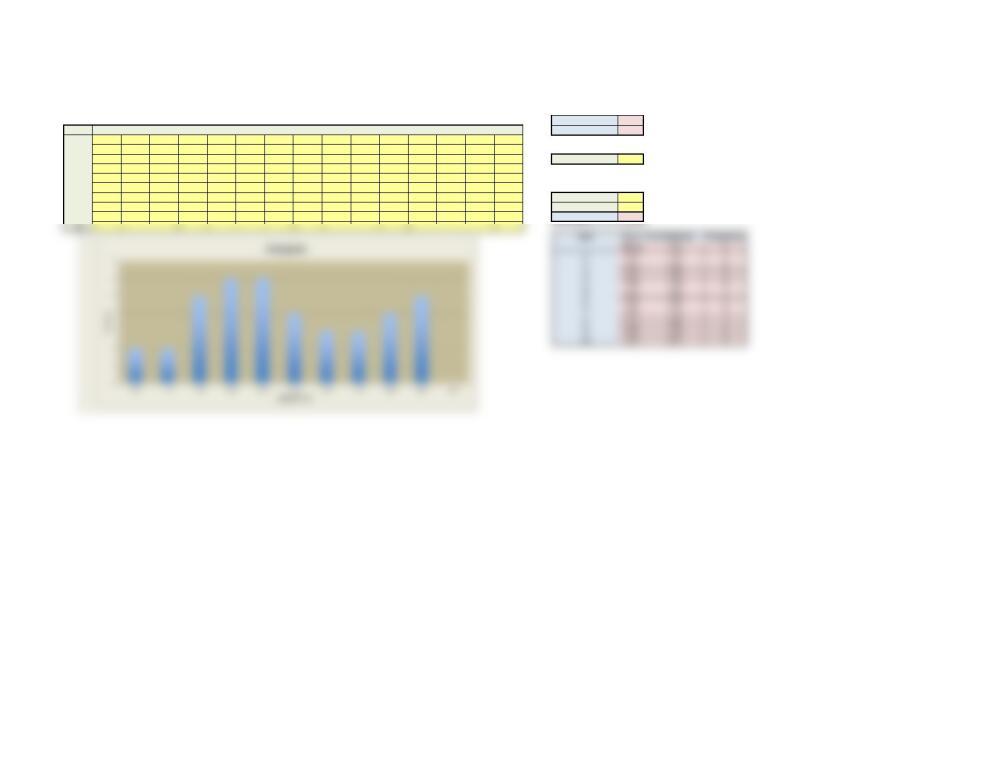
Frequency Distribution and Histogram
This template is designed to handle up to 150 observations. Enter data only in yellow cells. Data Minimum 1.000
DATA 1 2 3 4 5 6 7 8 9 10 11 12 13 14 15 Data Maximum 1.900
11.000 1.300 1.200 1.000 1.400
21.200 1.100 1.600 1.200 1.600 Enter number of cells (10 or less)
31.300 1.500 1.300 1.100 1.300 Number of Cells 10
41.500 1.800 1.200 1.500 1.400
51.300 1.300 1.700 1.700 1.800 Enter smallest and largest limits for the frequency distribution in the yellow cells below.
61.800 1.400 1.600 1.400 1.400
71.900 1.500 1.400 1.900 1.900 Lower limit 1.000
The lower limit should be slightly less than the data minimum.
81.900 1.900 1.700 1.800 1.200 Upper limit 2.000 The upper limit should be slightly larger than the data maximum.
9 Cell width 0.100
Problem 9-4 Instructor Reserve
Circuitus Corp. Average Assembly Times
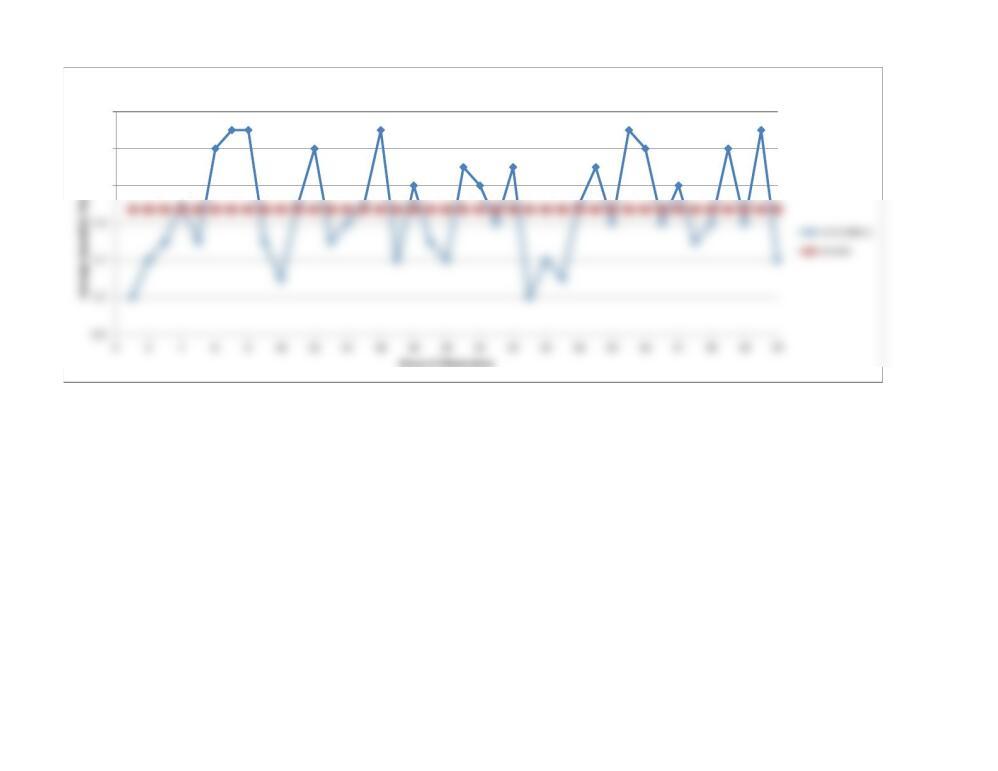
Scatter Diagram
This spreadsheet is designed for up to 40 single values. Enter data ONLY in yellow-shaded cells.
Enter the number of values in cell E6. Then enter your data below. To recalculate the sheet, press F9 key.
If X-axis values differ from those shown, then substitute and clear unneeded ones.
Number of VALUES (<= 40) 40
Observation No.
12345678910 11 12 13 14 15 16 17 18 19 20 21 22 23 24 25 26 27 28 29 30 31 32 33 34 35 36 37 38 39 40
1.6
1.8
2.0
Problem 9-4 IR