Process Improvement and Six Sigma 21
3.5
22750.1
5.1
159.1
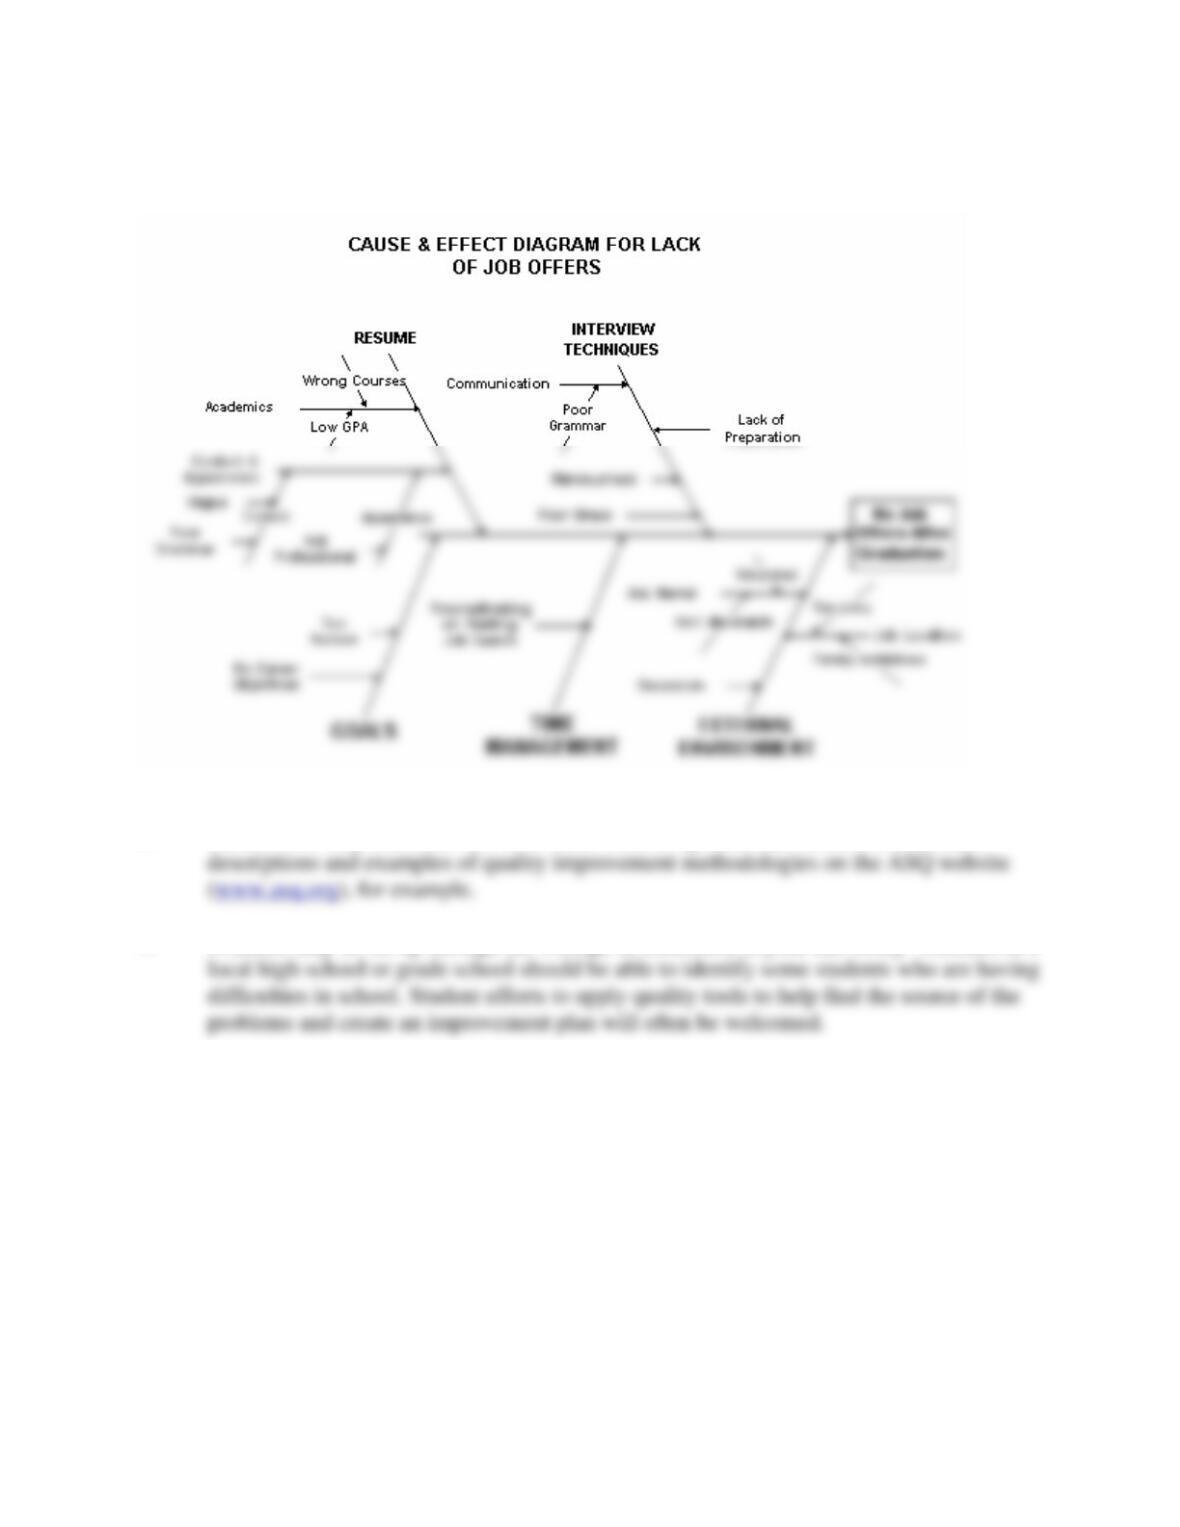
3.6
17864.4
5.2
107.8
3.7
13903.4
5.3
72.3
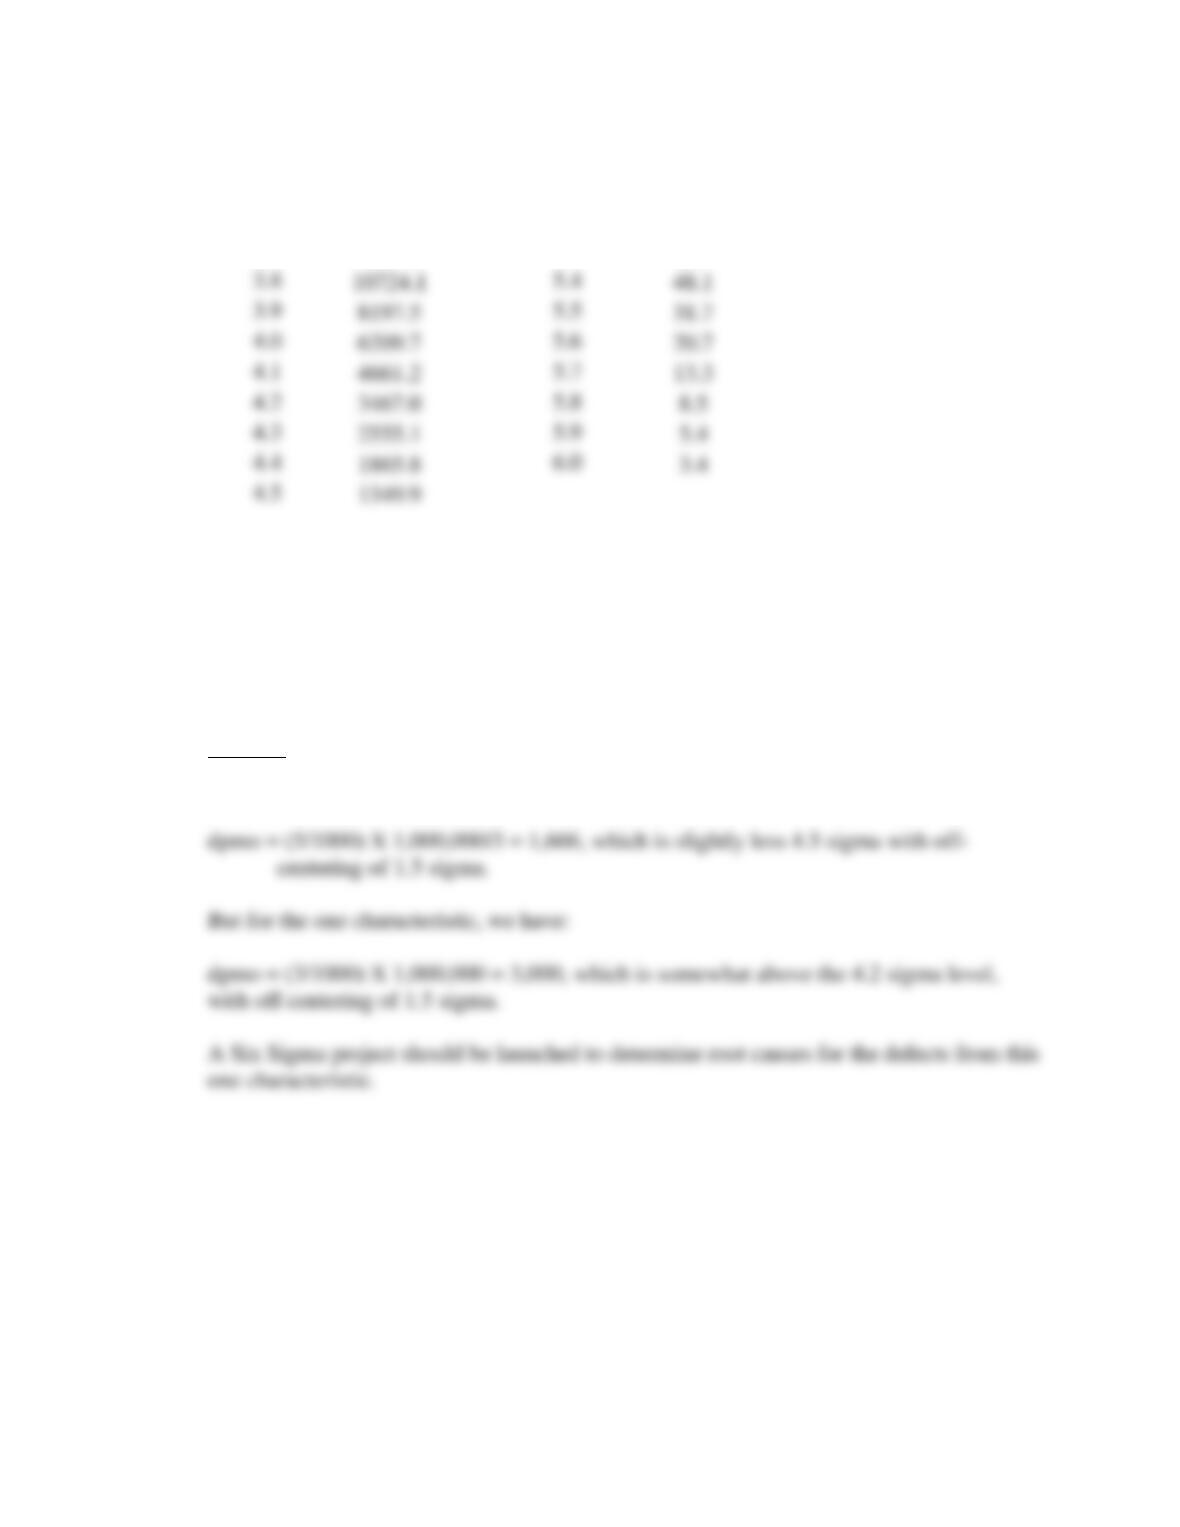
5. Nanospark Electronics manufactures 100,000 circuit boards per month. A random
sample of 1,000 boards is inspected every week for three characteristics. During a recent
week, three defects were found for one characteristic, and one defect each was found for
the other two characteristics. If these inspections produced defect counts that were
representative of the population, what is the overall sigma level for this process? What is
the sigma level for the characteristic that showed three defects?
Answer:
To calculate the overall dpmo and sigma level, we have:
6. Verasource Microprocessor Corporation (VMC) sells 2000 specialized computer
processing chips each month at a price of $1,500 each. Variable costs amount to
$1,500,000, and fixed costs are $500,000. Currently the company has a defect rate of 8
percent (which are chips returned by customers, scrapped by VMC, and replaced). Note
that the variable costs include the cost of producing the defective chips.
a. What is the hidden cost to the company of making this rate of defectives instead of
2000 good chips each month?
b. Suppose a Six Sigma effort can reduce the defects to a six sigma level (assume for
simplicity that the defective rate is essentially zero). What is the impact on
profitability?
3.8
10724.1
5.4
48.1
3.9
5.5
31.7
4.0
5.6
20.7
4.1
5.7
13.3
4.2
5.8
4.3
5.9
4.4
6.0
4.5

Process Improvement and Six Sigma 22
Answer:
a) In order to produce and sell 2,000 good computer chips, VMC must start 2,000/0.92 =
2,174 chips into production. However, since the variable cost of $1,500,000 includes the
b) If a quality improvement initiative achieves a six sigma defect level, the defective rate
Monthly Baseline Monthly Six Sigma Results
Sales 2000 X $1500.00 = 3000000 Sales 2000 X $1500.00 = 3000000
7. A flowchart for a fast-food drive-through window is shown in Figure 9.25 (see text).
Determine the important quality characteristics inherent in this process and suggest
possible improvements.
Answer:
The important quality characteristics for this drive-through window are: the machinery,
materials, methods, and people (manpower). The machinery must work well, e.g. most
Process Improvement and Six Sigma 23
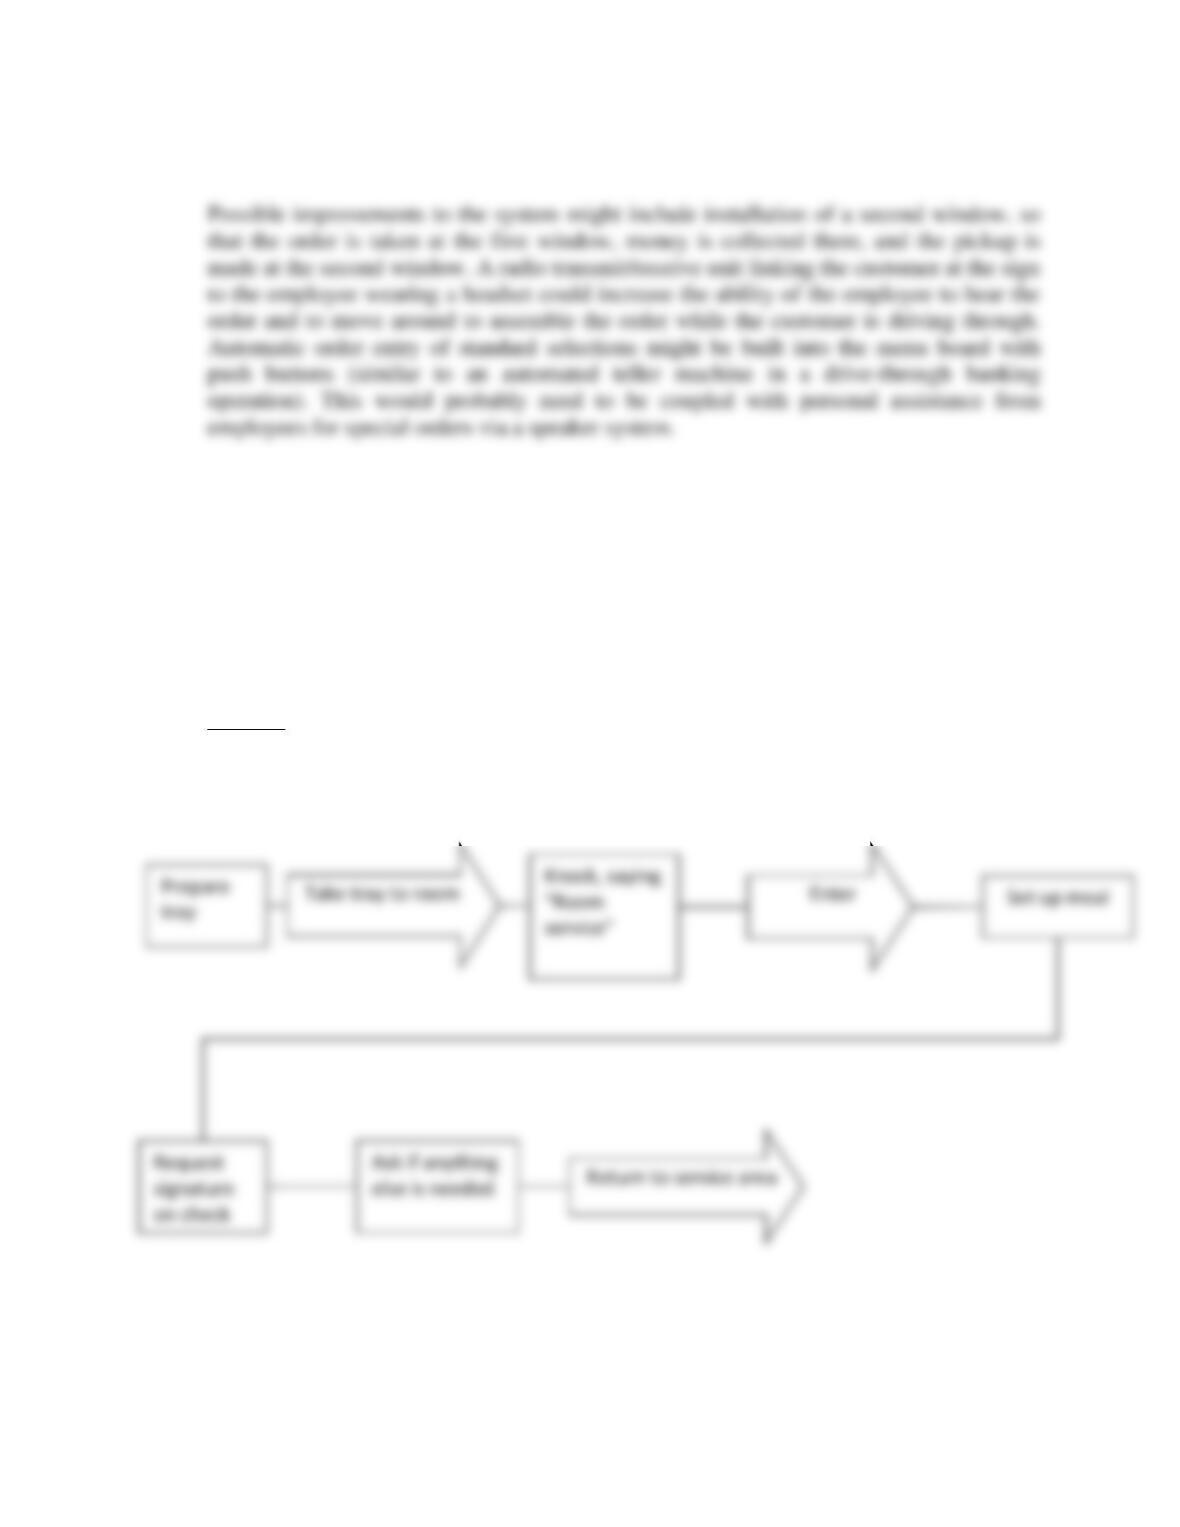
8. The current process for fulfilling a room service request at the Luxmark hotel can be
described as follows: After the tray is prepared at the room service station, the server
proceeds to the room, knocks on the door, sets up the meal, has the customer sign the
check, asks if anything else is needed, and then returns to the room service station.
a. Draw a flowchart that describes this process.
b. From the perspective of creating a high level of customer satisfaction from this
experience, what improvements might you suggest to enhance this process? Think
creatively!
Answer:
8 a. Flowchart

Process Improvement and Six Sigma 24
8.b. A number of things could be done to enhance the service experience and make it more
memorable for the guest.1 Broadly, these could be categorized as preparation,
performance, and leave-taking.
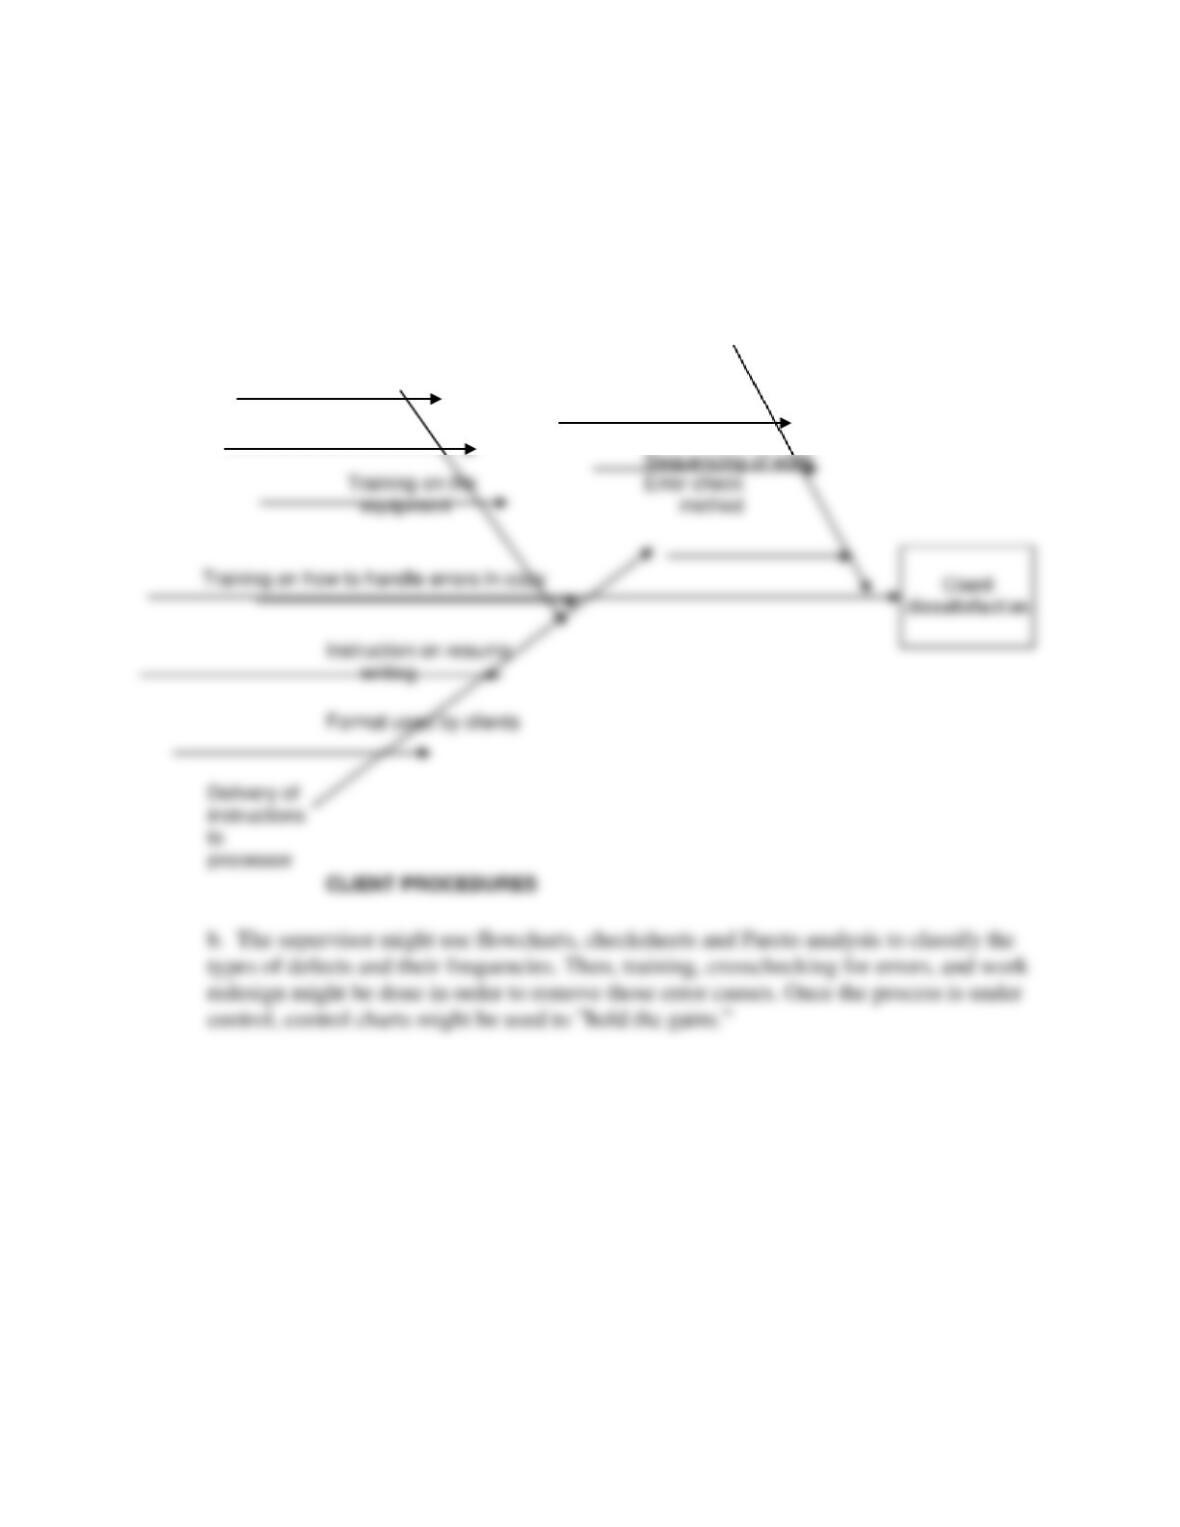
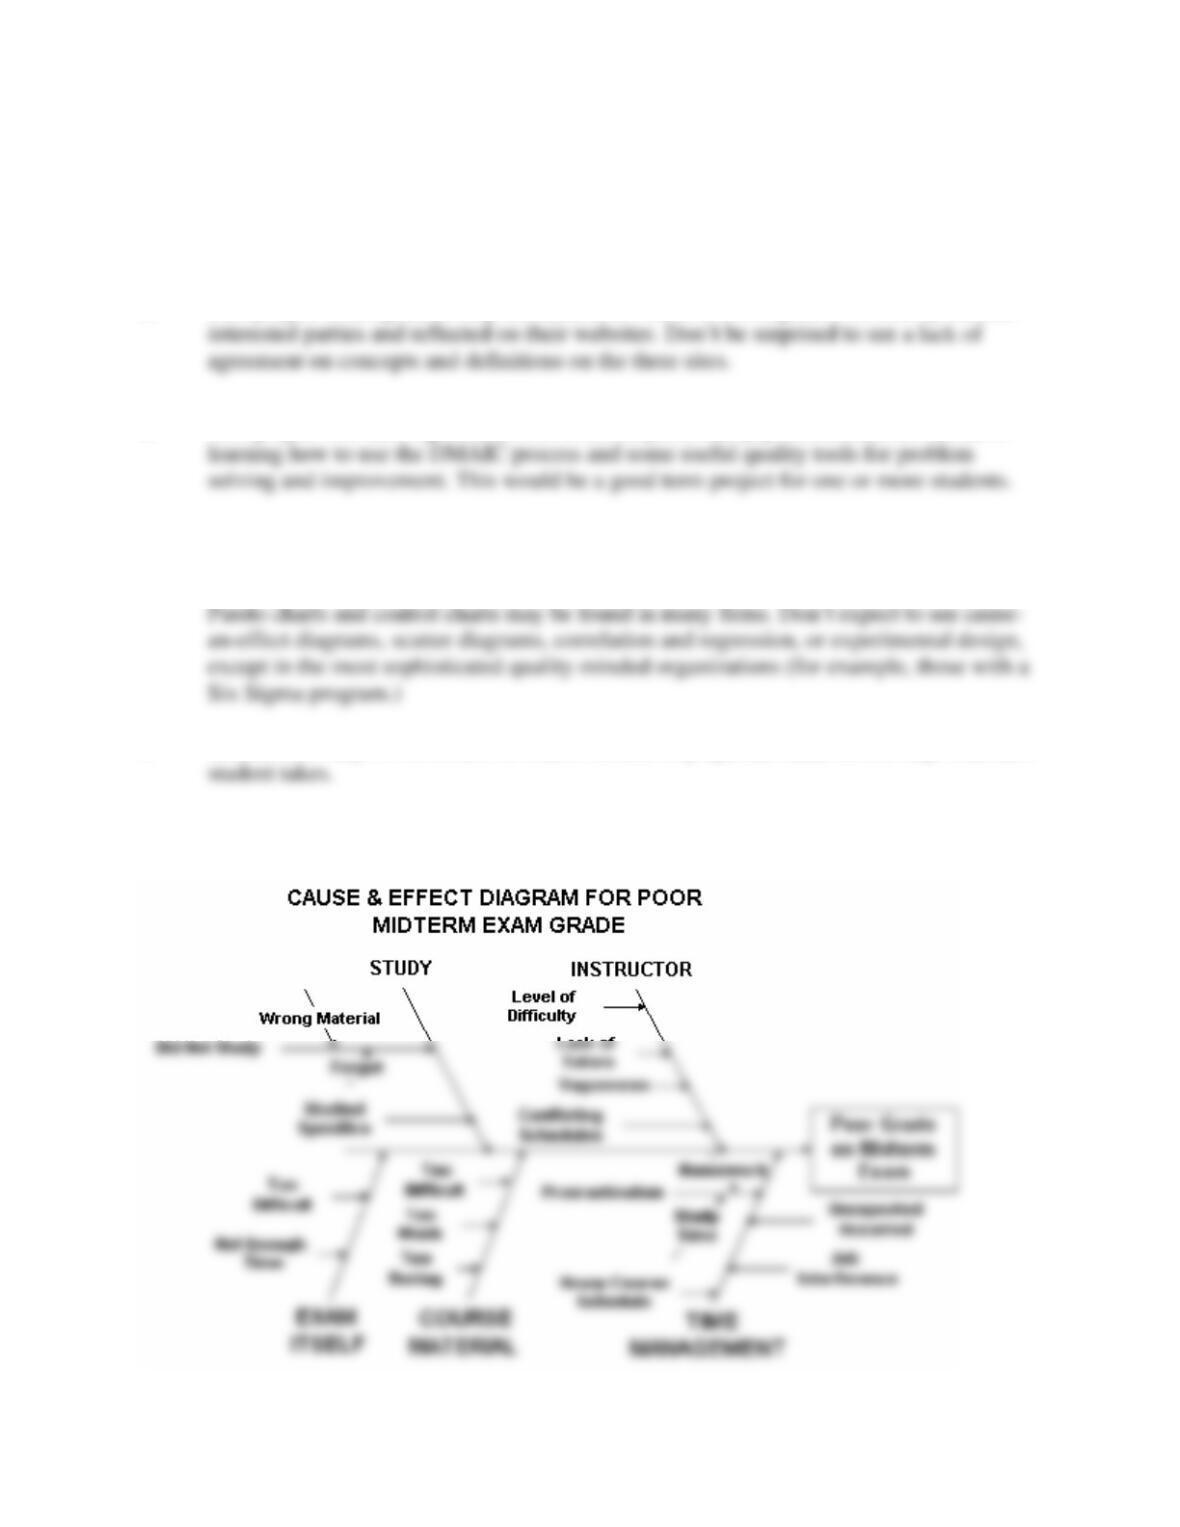
9. Placewrite, Inc., an independent outplacement service, helps unemployed executives find
jobs. One of the major activities of the service is preparing resumes. Three word
processors work at the service typing resumes and cover letters. Together they handle
about 120 individual clients. Turnaround time for typing is expected to be 24 hours. The
word-processing operation begins with clients placing work in the assigned word
processor’s bin. When the word processor picks up the work (in batches), it is logged in
using a time clock stamp, and the work is typed and printed. After the batch is completed,
the word processor returns the documents to the clients’ bins, logs in the time delivered,
and picks up new work. A supervisor tries to balance the workload for the three word
processors. Lately, many of the clients have been complaining about errors in their
documents—misspellings, missing lines, wrong formatting, and so on. The supervisor has
told the word processors to be more careful, but the errors still persist.
a. Develop a cause-and-effect diagram that might clarify the source of errors.
b. What tools might the supervisor use to study ways to reduce the number of errors?
Answer:
Process Improvement and Six Sigma 25
EMPLOYEES
PROCESSING
METHOD
Experience
Number of clients per processor
Empowerment to contact client
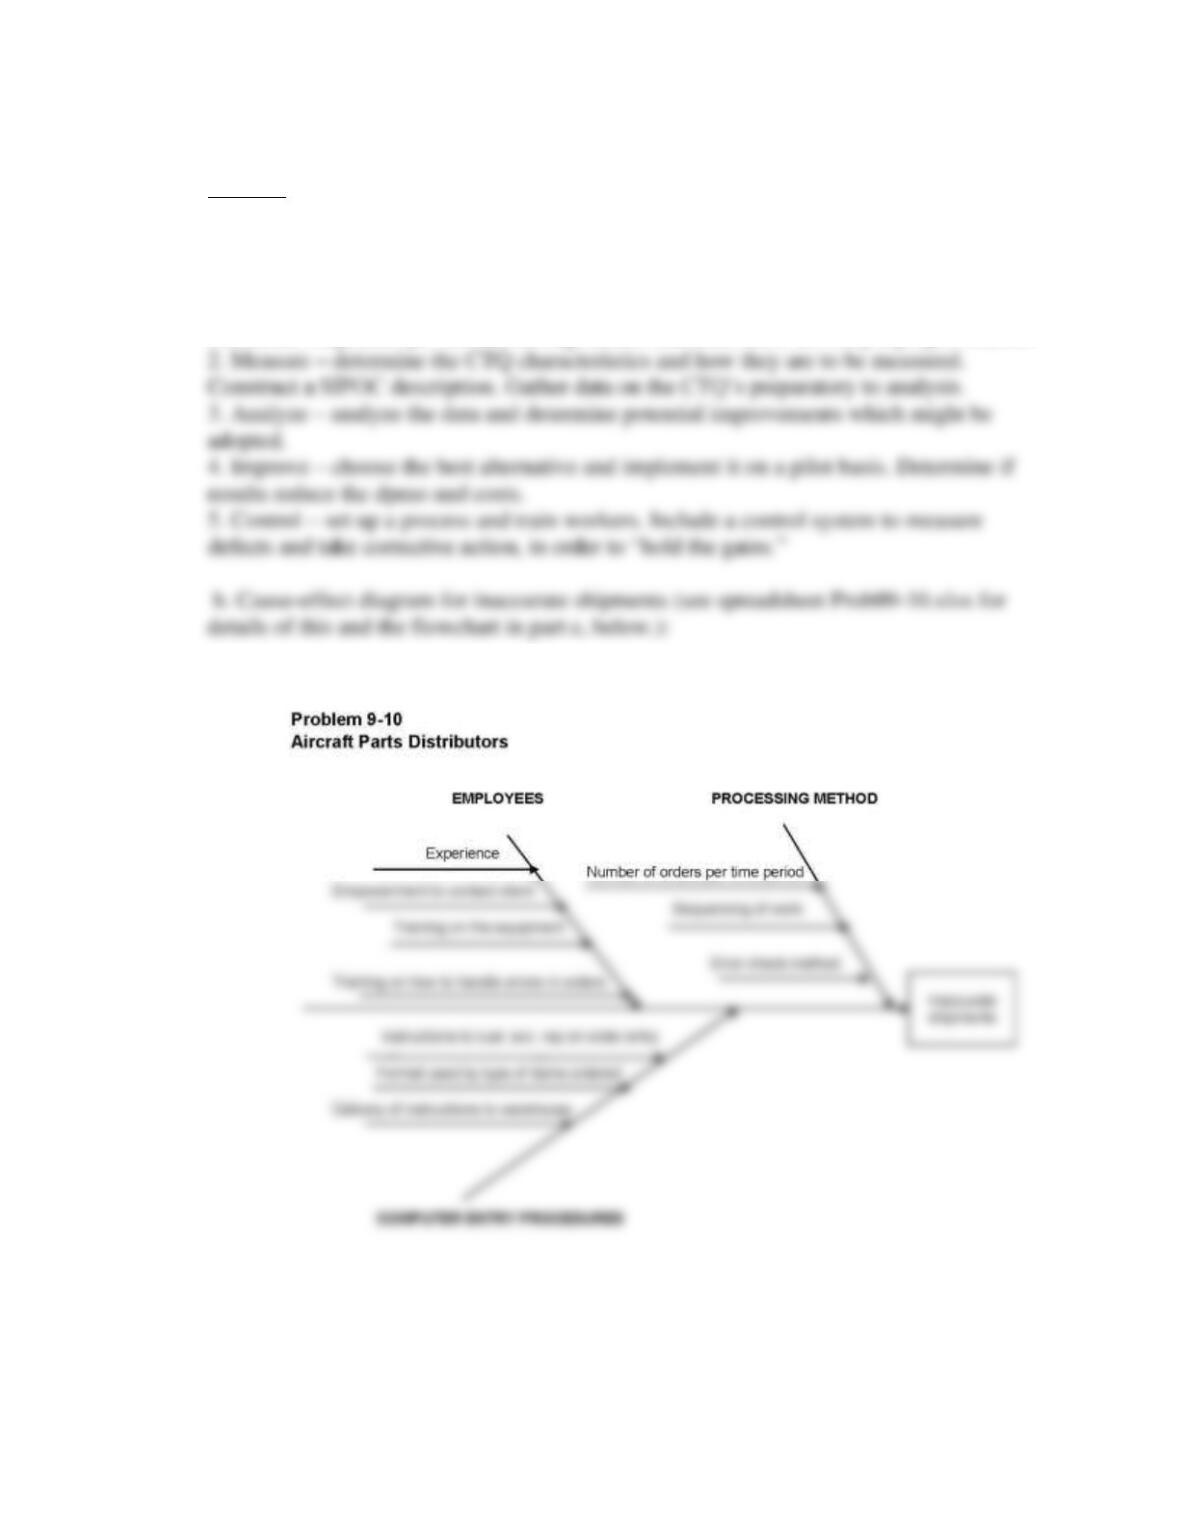
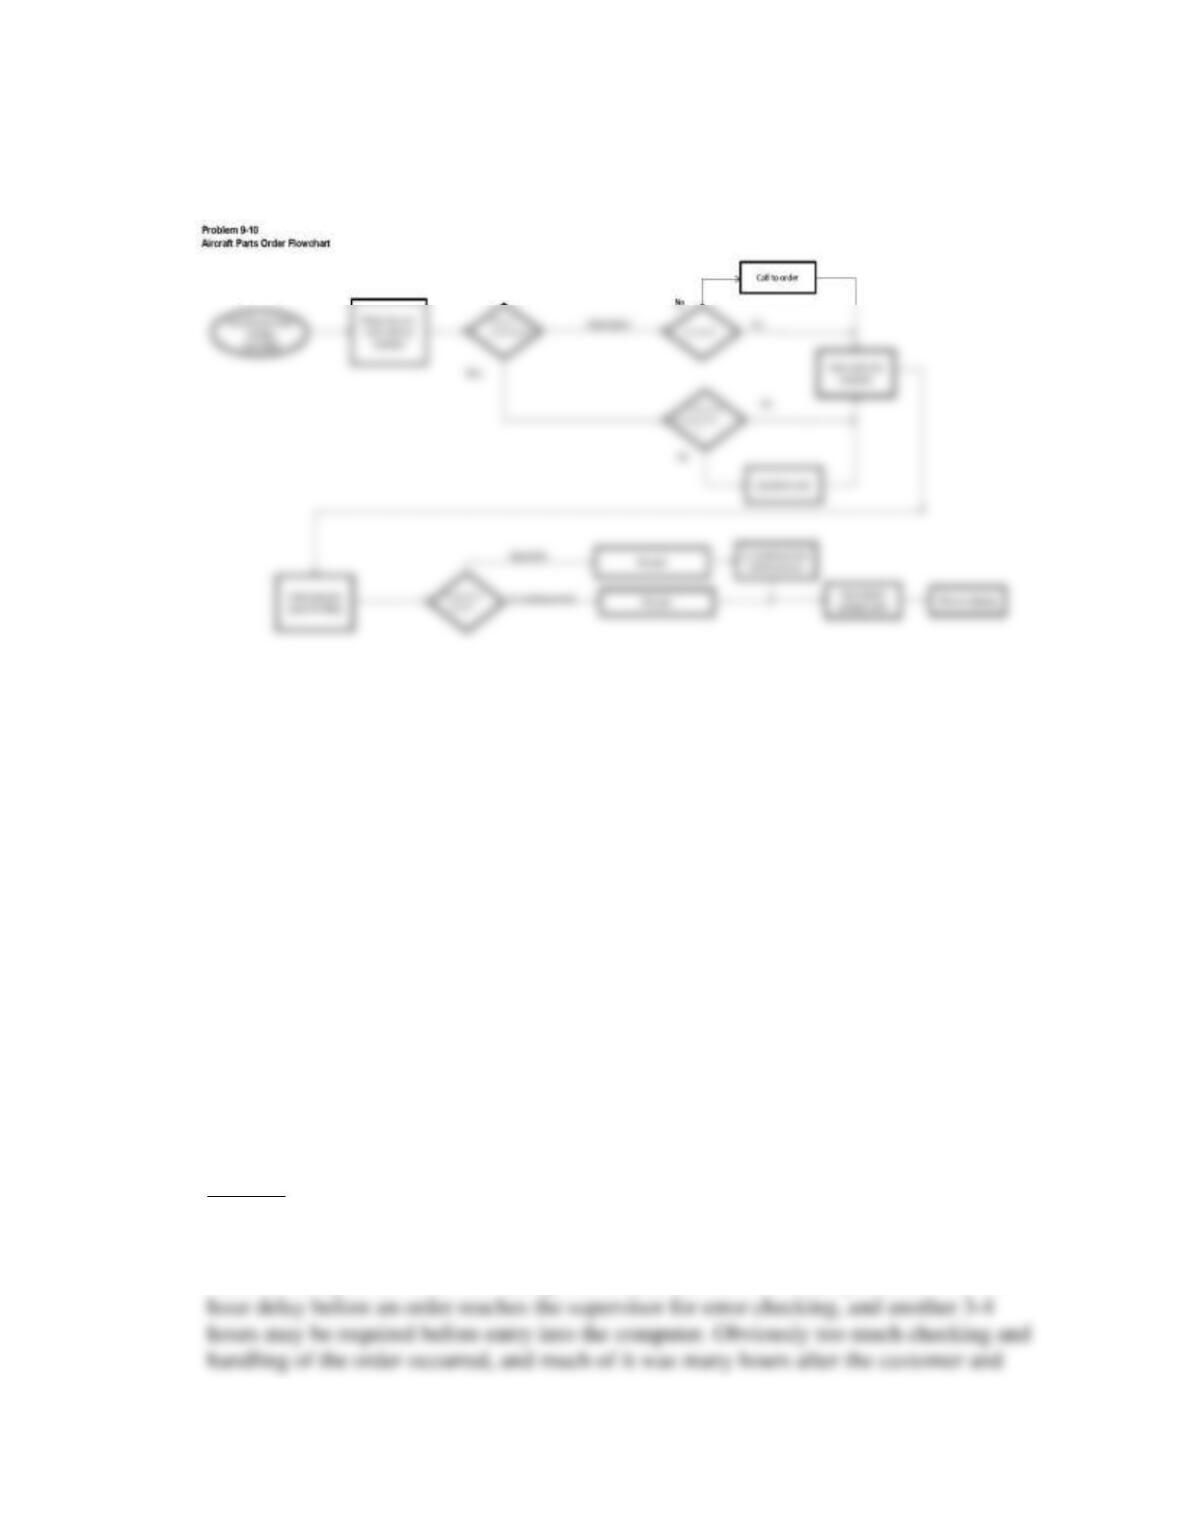
10. The maintenance of products such as aircraft engines is part of a complex supply chain.
Distribution centers fulfill orders for spare parts to customers around the world and
typically run on a 24/7 basis. Each day, as many as 4,000 different SKUs are shipped out
and over 1,000 SKUs are received in inventory. It is critical that each order be 100%
accurate. For example, orders that don’t match the shipping list are returned to the
distribution center because of customs regulations.
a. If the distribution center has identified inaccurate shipments as a significant problem,
explain how the DMAIC process might be applied.
b. Develop a logical cause-and-effect diagram for the problem “inaccurate shipment.”
c. Think about how a process for fulfilling orders might work and create a process map
(you might want to refer back to process design concepts in Chapter 7).
Sequencing of work
Training on how to handle errors in copy
Format used by clients
CLIENT PROCEDURES
Process Improvement and Six Sigma 26
Answer:
. a. To address the problem of inaccurate shipments, the DMAIC process may be used to
plan and carry out a Six Sigma improvement project:
1. Define – the problem is x%, which is equivalent to a certain number of dpmo, of
inaccurate shipments per month, having certain characteristics. Develop a project charter.
c. Process flowchart for aircraft parts orders.
Process Improvement and Six Sigma 27
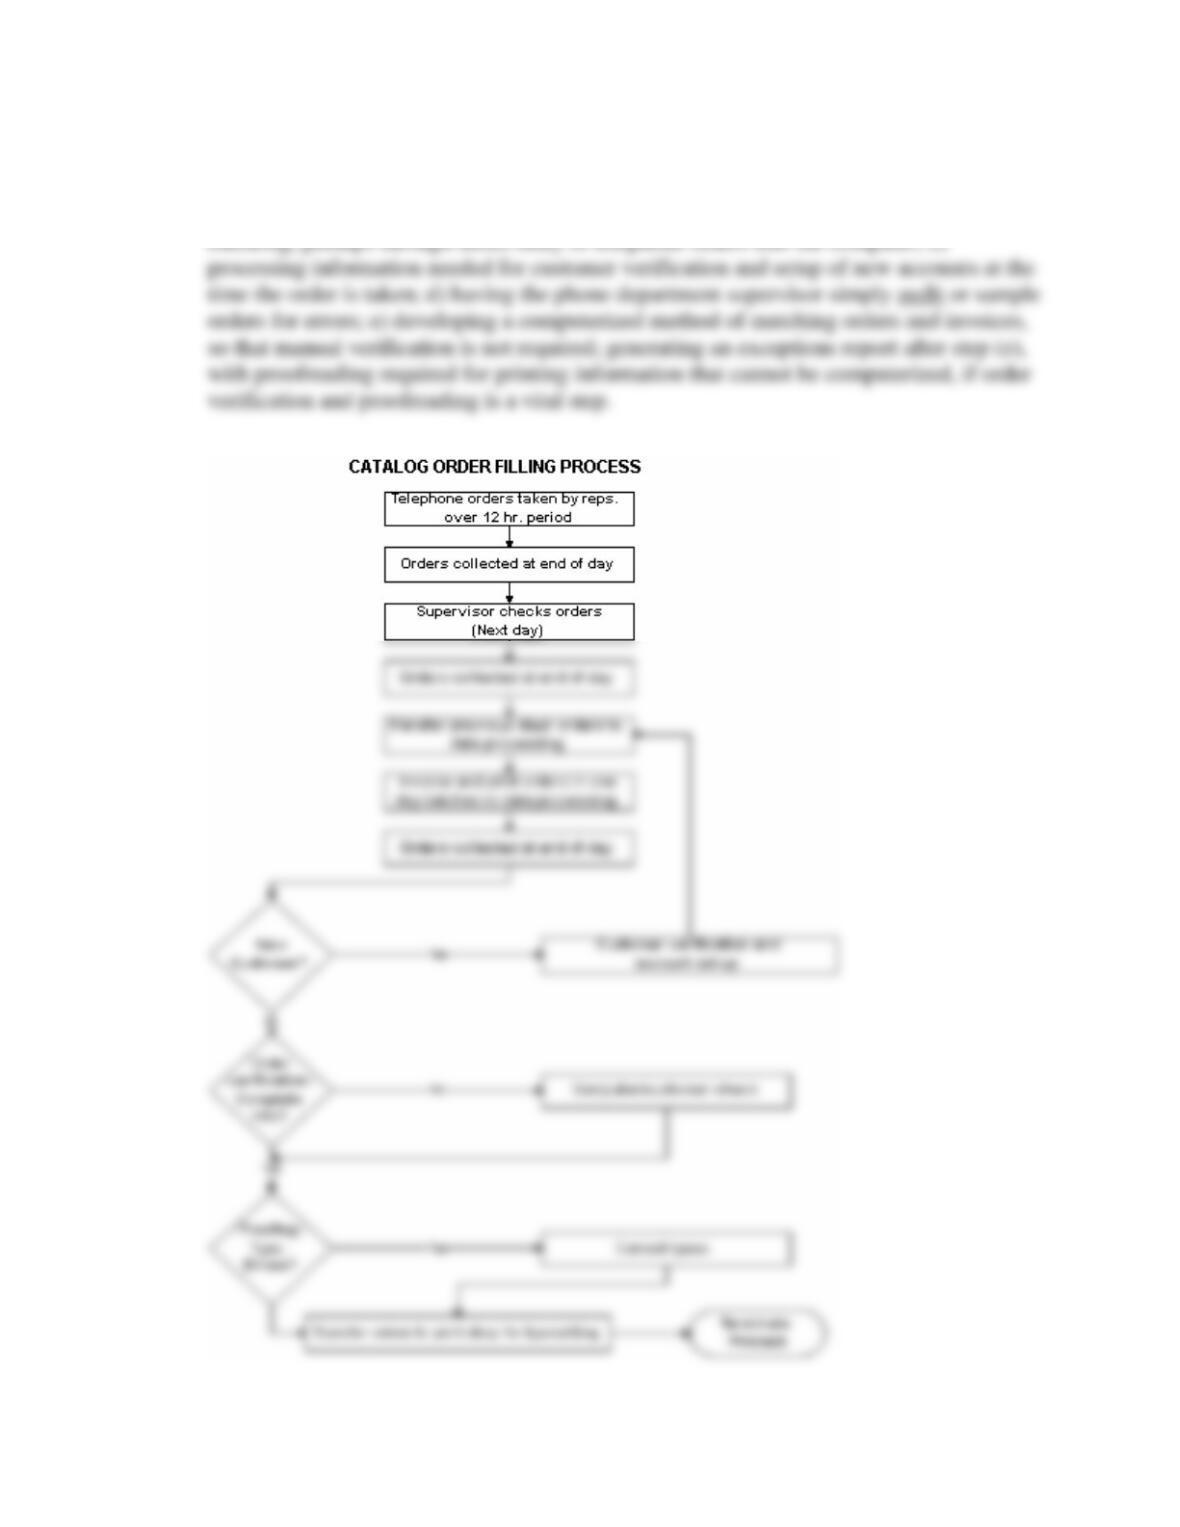
11. A catalog order-filling process at Cats Catalog Company for personalized printed
products for pet owners can be described as follows: Telephone orders are taken over a
12-hour period each day. Orders are collected from each person at the end of the day and
checked for errors by the supervisor of the phone department, usually the following
morning. The supervisor does not send each one-day batch of orders to the data
processing department until after 1:00 p.m. In the next step—data processing—orders are
invoiced in the one-day batches. Then they are printed and matched back to the original
orders. At this point, if the order is from a new customer, it is sent to the person who did
the customer verification and setup of new customer accounts. This process must be
completed before the order can be invoiced. The next step—order verification and
proofreading—occurs after invoicing is completed. The orders, with invoices attached,
are given to a person who verifies that all required information is present and correct to
permit typesetting. If the verifier has any questions, they are checked by computer or by
calling the customer. Finally, the completed orders are sent to the typesetting department
of the print shop.
a. Develop a flowchart for this process.
b. Identify opportunities for improving the quality of service in this situation.
Answer:
See flowchart, below, for the summary of the process at Cats Catalog Company. The
most serious problem from the standpoint of customer service is the potential for a 12-
Process Improvement and Six Sigma 28
order information had originally been taken. Suggestions for improvement include: a)
processing small batches of orders (perhaps within 1-2 hours, or less); b) building in error
Process Improvement and Six Sigma 29
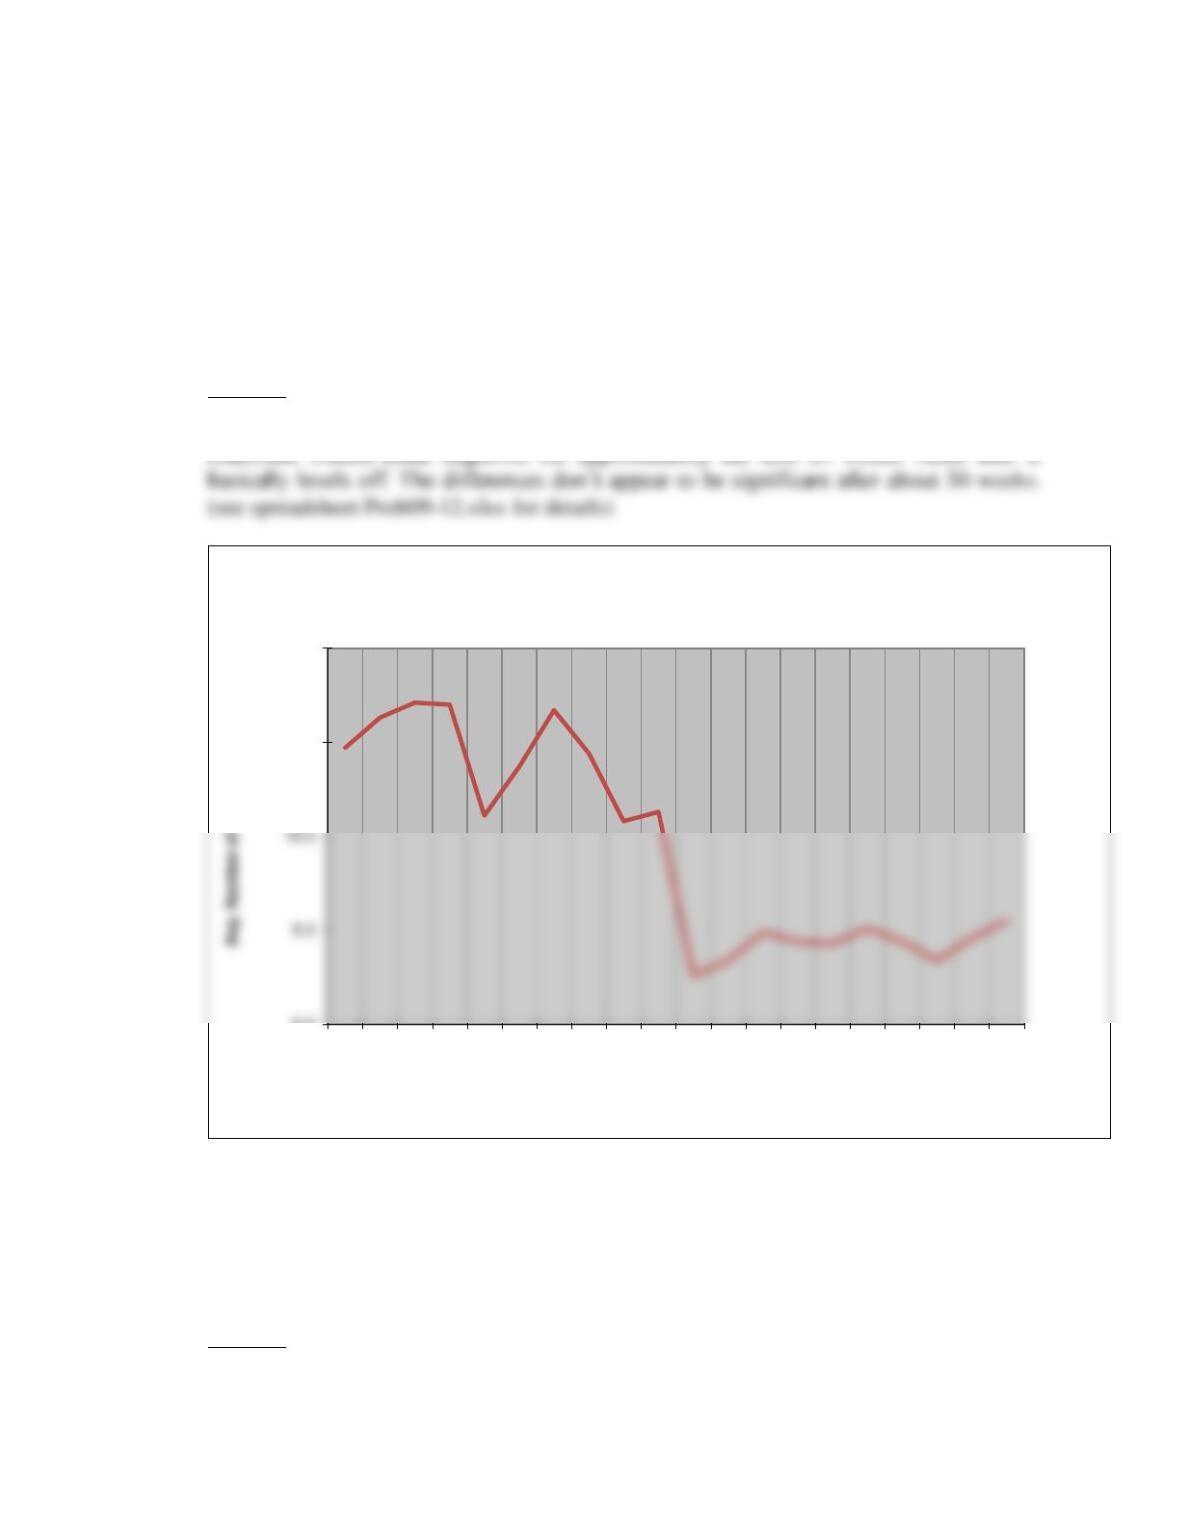
12. A Six Sigma analyst in Lakerside United Bank suspected that errors in counting and
manually strapping cash into bundles were related to the number of weeks that employees
had been employed on that job. The data available in the worksheet Prob. 9-12 were
gathered from the process. What do you conclude from your analysis? What do you
recommend?
Answer:
The scatter diagram shows that the employees’ accuracy in the strapping department of
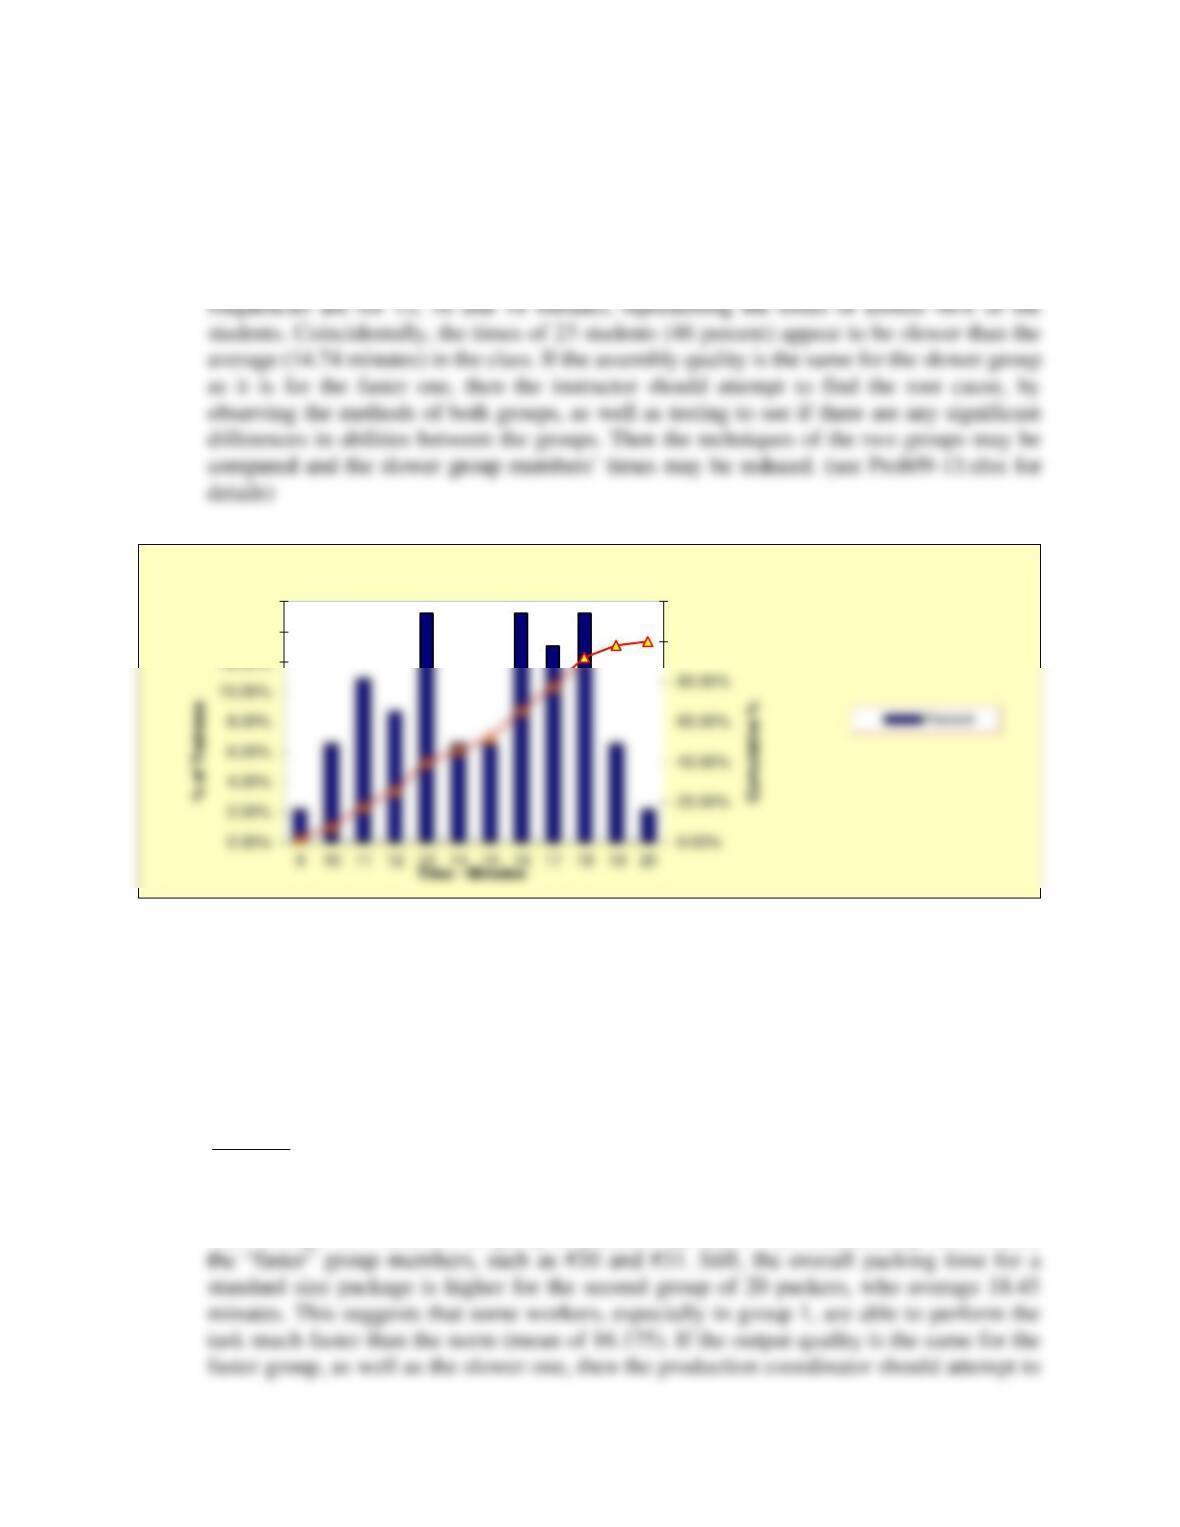
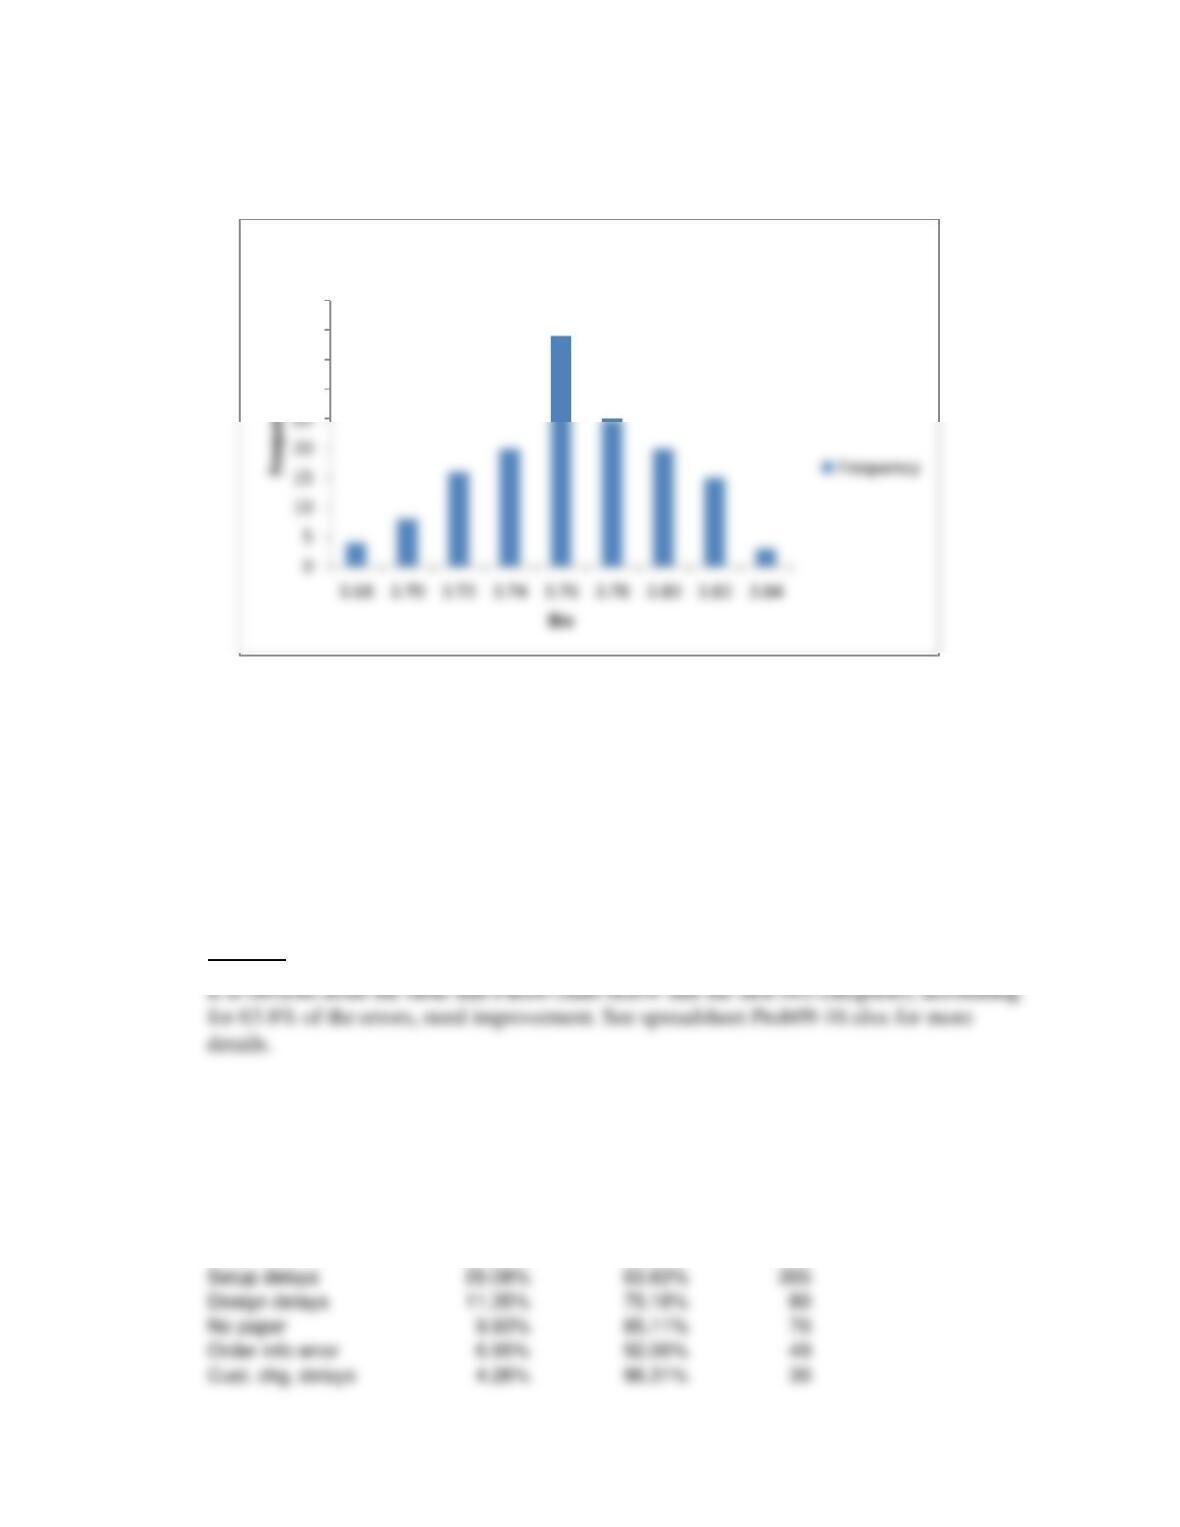
13. The times required for trainees in an electronics course at ElecktronTech to assemble a
component used in a computer were measured. These are provided in the worksheet
Prob. 9-13. Construct a histogram of the data. What recommendations for improvement
would you give the course instructor?
Answer:
0.0
15.0
20.0
Weeks 3 9 13 21 25 29 58 67 75
Weeks on the Job
Lakerside United Bank Cash Strapping Errors
Process Improvement and Six Sigma 30
The histogram indicates that the assembly time for the computer component in the
electronics course at Elecktronica Tech is concentrated in the two periods from 9 up to 14
minutes and from 15 up to 20 minutes, which shows a bi-modal distribution. The highest
14. The times required to prepare standard-size packages for shipping at Packman Shipping
Company were measured. The packers were divided into two equal groups of 20 people,
each, having similar experience in packing. These data are provided in the worksheet
Prob. 9-14. Construct a scatter diagram for these data. What recommendations for
improvement would you give the section leader, based on your findings?
Answer:
The scatter diagram below (see spreadsheet Prob09-14.xlsx) shows the packing time for a
standard size package for Packman Shipping is lowest for the first group of 20 packers,
who average 13.9 minutes. In group 2, packers #22 and 37 are considerably slower than
100.00%
120.00%
12.00%
14.00%
16.00%
Trainee Assembly Times
Process Improvement and Six Sigma 31
find the root cause, by observing the methods of both groups, as well as testing to see if
there are any significant differences in abilities between the group members. If the
methods used by the first group can be taught to the slower group members, this could
increase productivity, reduce cost, and perhaps even improve quality, simultaneously.
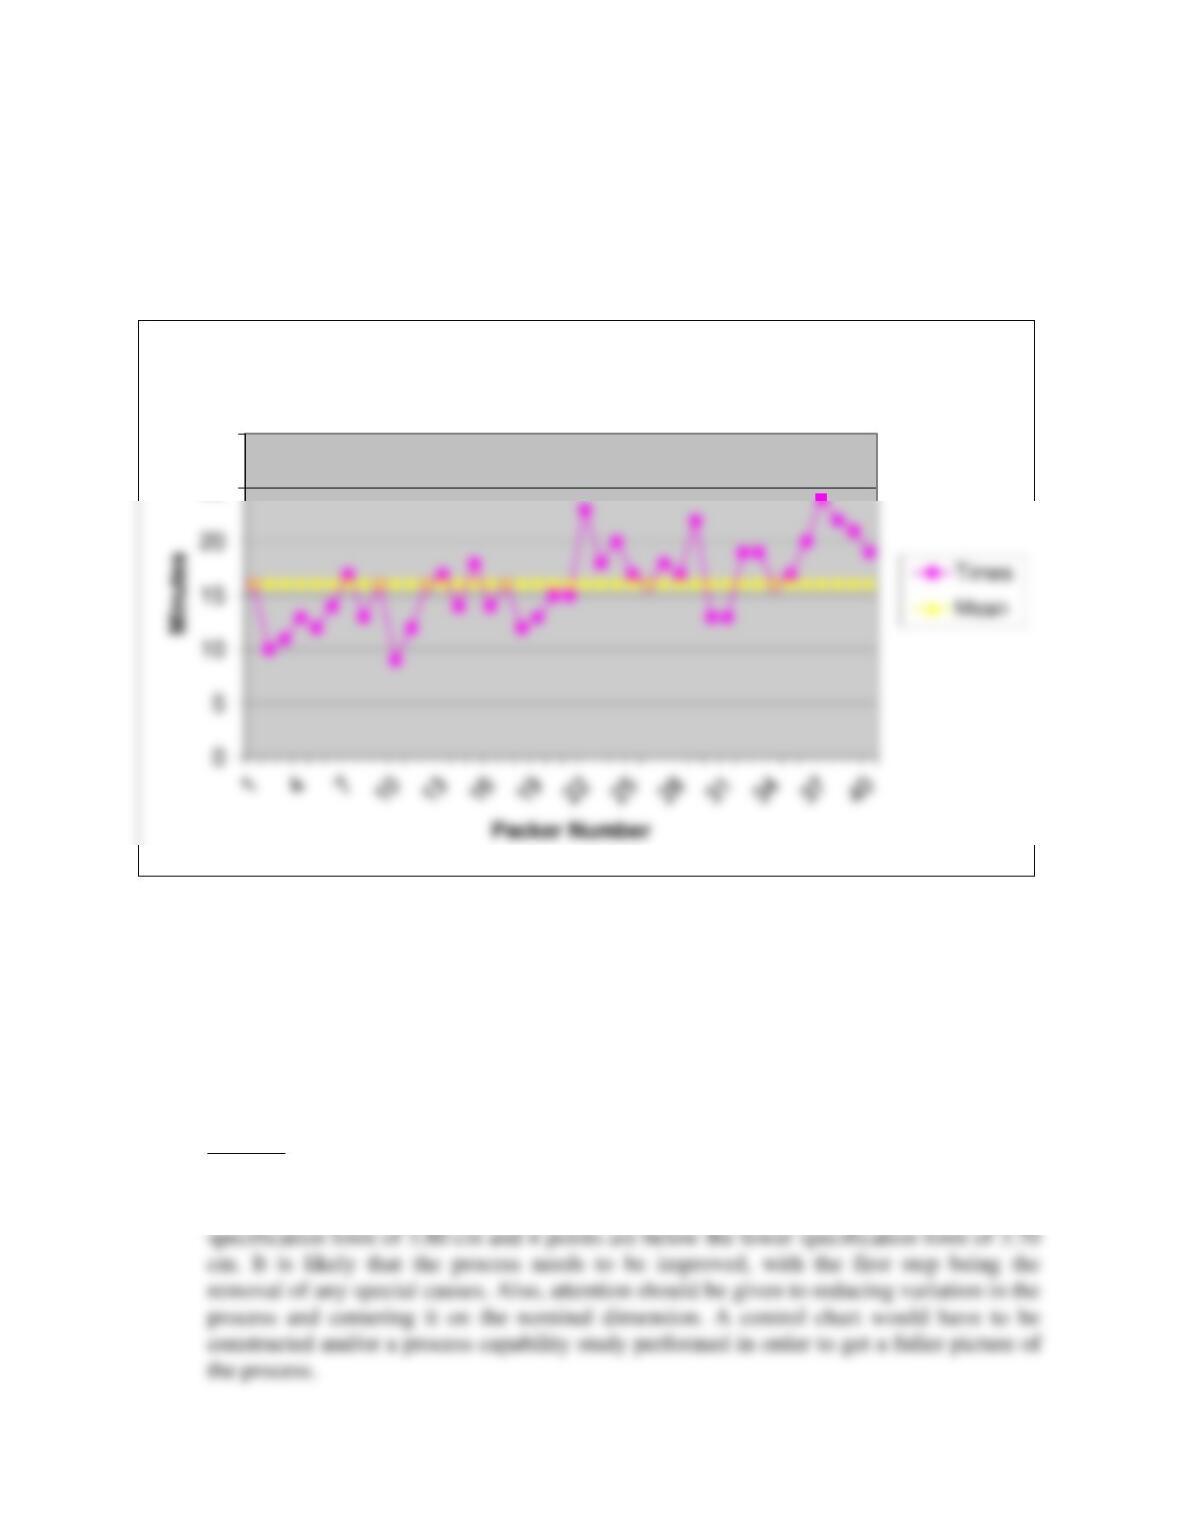
15. A process at PrintHeads, Inc.’s largest facility is used to make plastic gears for a
computer printer. The data found in the worksheet Prob. 9-15 were gathered by a quality
analyst. The gears were designed to be 3.75 ± 0.05 centimeters (cm) in diameter.
Construct a histogram of the data. What can you observe about the shape of the
distribution? What would you recommend to the production manager based on your
analysis?
Answer:
The histogram on the graph below (see spreadsheet Prob09-15.xlsx for details) shows
that, although the data are fairly uniformly distributed, 18 points are above the upper
25
30
Packman Shipping -Time by Packer
Process Improvement and Six Sigma 32
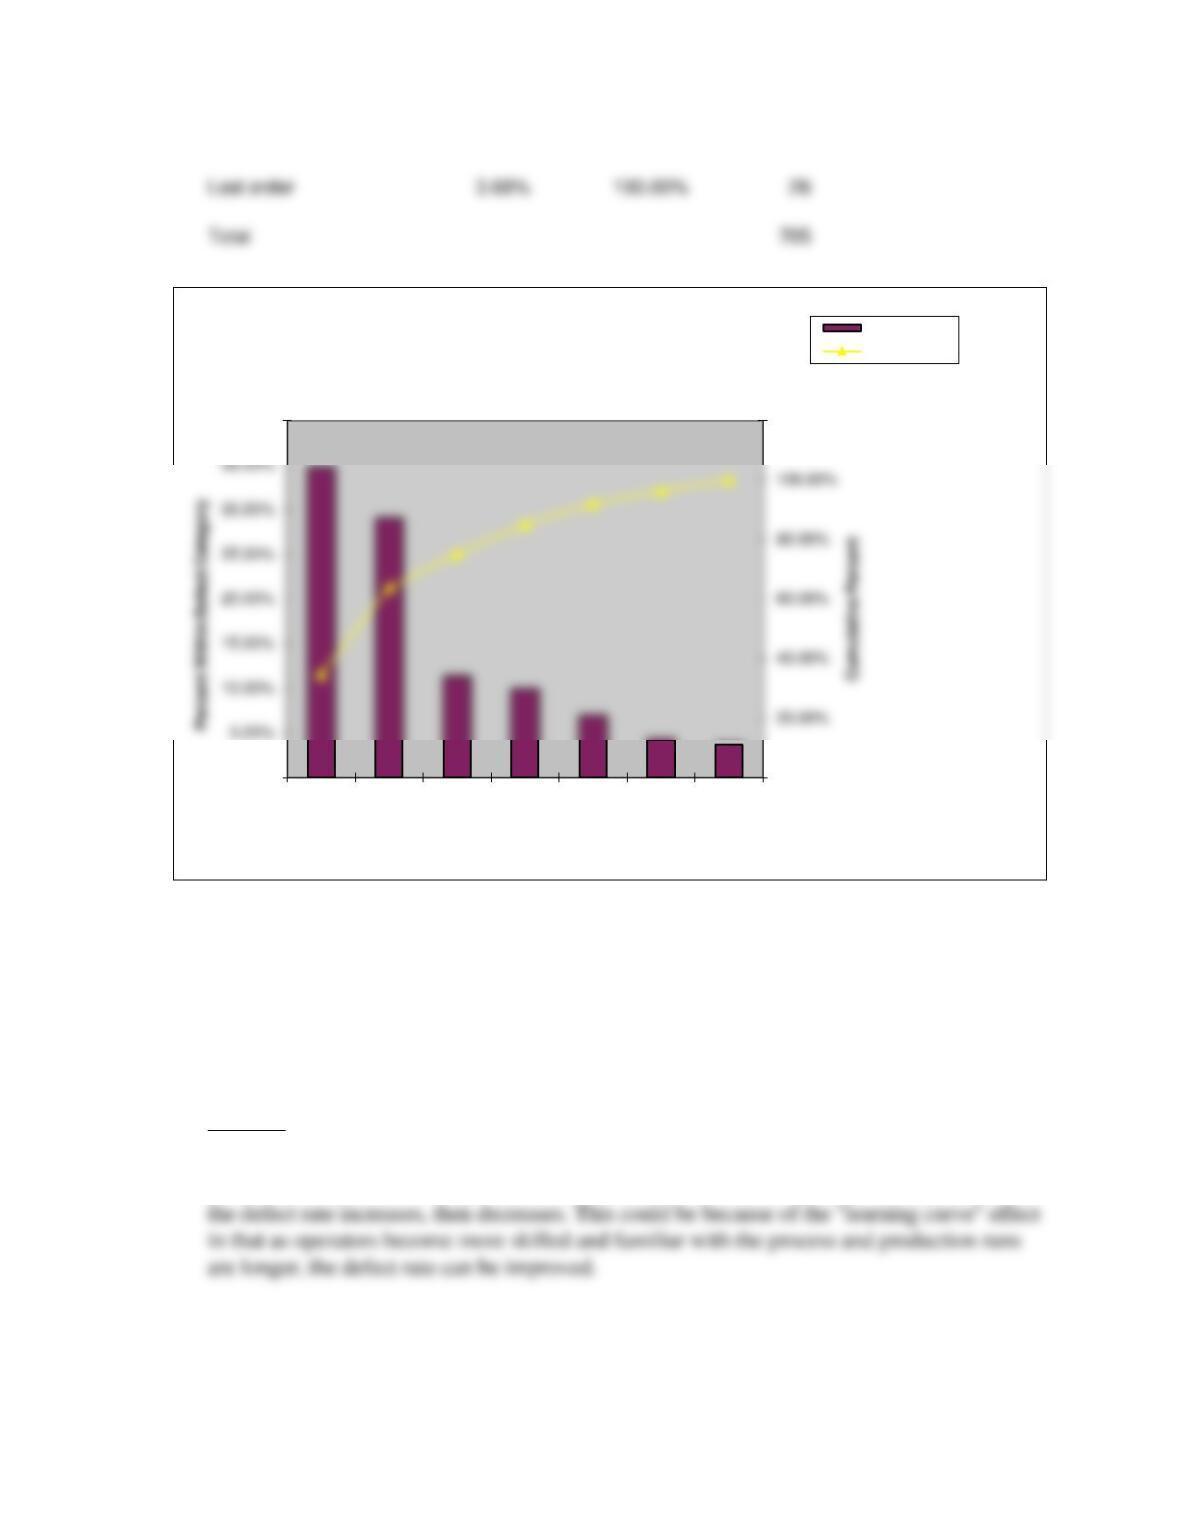
16. Deuce Printing Company realized that they were losing customers and orders due to
various delays and errors. In order to get to the root cause of the problem, they decided to
track problems that might be contributing to customer dissatisfaction. The list of the
problems provided in worksheet Prob. 9-16 shows their frequencies of occurrence over a
six-month period. What technique might you use to graphically show the causes of
customer dissatisfaction? What recommendations could you make to reduce errors and
increase customer satisfaction?
Answer:
DEUCE PRINTING COMPANY
QUALITY ERRORS AND
PERCENTAGES
Percent
Cumulative %
Frequency
No press time
34.75%
34.75%
245
Setup delays
29.08%
63.83%
205
Design delays
11.35%
75.18%
Cust. chg, delays
30
35
40
45
Histogram – Gear Dimensions
Process Improvement and Six Sigma 33
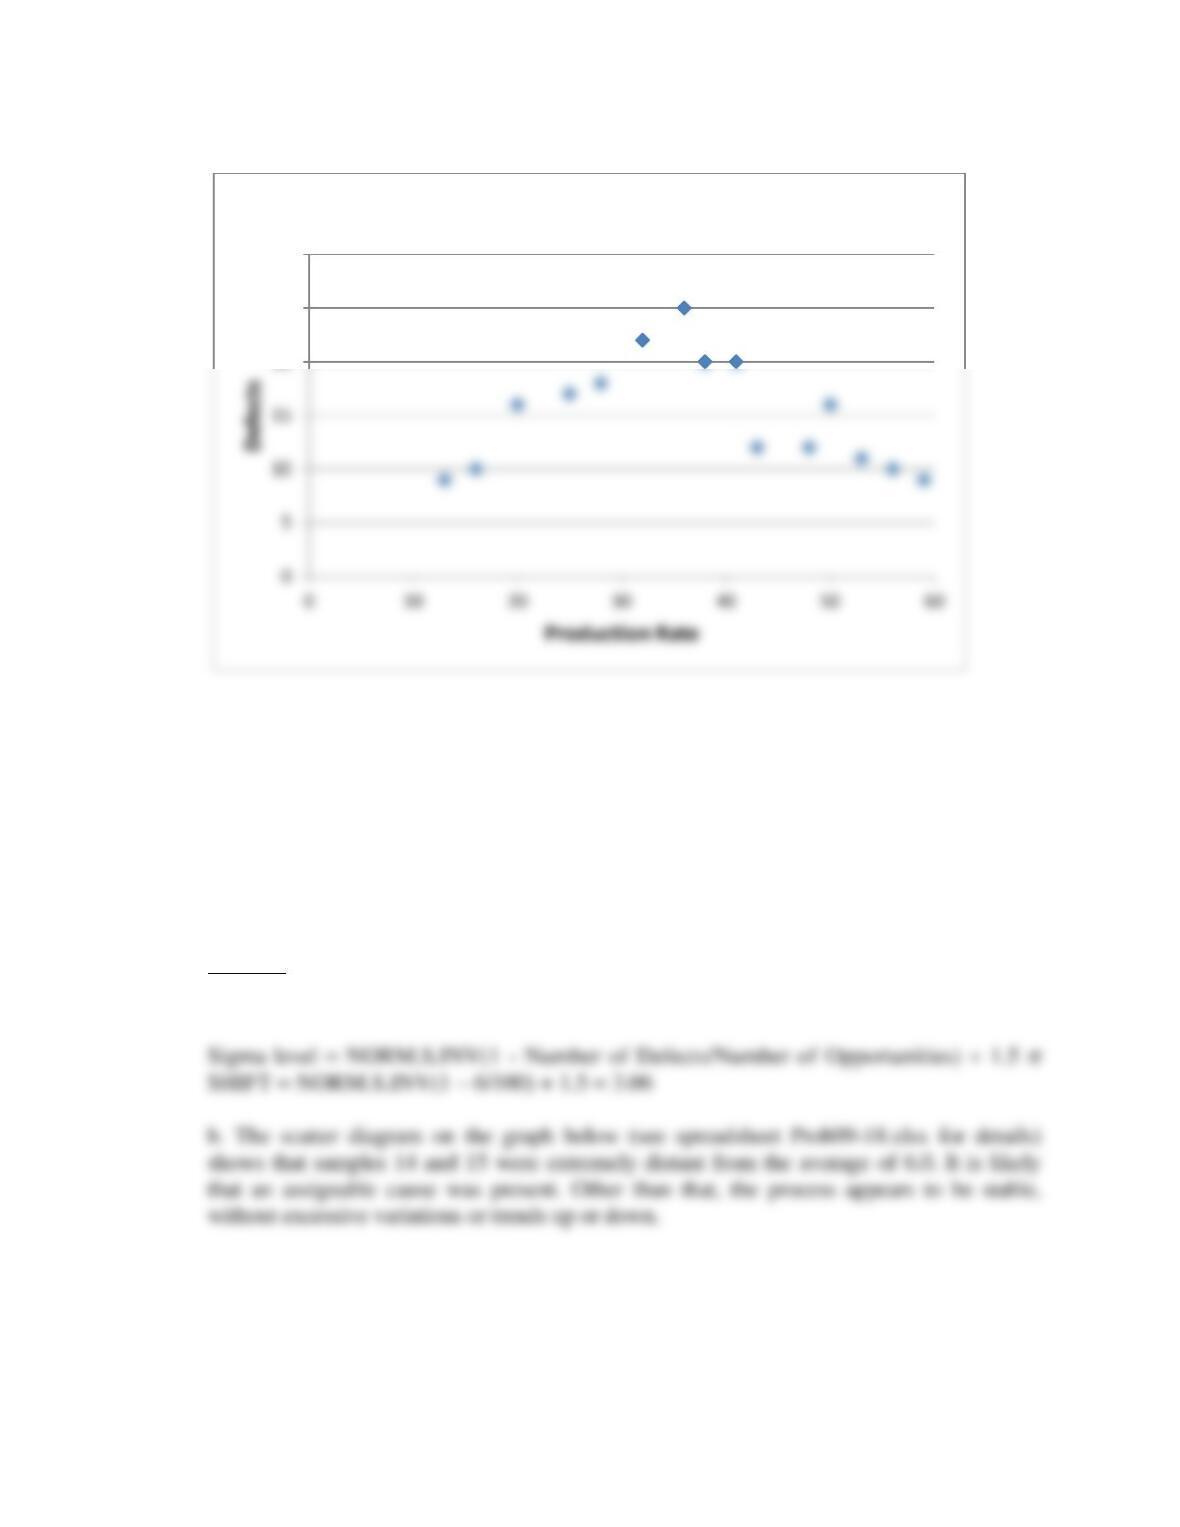
17. In a DeltaWidgets, Inc. process, the production rate (parts/hour) was thought to affect the
number of defectives found during a subsequent inspection. To test this theory, the
production rate was varied and the numbers of defects were collected for the same batch
sizes. The results can be found in the worksheet Prob. 9-17. Construct a scatter diagram
for these data. What conclusions can you reach?
Answer:
The scatter diagram (see spreadsheet Prob09-17.xlsx for details) for the DeltaWidgets
process, shows an interesting, and counter-intuitive result. As the production rate increases,
0.00%
120.00%
0.00%
40.00%
No press
time
Setup
delays
Design
delays
No paper Order
info error
Cust.
chg,
delays
Lost
order
Defect Categories
Pareto Chart for Deuce Printing Co.
Percent
Cumulative %
Process Improvement and Six Sigma 34
18. The number of defects found in 25 samples of 100 Buenosdientes Candy Company
lemon drops taken on a daily basis from a production line over a five-week period is
given in the worksheet Prob. 9-18.
a. Compute dpmo and find the sigma level.
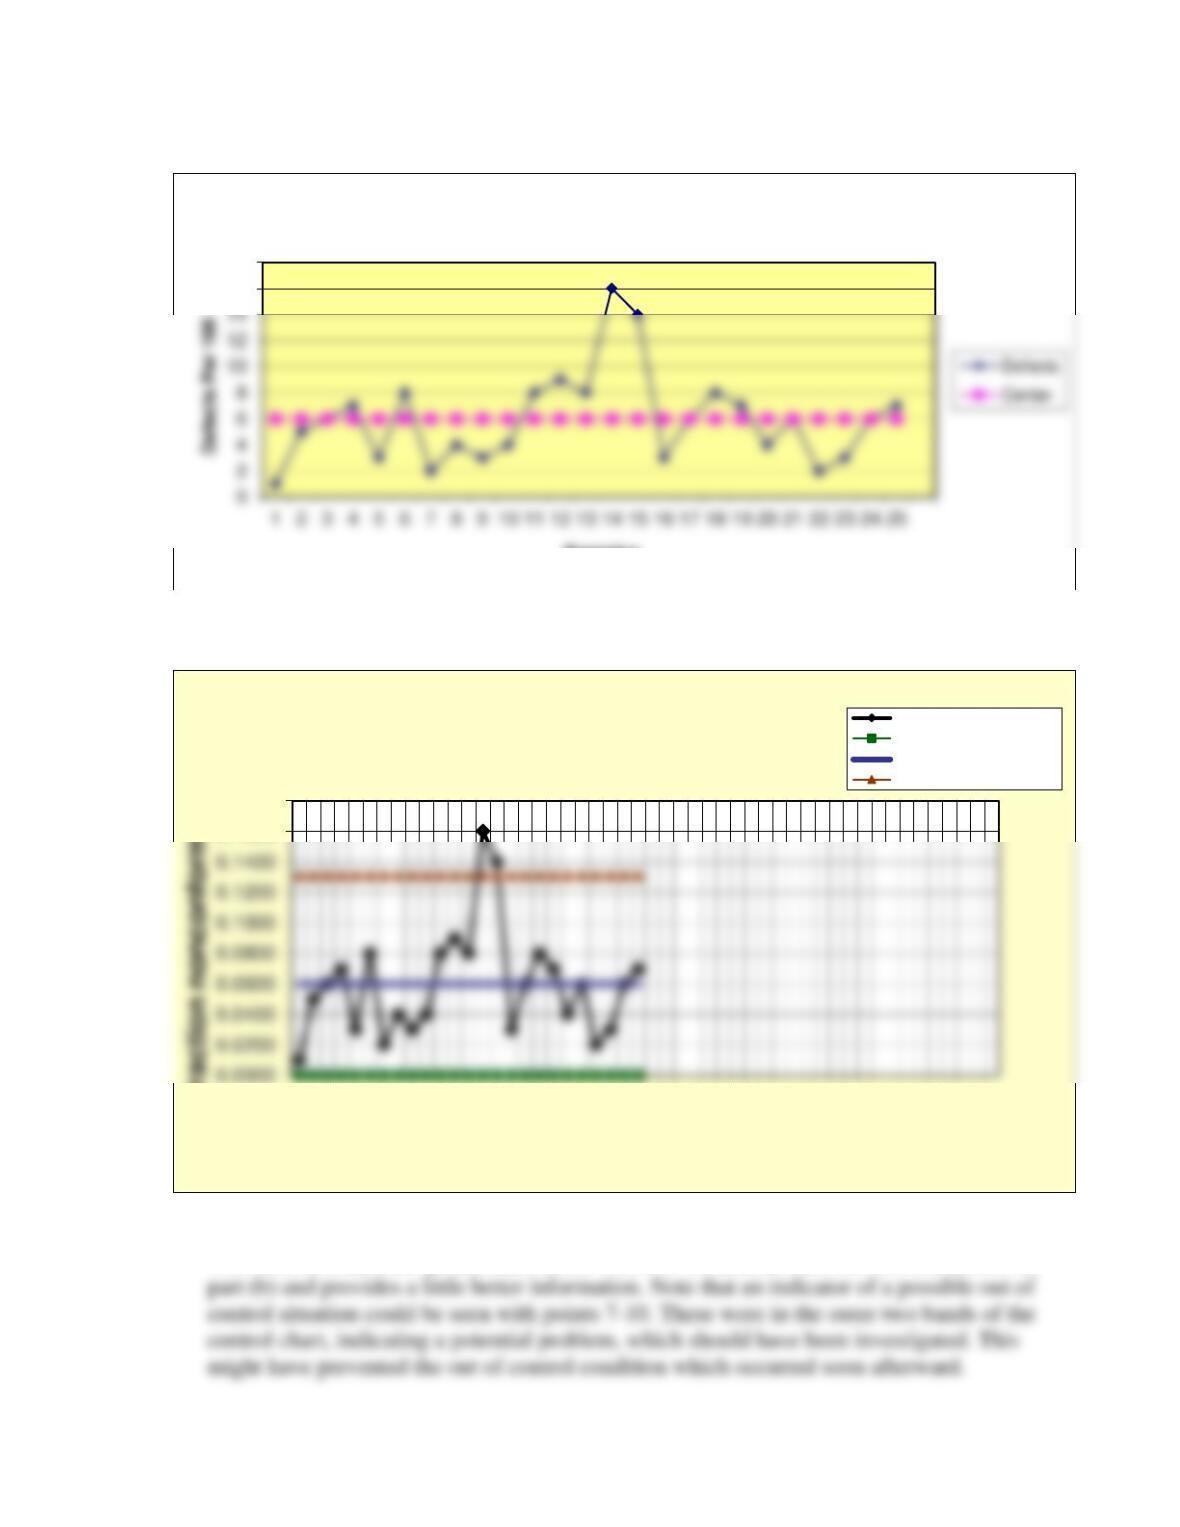
b. Plot these data on a run chart. Can you identify any special causes?
c. Plot the data on the appropriate control chart. Does this confirm your answer to part
(b) or does it provide better information?
Answer:
a. The dpmo and the sigma level may be computed as: 6/100 X 1,000,000 = 60,000
20
25
30
Production Rate vs. Defects
Process Improvement and Six Sigma 35
c. When the data is plotted on an appropriate control chart, we see:
This control chart (see spreadsheet Prob09-18c.xlsx for details) does confirm the answer to
16
18
Samples
Prob. 9-18 Defects Per Sample of 100
0.1600
0.1800
1 3 5 7 9 11 13 15 17 19 21 23 25 27 29 31 33 35 37 39 41 43 45 47 49
Fraction nonconforming
Sample number
Prob 9-18 Attribute (p) Chart
Fraction nonconforming
Lower control limit
Center line
Upper control limit
Process Improvement and Six Sigma 36
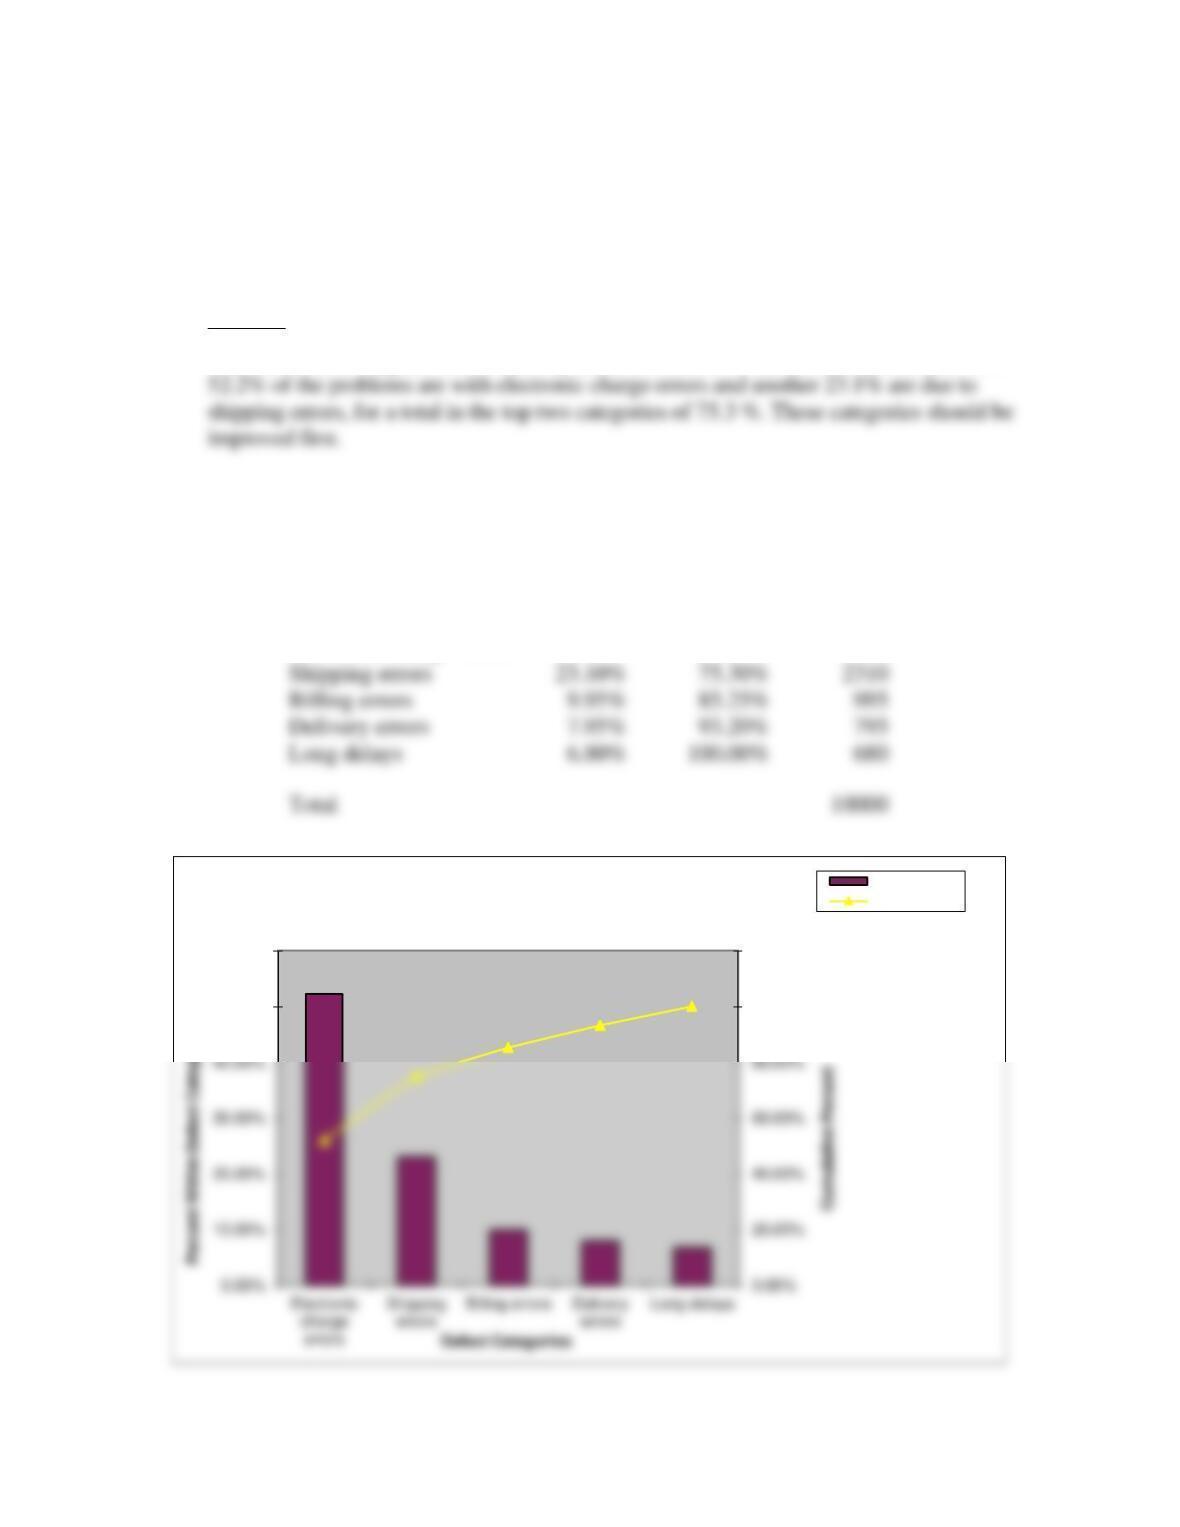
19. Analysis of customer complaints at the Lauren Elizabeth Apparel Company revealed
errors in five categories, such as billing, shipping, etc. Data can be found in the
worksheet Prob. 9-19. Construct a Pareto diagram for these data. What conclusions can
you reach?
Answer:
From the Pareto diagram, below (and spreadsheet Prob09-19.xlsx), we can conclude that
LAUREN ELIZABETH APPAREL COMPANY
QUALITY ERRORS AND PERCENTAGES
Percent
Cumulative
%
Frequency
Electronic charge errors
52.20%
52.20%
5220
Shipping errors
23.10%
75.30%
2310
Billing errors
85.25%
Delivery errors
93.20%
Long delays
Total
100.00%
120.00%
50.00%
60.00%
Pareto Chart for Lauren Elizabeth Apparel Company
Percent
Cumulative %
Process Improvement and Six Sigma 37
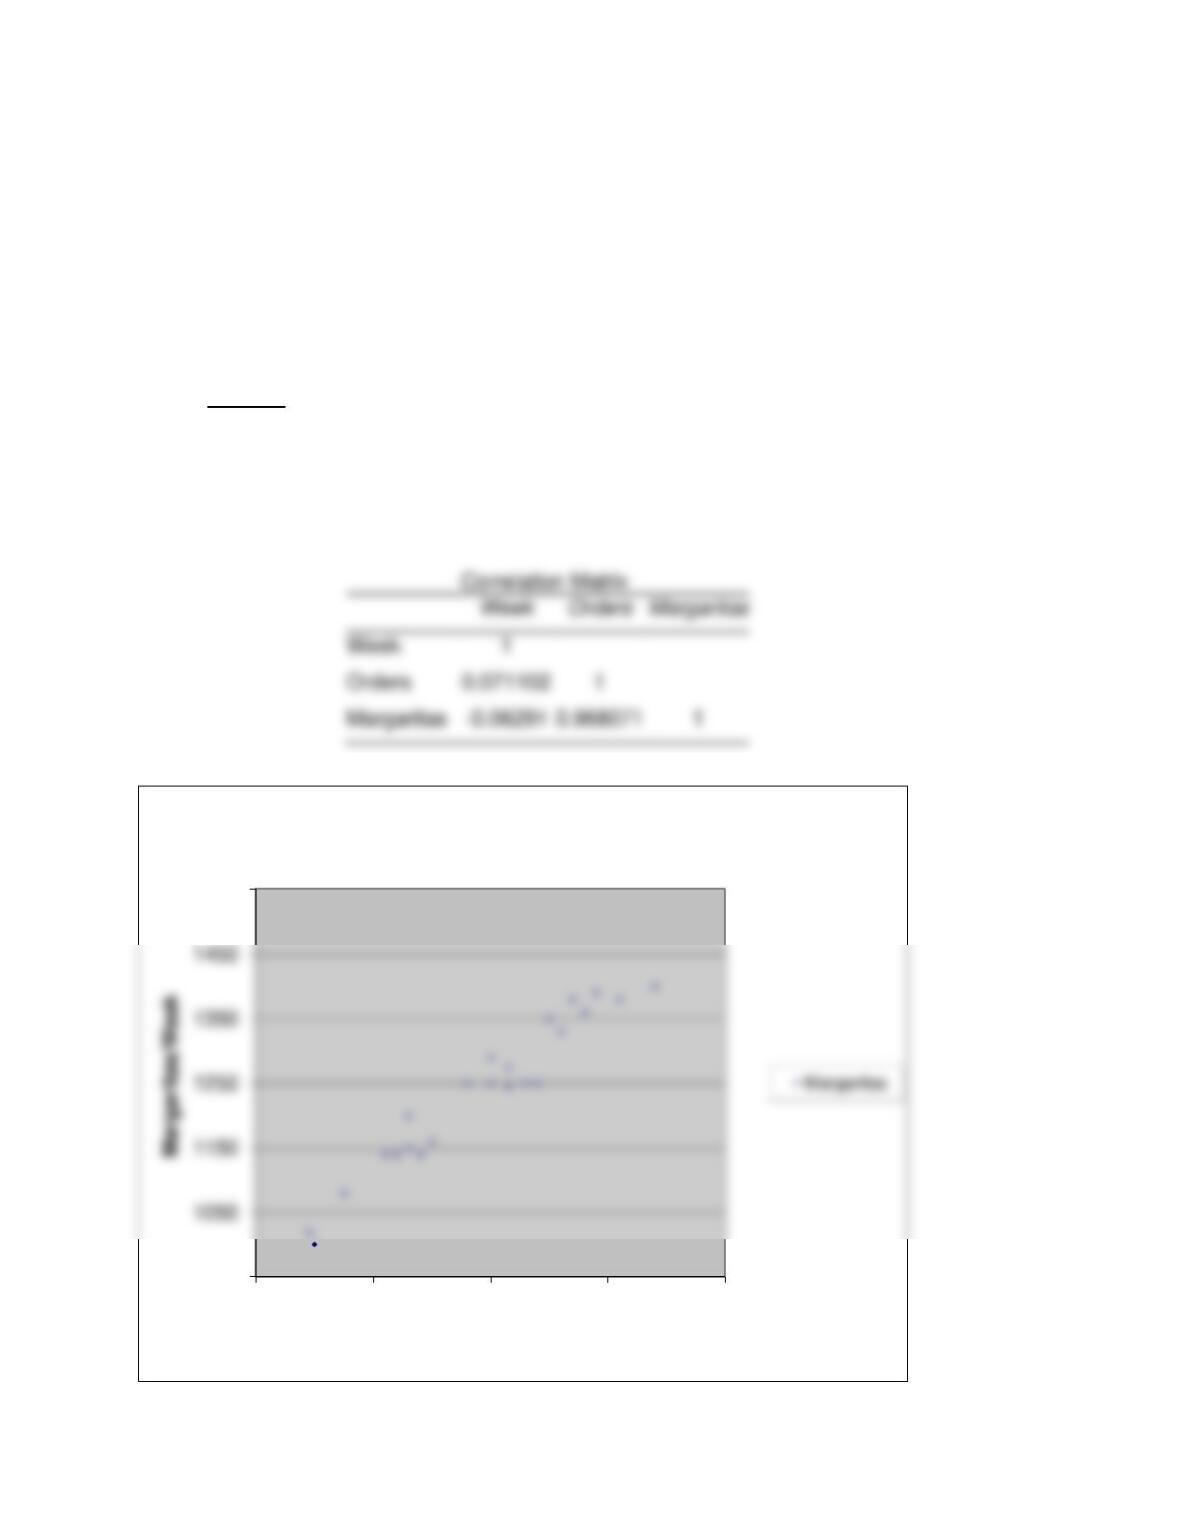
20. The Monterey Fiesta Mexican Restaurant is trying to determine whether sales of its
popular Pan Con Mucho Sabor breadsticks are correlated with the sales of margaritas. It
has data on sales of breadstick baskets and margaritas for 25 weeks, shown in the
worksheet Prob. 9-20. Plot a scatter diagram and compute the correlation using Excel
tools. What do your results indicate?
Answer:
It can be seen on the correlation matrix (see Prob09-20.xlsx for details) that breadstick
orders are highly correlated with numbers of margaritas. There is a 0.968 correlation
coefficient. The scatter diagram also shows a consistent pattern, as well.
950
1550
600 700 800 900 1000
Breadstick Orders/Week
Correlating Bread and Margaritas
Process Improvement and Six Sigma 38
Answers to Projects, Etc.
1. This project is designed to help the student to find how Six Sigma is viewed by various
2. This project will take significant time to develop, but can pay tremendous dividends in
3. This project is designed to help the student to find which Six Sigma or lean techniques
are used in businesses to improve their processes. Results will vary, but often are related
to the quality focus in the firm. Most companies now track some output measures. Some
4. Results will vary. A flowchart for exams should be prepared, based on the steps that each
5. See the diagrams for a and b, below. The C-E diagram for c will be similar.
Process Improvement and Six Sigma 39
6. Results will vary. Students will find some interesting short case studies that contain
7. Contacts may be set up through the College of Education at your university. Teachers at a
Answers to Case Questions
I. Case – LT, Inc.
1. There are a number of steps that could be taken to improve the process. The Six Sigma
team involved in this study recommended, and then carried out, the following
improvement steps. They included:

Process Improvement and Six Sigma 40
• Replaced the existing batch and queue system with a flow system. Customer orders
were processed one at a time as they arrived. Individuals in each step were trained to do
all activities in that step.
• Automated the billing system and encouraged customers to submit orders via the
internet.
• Trained order processing employees to take data correctly, verify data for accuracy and
completeness, and look for special terms.
• Sent invoices only after receiving confirmation from shipping personnel that orders
were sent.
• Printed the name and phone number of the customer’s contact person, due dates and
2. Final actions – development of metrics and next steps
The Six Sigma team developed a set of relevant performance measurements to track the
efficiency and effectiveness of the billing process. The metrics selected were: