*** Problem Set Key – Do Not Post or Distribute ***
Chapter 9: Forecasting
Introduction to Operations & Supply Chain Management (Bozarth & Handfield, 3rd Ed.)
DIRECTIONS To generate the homework key, input the same 4-digit number used to
create the original homework assignment. The correct answers will
automatically be generated.
Name: *** KEY ***
20
ChesterBoz makes high-end boogie boards, with most sales coming from the U.S.
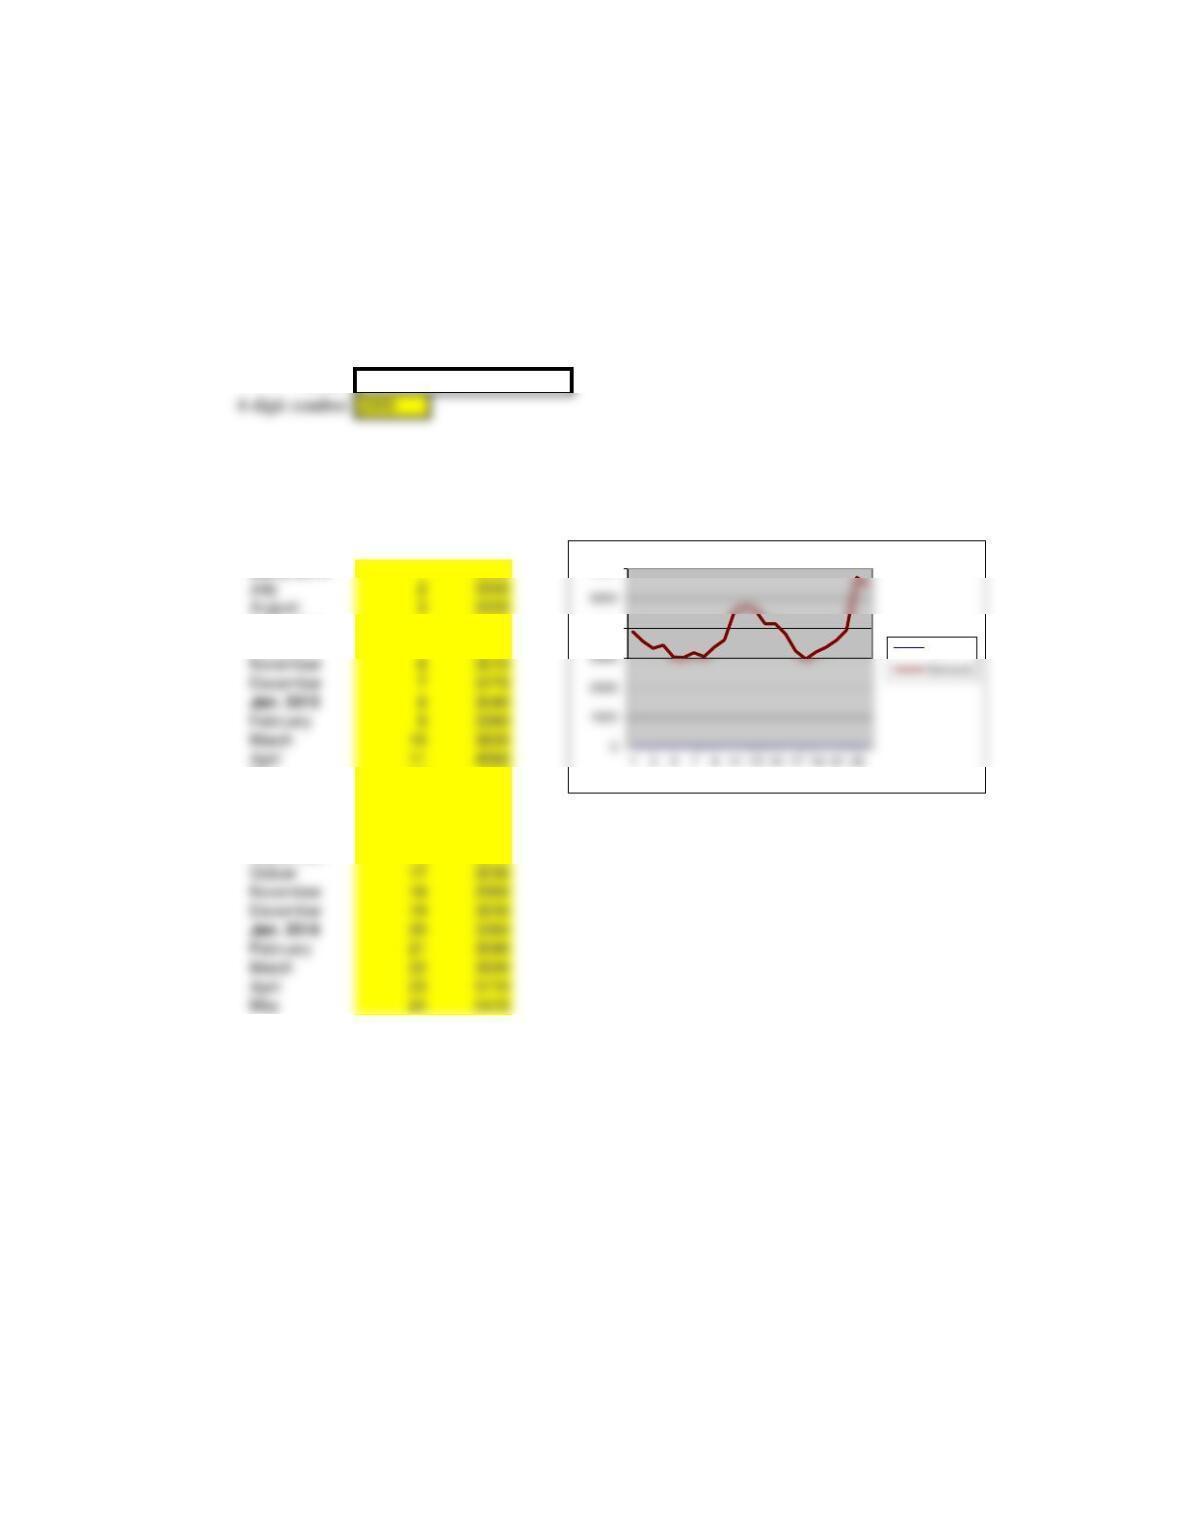
The table and graph below show the demand for the last two years.
Period Demand
June, 2014 13880
Jan. 2015 83040
September 4 3430
October 5 3030
Jan. 2016 20 3360
May 12 4720
June 13 4620
July 14 4140
August 15 4150
September 16 3810
4000
6000
Period
1
Chapter 9: Forecasting
*** KEY ***
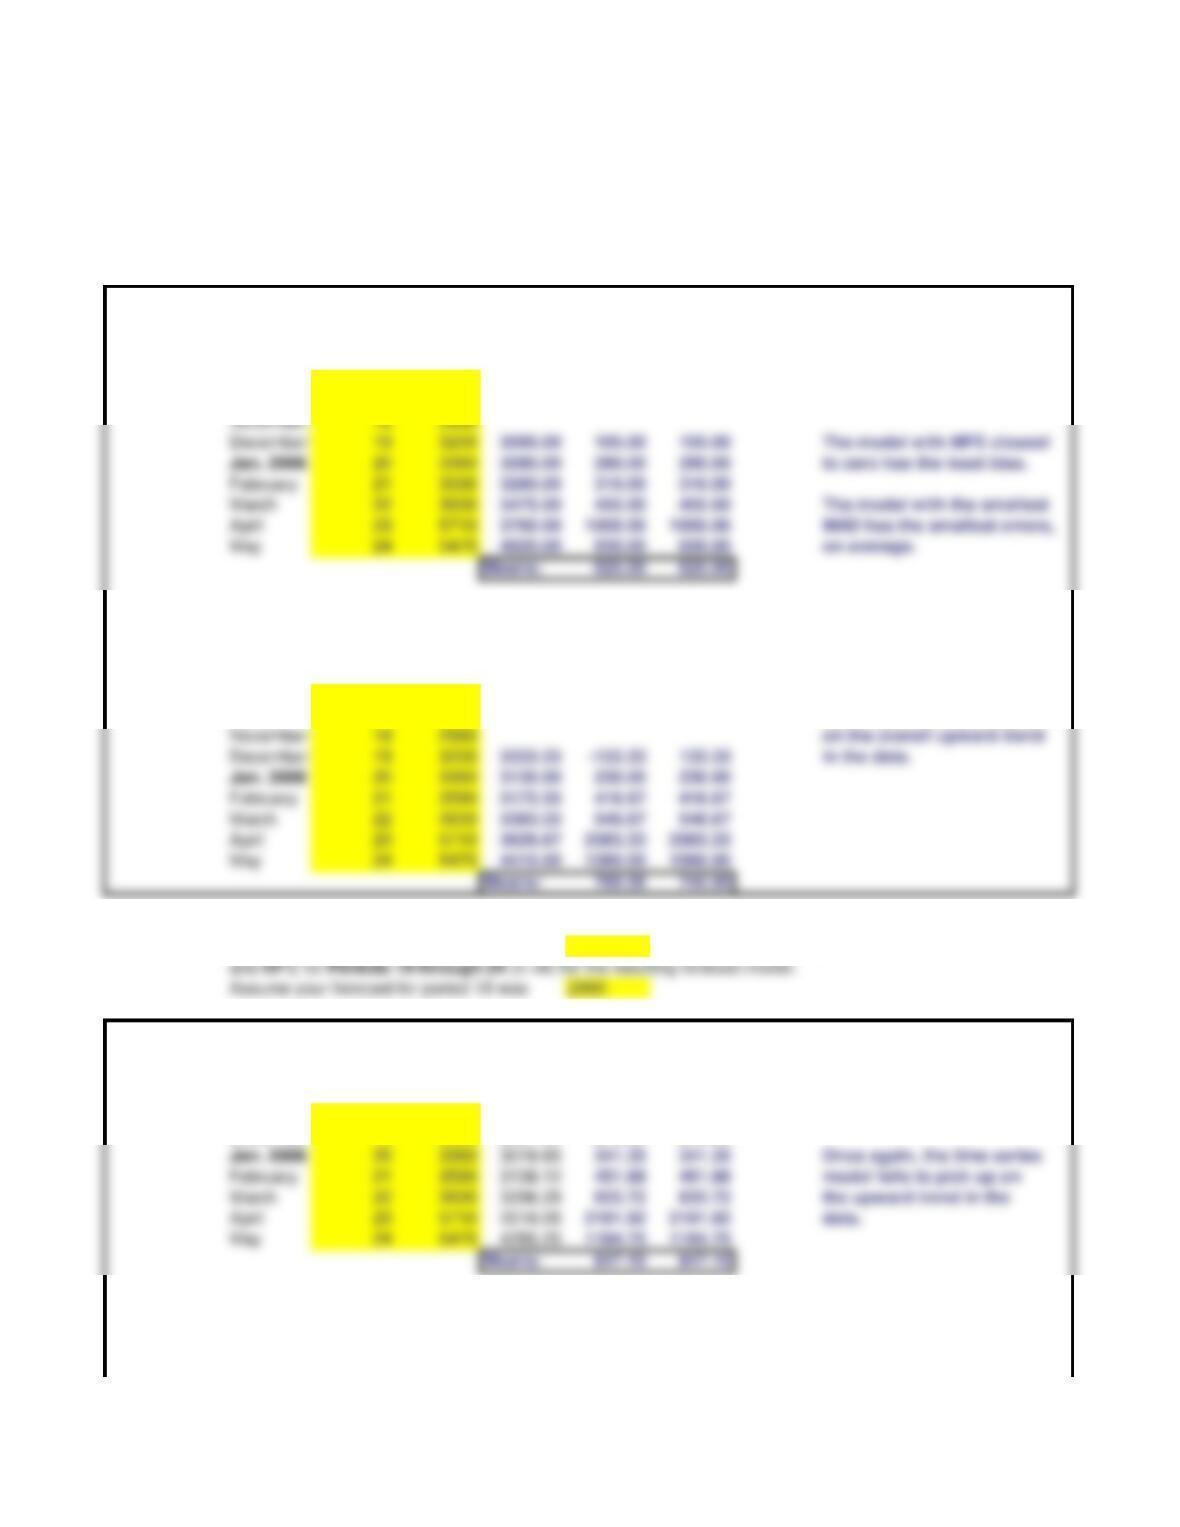
Problem 1 Develop 2-period & 3-period moving average models forecast for Periods 19 through 24.
Calculate MFE & MAD for Periods 19 through 24 for the resulting forecast model.
Which model has the least bias? Which model has relatively smaller errors? Show all your work.
2-period
forecast
Forecast
error
Absolute
deviation
September
16 3810
Octoer 17 3230
3-period
forecast
Forecast
error
Absolute
deviation
September
16 3810
In either case, neither model
Octoer 17 3230 does a good job picking up
Problem 2
Develop an SESM forecasting model with a =
0.35
for Periods 19 through 24. Calculate MAD
and MFE for Periods 19 through 24 (n =6) for the resulting forecast model.
SESM
forecast
Forecast
error
Absolute
deviation
November 18 2960 2900
December 19 3200 2921.00
279.00 279.00
2

Chapter 9: Forecasting
3
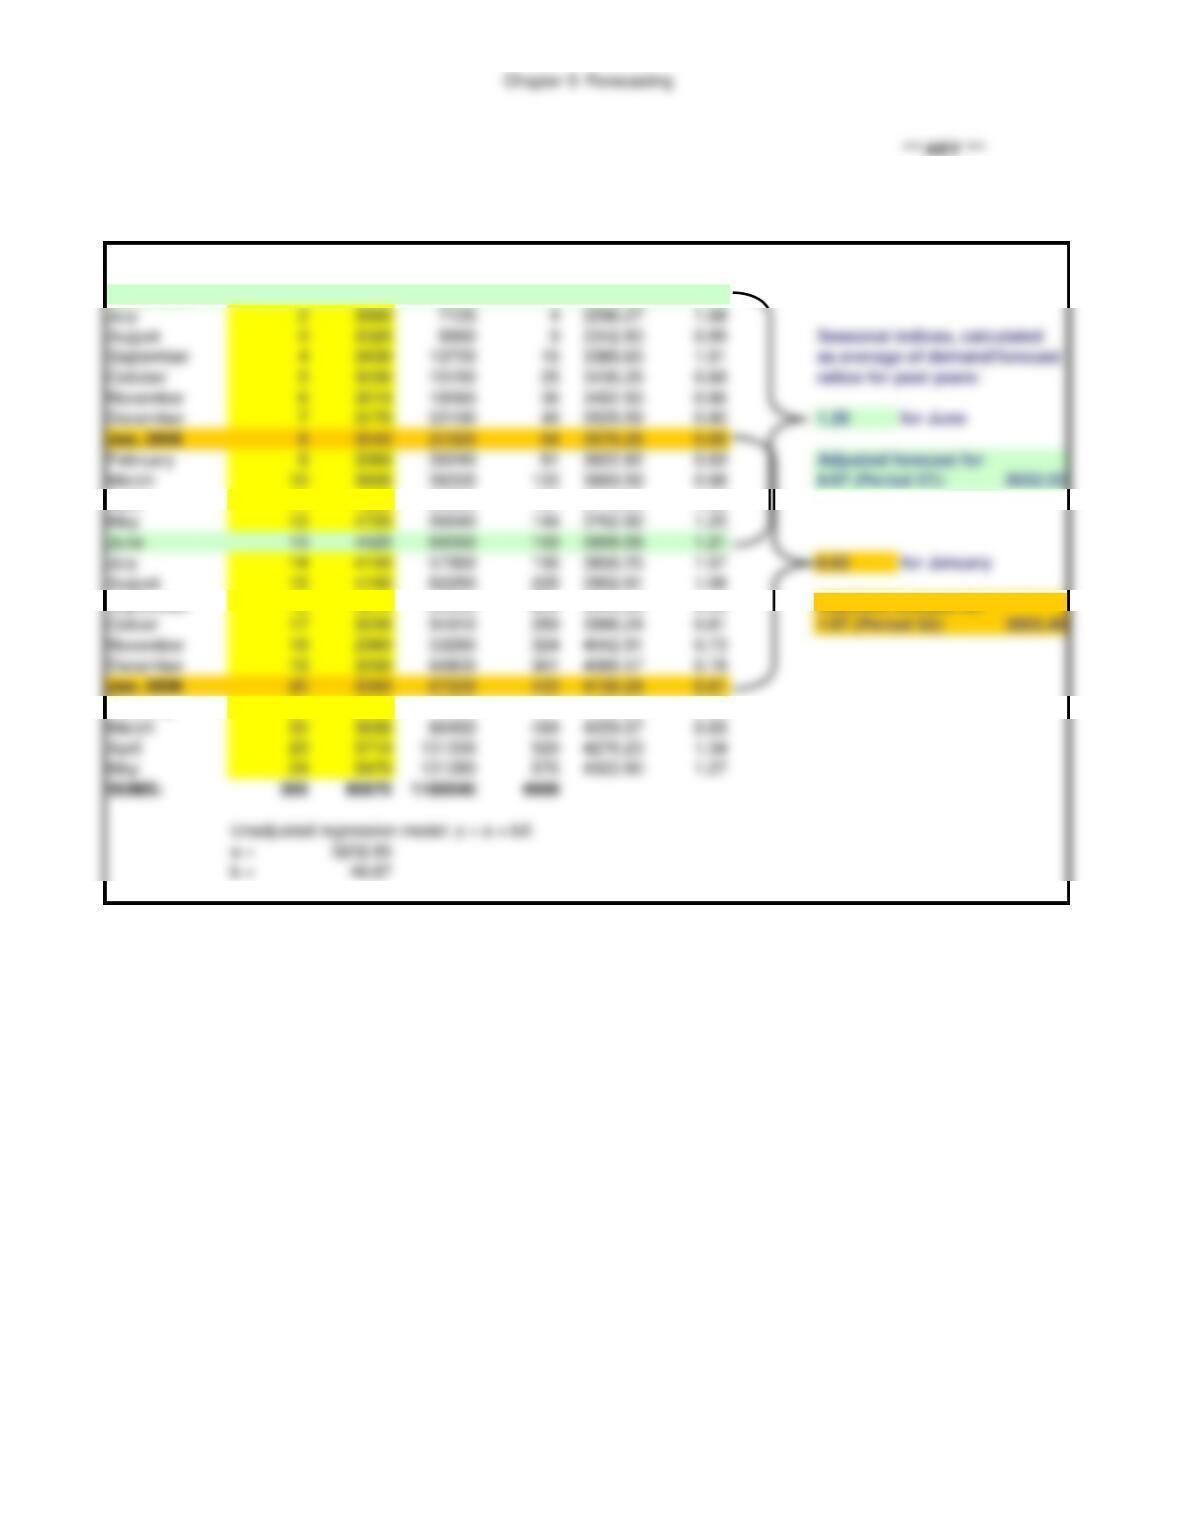
Problem 3 Use regression analysis to develop a forecast model using the two years of data. Develop seasonal indices for
the months of June and January only. Use your model to forecast demand for June, 2016 & January, 2017.
X Y Unadj. Demand /
Period Demand X*Y X^2 regress. Forecast
June, 2004 13880 3880 13249.60 1.19
as average of demand/forecast
Jan. 2005 83040 24320 64 3576.26 0.85
Adjusted forecast for
April 11 4580 50380 121 3716.25 1.23
September 16 3810 60960 256 3949.58 0.96
Adjusted forecast for
Jan. 2006 20 3360 67200 400 4136.24 0.81
February 21 3590 75390 441 4182.90 0.86
4