Process Improvement and Six Sigma 21
3. During one month, Invoco processed 25,000 invoices for Alpha Corp, 23,000 for Beta
Corp, and 8,000 for Gamma Corp. Of these, 205 of the Alpha, 175 of the Beta, and 103 of
the Gamma invoices had to be reprocessed for errors. What is the overall nonconformance
rate and the sigma level for all of the combined batches? For each individual batch?
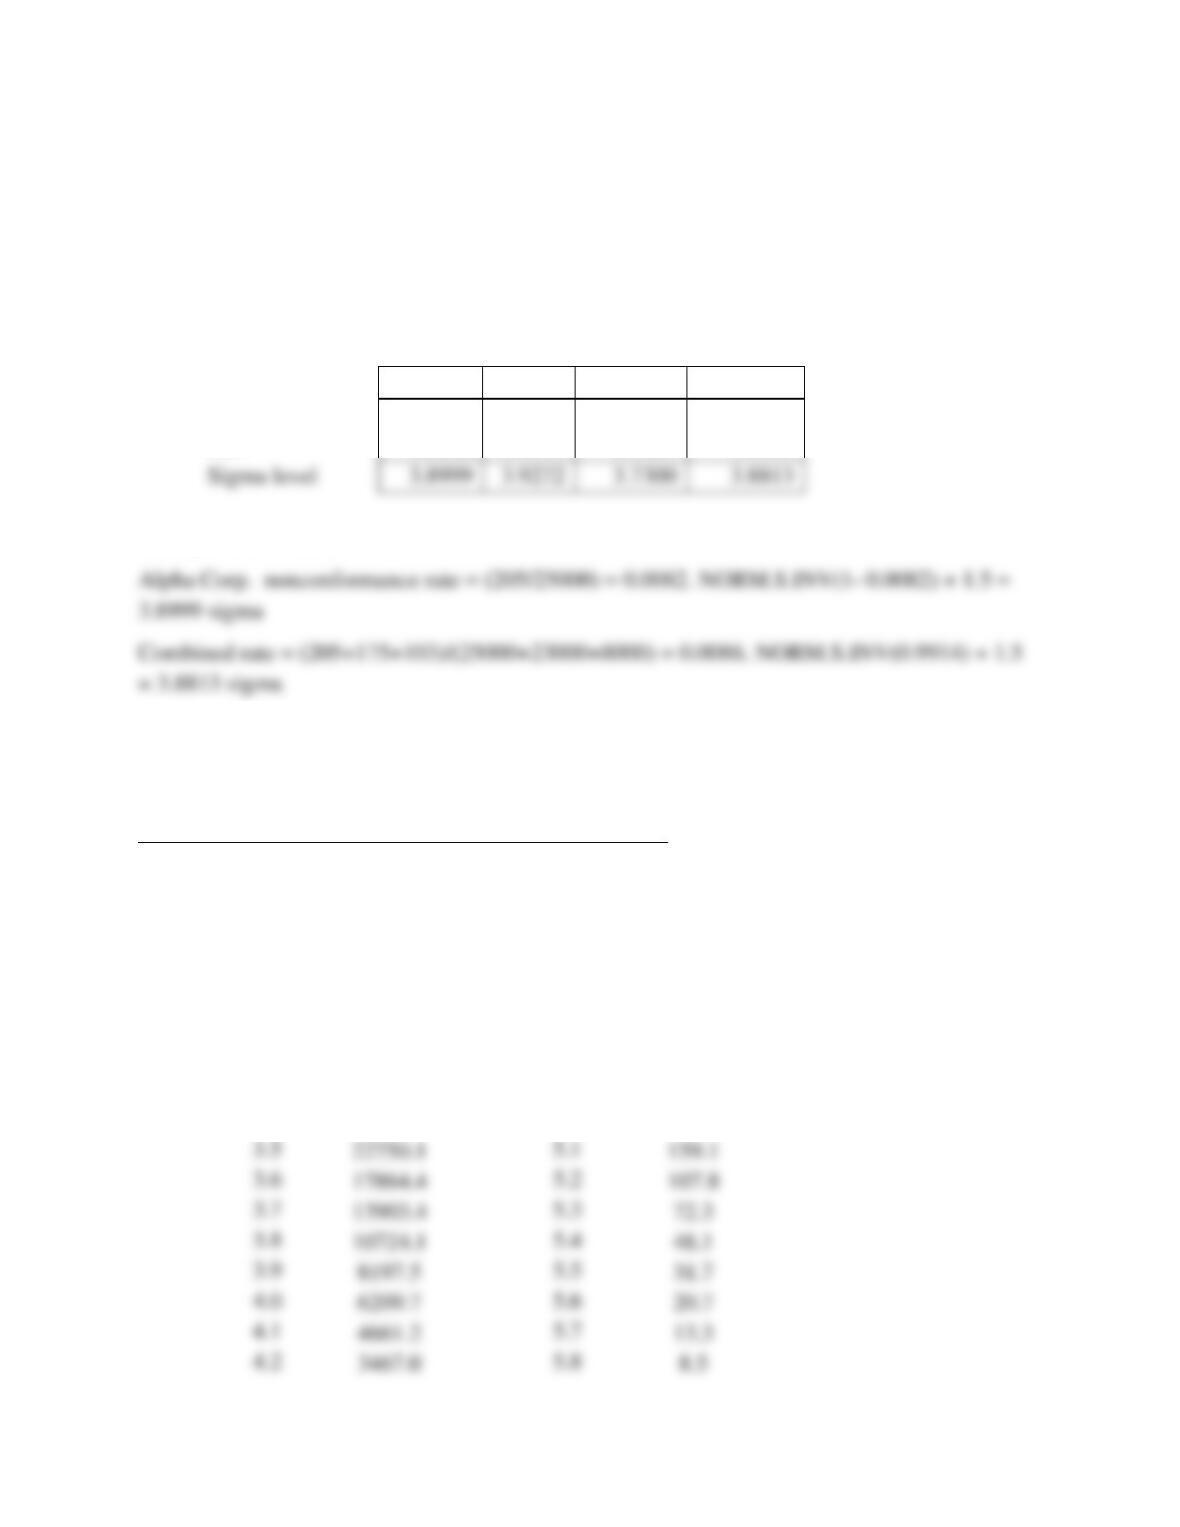
Alpha
Beta
Gamma
Combined
Nonconformance
rate
0.0082
0.0076
0.0129
0.0086
Example calculation:
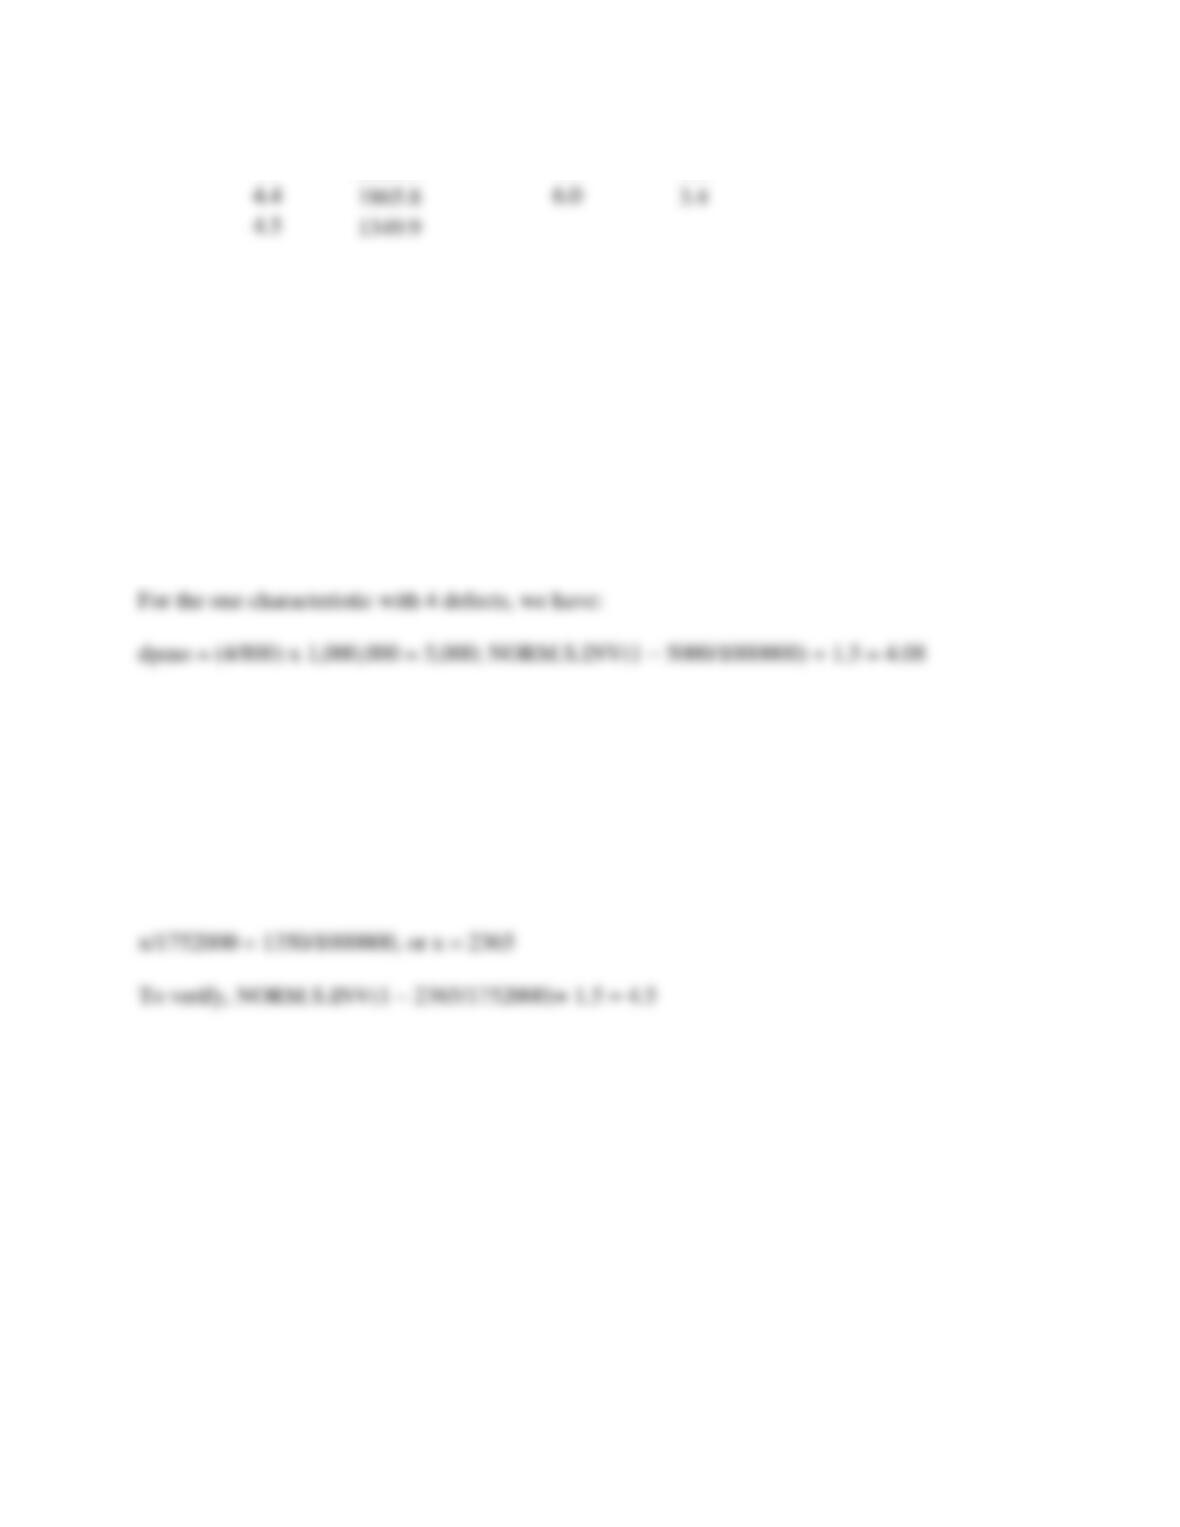
4. Expand Table 9.2 for sigma levels from 3.0 to 6.0 in increments of 0.1 on a spreadsheet.
Construct a chart showing dpmo as a function of the sigma level.
See the Excel file Problem 9.4 in the instructor materials.
Use the formula: dpmo = (1 – NORM.DIST(x, 1.5, 1, TRUE))*1000000, where x is the sigma
level. We get:
Sigma Level
dpmo
Sigma Level
dpmo
3.0
66807.2
4.6
967.6
3.1
54799.3
4.7
687.1
3.2
44565.5
4.8
483.4
3.3
35930.3
4.9
336.9
3.4
28716.6
5.0
232.6
3.5
22750.1
5.1
159.1
3.6
17864.4
5.2
107.8
3.7
13903.4
5.3
3.8
10724.1
5.4
3.9
5.5
4.0
5.6
4.2
5.8
Process Improvement and Six Sigma 22
4.3
2555.1
5.9
5.4
5. NanosElectron manufactures 75,000 circuit boards per month. A random sample of 800
boards is inspected every week for three characteristics. During a recent week, four defects
were found for one characteristic, two defects for another characteristic, and three defects
was found for the third characteristic. If these inspections produced defect counts that were
representative of the population, what is the overall sigma level for this process? What is
the sigma level for the characteristic that showed four defects?
To calculate the overall dpmo and sigma level, we have:
dpmo = [9/(800*3)] x 1,000,000 = 3750; NORM.S.INV(1 – 3750/1000000) + 1.5 = 4.17
6. A company has four machines, each of which produces 200 parts per hour. The
machines run 24 hours/day, 365 days per year. How many defective parts can be made
each year to ensure a sigma level of 4.5?
Number of parts/year produced = 200*24*365 = 1,752,000. Using formula (9.2) we have:
dpmo = (1 – NORM.DIST(4.5, 1.5, 1, TRUE))*1000000 = 1350. If x represents the number of
defective parts that can be made in one year out of 1,752,000, then
7. Verasource Microprocessor Corporation (VMC) sells 2000 specialized computer
processing chips each month at a price of $1,500 each. Variable costs amount to $1,500,000,
and fixed costs are $500,000. Currently the company has a defect rate of 8 percent (which
are chips returned by customers, scrapped by VMC, and replaced). Note that the variable
costs include the cost of producing the defective chips.
a. What is the hidden cost to the company of making this rate of defectives instead of 2000
good chips each month?
b. Suppose a Six Sigma effort can reduce the defects to a six-sigma level (assume for
simplicity that the defective rate is essentially zero). What is the impact on profitability?
a) In order to produce and sell 2,000 good computer chips, VMC must start 2,000/0.92 = 2,174
chips into production. However, since the variable cost of $1,500,000 includes the cost of
4.4
1865.8
6.0
3.4
4.5
1349.9
Process Improvement and Six Sigma 23
making scrap, the unit variable cost is therefore not $1,500,000/ 2,000 = $750 but
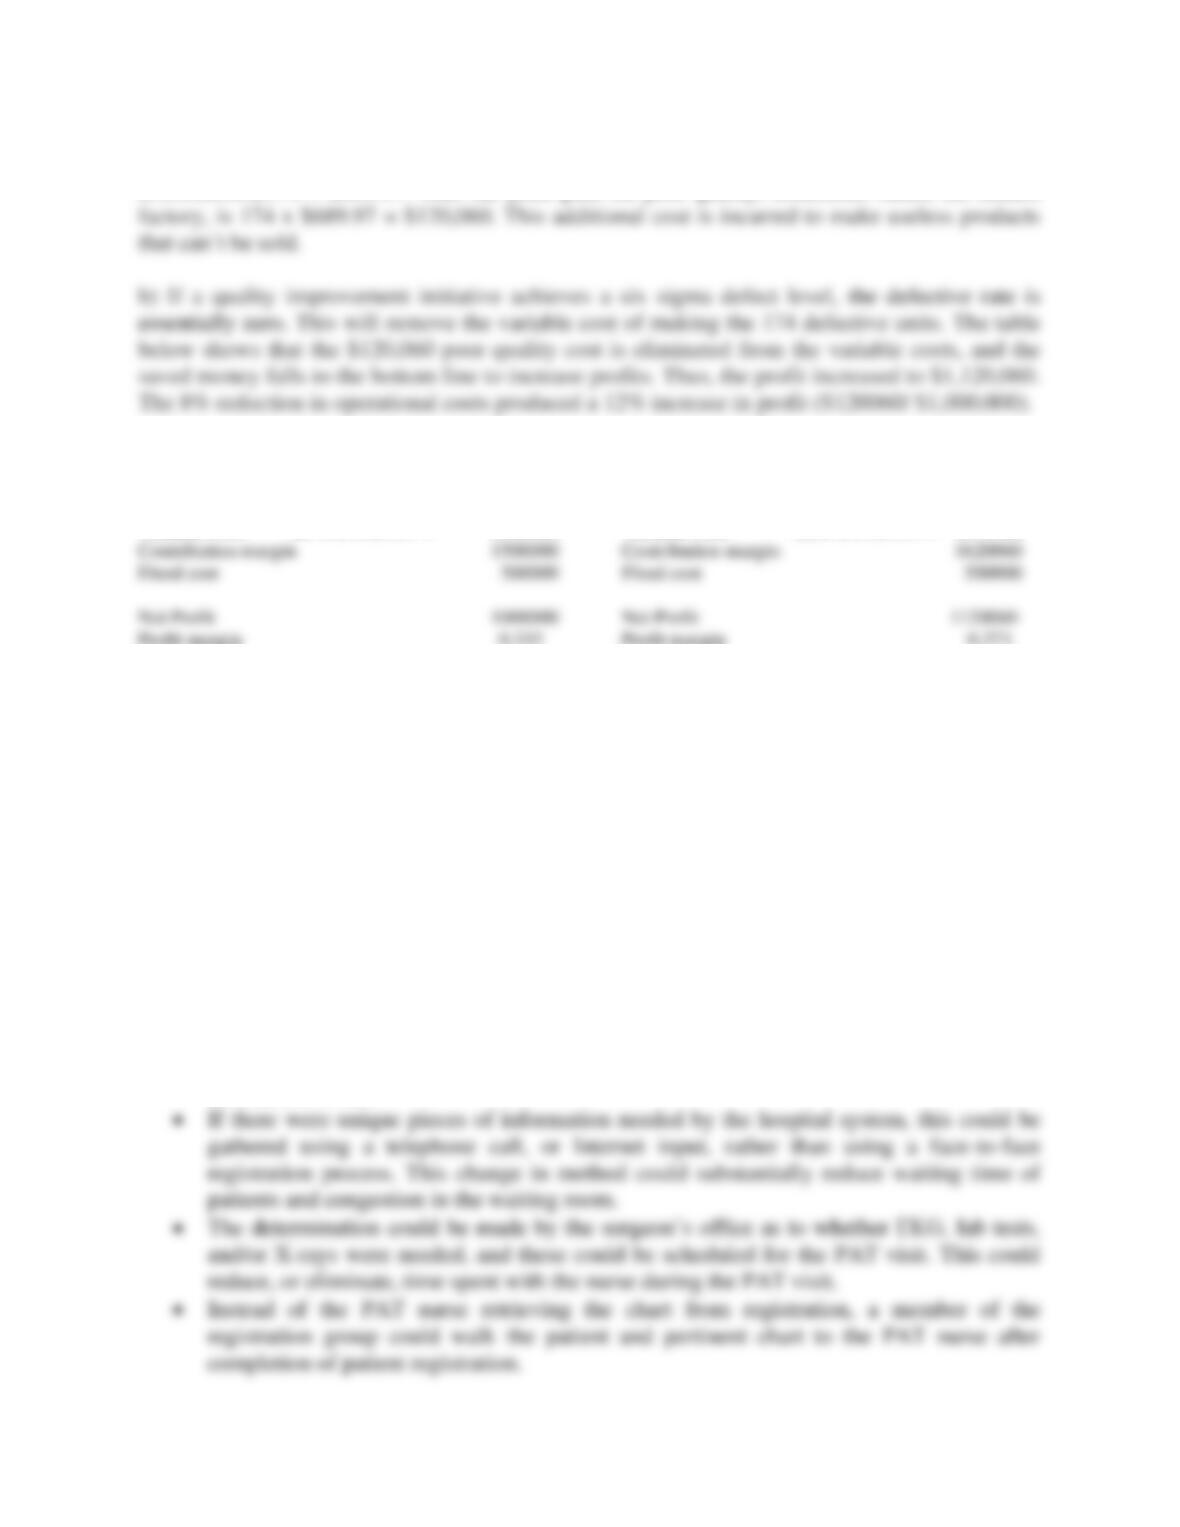
$1,500,000/2,174 = $689.97. Thus the price paid for poor quality, sometimes called the hidden
Monthly Baseline Monthly Six Sigma Results
Sales 2000 x $1500.00 = 3000000 Sales 2000 x $1500.00 = 3000000
Variable Cost 2174 x $ 689.97 = 1500000 Variable Cost 2000 x $ 689.97 = 1379940
Profit margin 0.333 Profit margin 0.373
8. Patients for a hospital pre-admission testing process were experiencing excessive wait
times. A flowchart for the process was developed and is shown in Figure 9.25. Determine
where bottlenecks might be inherent in this process and suggest possible improvements.
According to the article on which this problem is based, the bottlenecks were identified as:
Step 6—Surgeon’s office informing patient of PAT date and surgery information.
Step 8—Patient time in waiting room with beeper.
Step 10—Pre-registration and the collection of patient information or payment.
Step 15—Start of patient assessment.
Steps 18-19—Direction and education regarding laboratory test and X-rays.
Students might suggest others.
Possible improvements to the system might include:
• Automatic entry of patient information from the surgeon’s system into the hospital
system. This would prevent the unnecessary duplication of having to collect the same
information twice.
Process Improvement and Six Sigma 24
9. The current process for fulfilling a room service request at the Luxmark hotel can be
described as follows: After the tray is prepared at the room service station, the server
proceeds to the room, knocks on the door, sets up the meal, has the customer sign the
check, asks if anything else is needed, and then returns to the room service station.
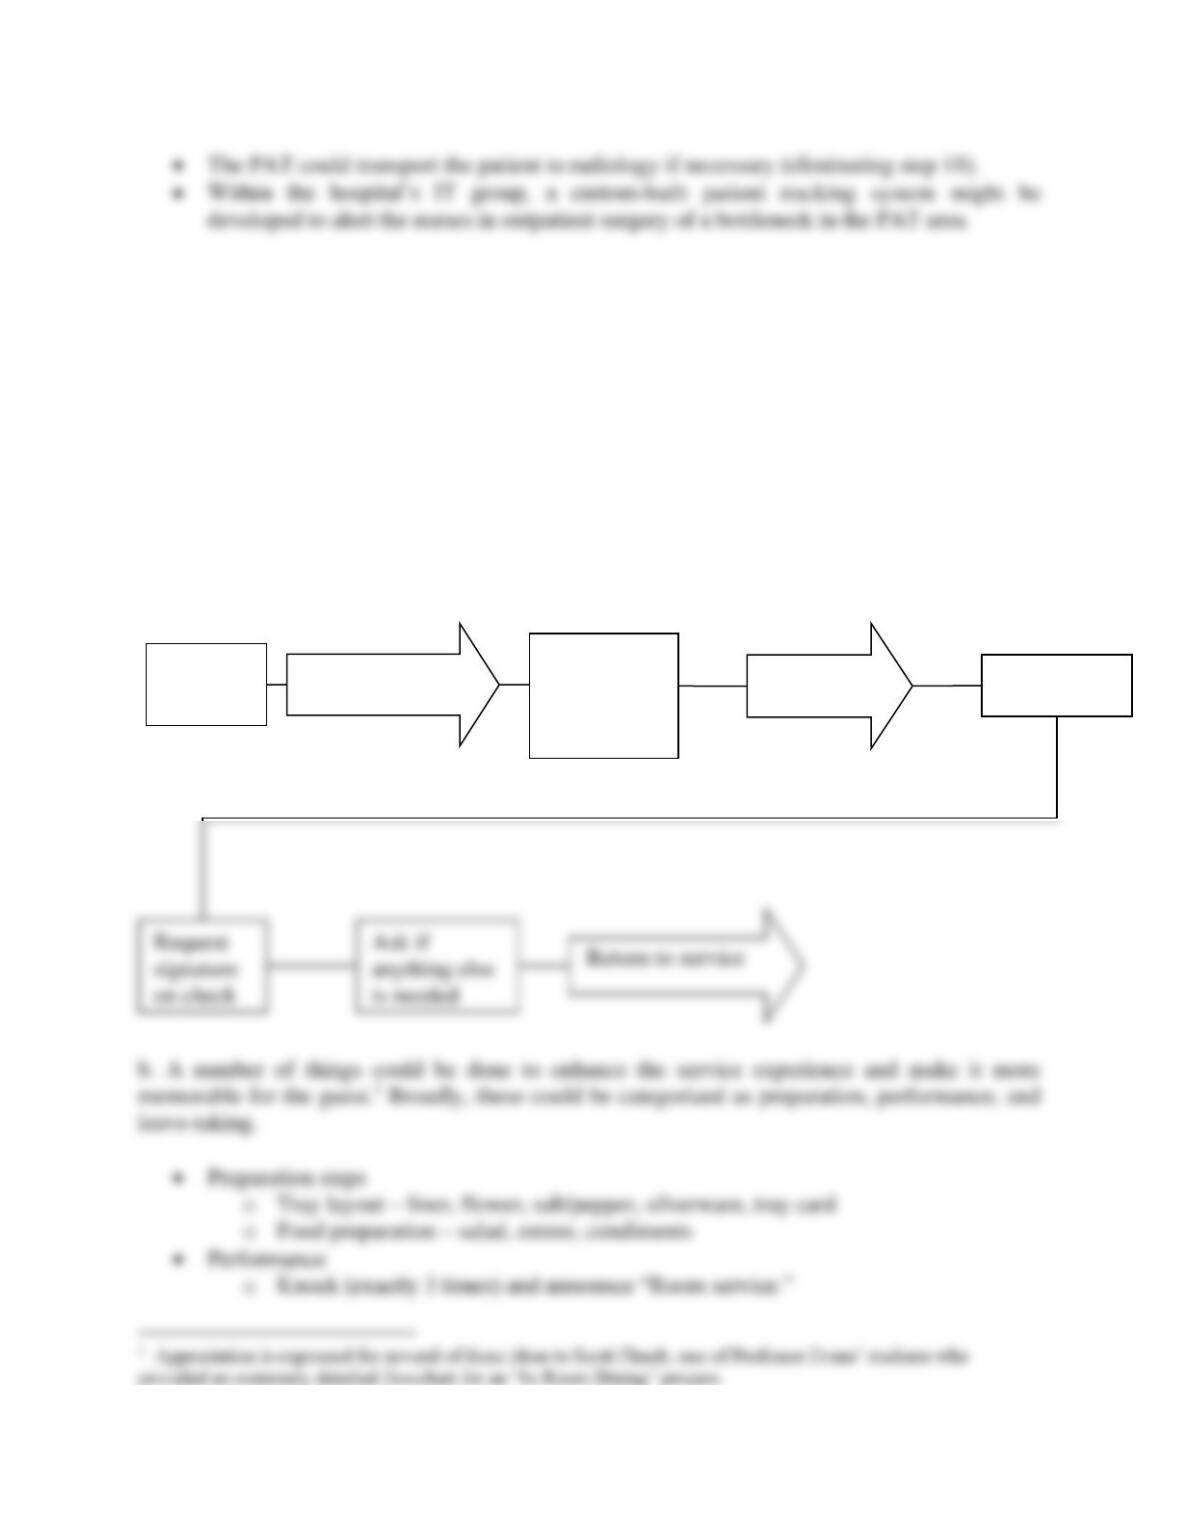
a. Draw a flowchart that describes this process.
b. From the perspective of creating a high level of customer satisfaction from this
experience, what improvements might you suggest to enhance this process? Think
creatively!
a. Flowchart
Prepare
tray
Take tray to room
Knock,
saying
“Room
service”
Enter
Set up meal
Process Improvement and Six Sigma 25
o Warm greeting and self-introduction (use names)
o Permission to enter, enter, place tray, give a “tour” of the meal
10. Placewrite, Inc., an independent outplacement service, helps unemployed executives
find jobs. One of the major activities of the service is preparing resumes. Three word
processors work at the service typing resumes and cover letters. Together they handle
about 120 individual clients. Turnaround time for typing is expected to be 24 hours. The
word-processing operation begins with clients placing work in the assigned word
processor’s bin. When the word processor picks up the work (in batches), it is logged in
using a time clock stamp, and the work is typed and printed. After the batch is completed,
the word processor returns the documents to the clients’ bins, logs in the time delivered,
and picks up new work. A supervisor tries to balance the workload for the three word
processors. Lately, many of the clients have been complaining about errors in their
documents—misspellings, missing lines, wrong formatting, and so on. The supervisor has
told the word processors to be more careful, but the errors still persist.
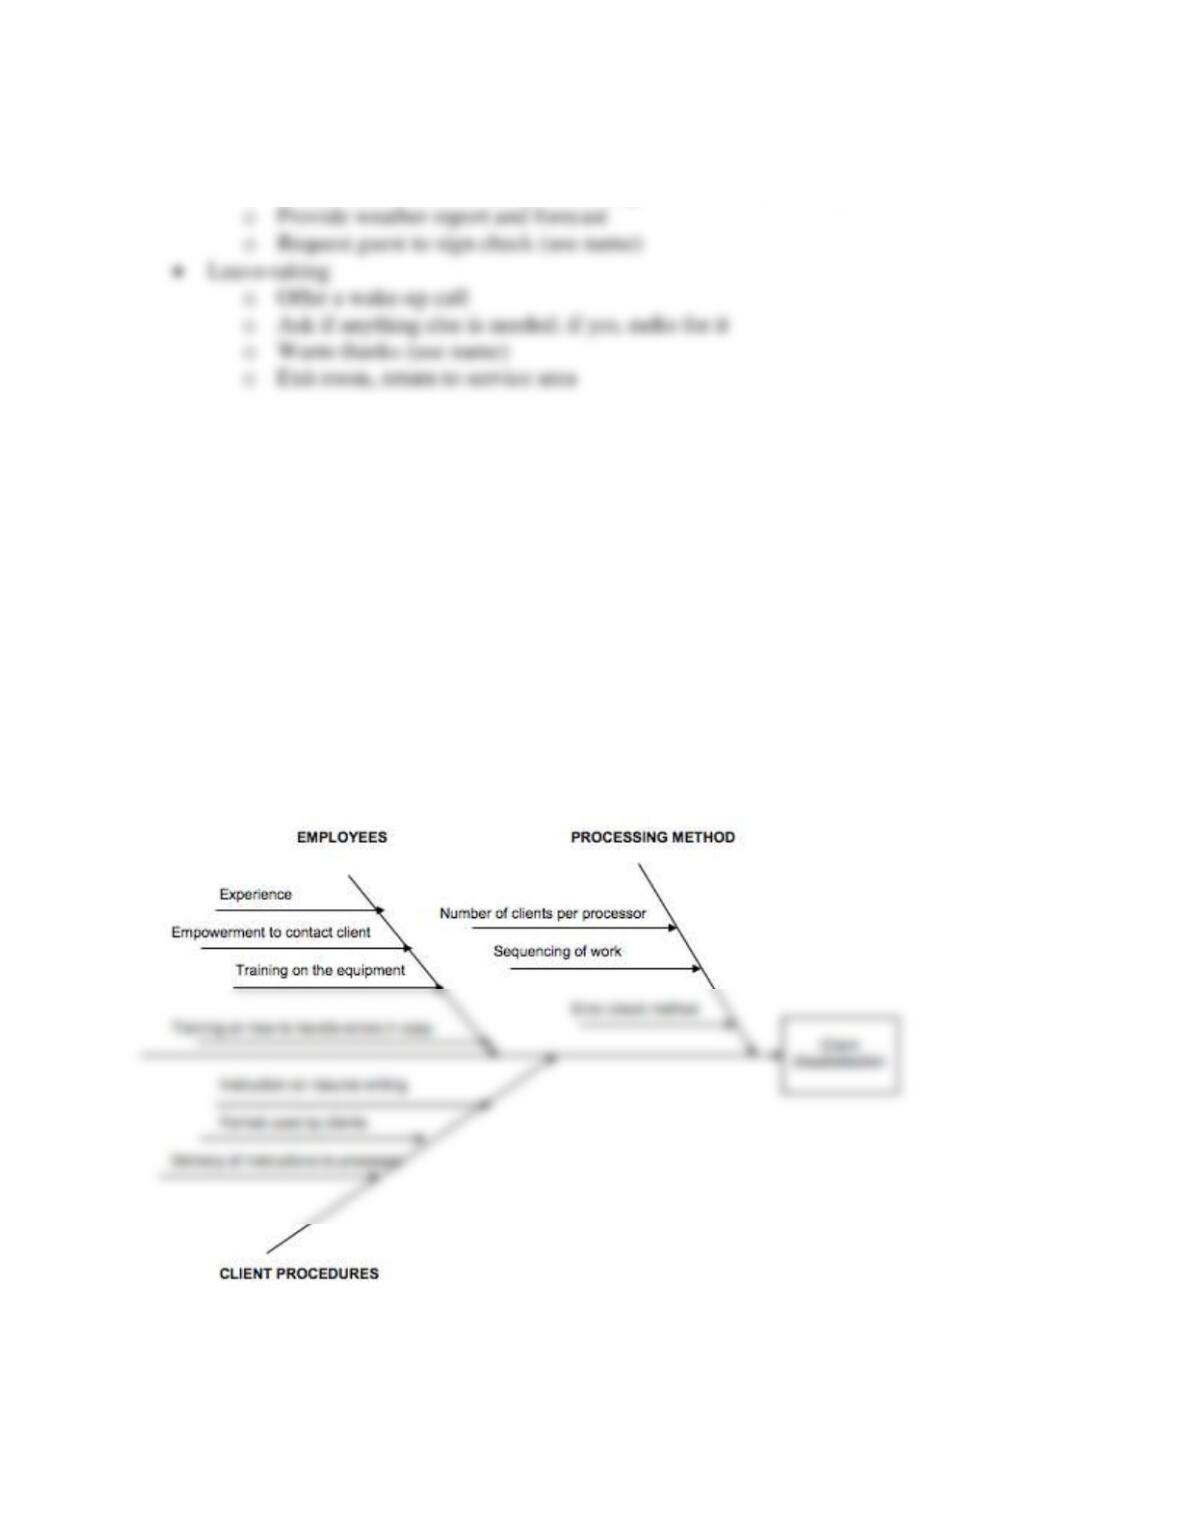
a. Develop a cause-and-effect diagram that might clarify the source of errors.
b. What tools might the supervisor use to study ways to reduce the number of errors?
b. The supervisor might use flowcharts, check sheets and Pareto analysis to classify the types of
defects and their frequencies. Then, training, crosschecking for errors, and work redesign might

Process Improvement and Six Sigma 26
11. A large telecom call center that received over 100,000 calls each day applied Lean Six
Sigma and identified root causes for several inefficiencies that were observed. These were
(1) many agents were slow typists, resulting in long resolution times; (2) non-value-added
activities in call handling, such as long hold times, long greetings after an agent answered,
and agents spending time cross-selling services; (3) agents were required to summarize
reasons for the call in a complex CRM system; (4) many services, such as internet and
billing, required long service times; and (5) new employees took at least 12 months to reach
standard call-handling times. Propose some improvement suggestions that might reduce
these inefficiencies. How might DMAIC be used in this situation? [ENDNOTE: Sami Saif,
“Every Second Counts” Quality Progress, Feb 2016, 24-28.]
Some suggestions:
(1) many agents were slow typists, resulting in long resolution times. Establish minimum
required typing speeds when hiring agents; implement additional training on using shortcut keys,
for example.
(2) non-value-added activities in call handling, such as long hold times, long greetings after an
agent answered, and agents spending time cross-selling services. Incorporate greetings into
12. The maintenance of products such as aircraft engines is part of a complex supply chain.
Distribution centers fulfill orders for spare parts to customers around the world and
typically run on a 24/7 basis. Each day, as many as 4,000 different SKUs are shipped out
and over 1,000 SKUs are received in inventory. It is critical that each order be 100%
accurate. For example, orders that don’t match the shipping list are returned to the
distribution center because of customs regulations.
a. If the distribution center has identified inaccurate shipments as a significant problem,
explain how the DMAIC process might be applied.
b. Develop a logical cause-and-effect diagram for the problem “inaccurate shipment.”
c. Think about how a process for fulfilling orders might work and create a process map
(you might want to refer back to process design concepts in Chapter 7).
a. To address the problem of inaccurate shipments, the DMAIC process may be used to plan and
carry out a Six Sigma improvement project:
Process Improvement and Six Sigma 27
13. An order fulfillment process at M. Smith & Sons’ distribution center begins by printing
an order label, placing it on a box, placing the box on a conveyor, scanning the label,
removing the box from the conveyor, finding the item in the warehouse, placing it in the
box, and then putting the box back on the conveyor for sealing and shipping. Several types
of errors have been identified:
• Wrong carton. Occasionally, a label will be placed on the wrong box. This is
typically recognized when all of the items don’t fit into the box.
• Damaged item. This can occur when employees move or drop the boxes, which can
range from 1 to 50 pounds, from pallet to pallet for replenishment, or during the
picking process.
• Missing item. This can occur if an employee confirms that item has been picked
without placing it in the box or if the product is out of stock.
• Poor Packing. This happens when an employee does not take the effort to ensure
that the contents of the box are neatly arranged with proper packing material.
• Duplicate items. This can happen because employees will not confirm their picks and
another employee will pick the same items and confirm them.
Identify opportunities for improving this process.
Training can alleviate many of these issues. The company could have regularly scheduled
meetings with employees to emphasize the importance of following standard operating
14. A catalog order-filling process at Cats Catalog Company for personalized printed
products for pet owners can be described as follows: Telephone orders are taken over a 12-
hour period each day. Orders are collected from each person at the end of the day and
checked for errors by the supervisor of the phone department, usually the following
morning. The supervisor does not send each one-day batch of orders to the data processing
department until after 1:00 p.m. In the next step—data processing—orders are invoiced in
the one-day batches. Then they are printed and matched back to the original orders. At

Process Improvement and Six Sigma 28
this point, if the order is from a new customer, it is sent to the person who did the customer
verification and setup of new customer accounts. This process must be completed before
the order can be invoiced. The next step—order verification and proofreading—occurs
after invoicing is completed. The orders, with invoices attached, are given to a person who
verifies that all required information is present and correct to permit typesetting. If the
verifier has any questions, they are checked by computer or by calling the customer.
Finally, the completed orders are sent to the typesetting department of the print shop.
a. Develop a flowchart for this process.
b. Identify opportunities for improving the quality of service in this situation.
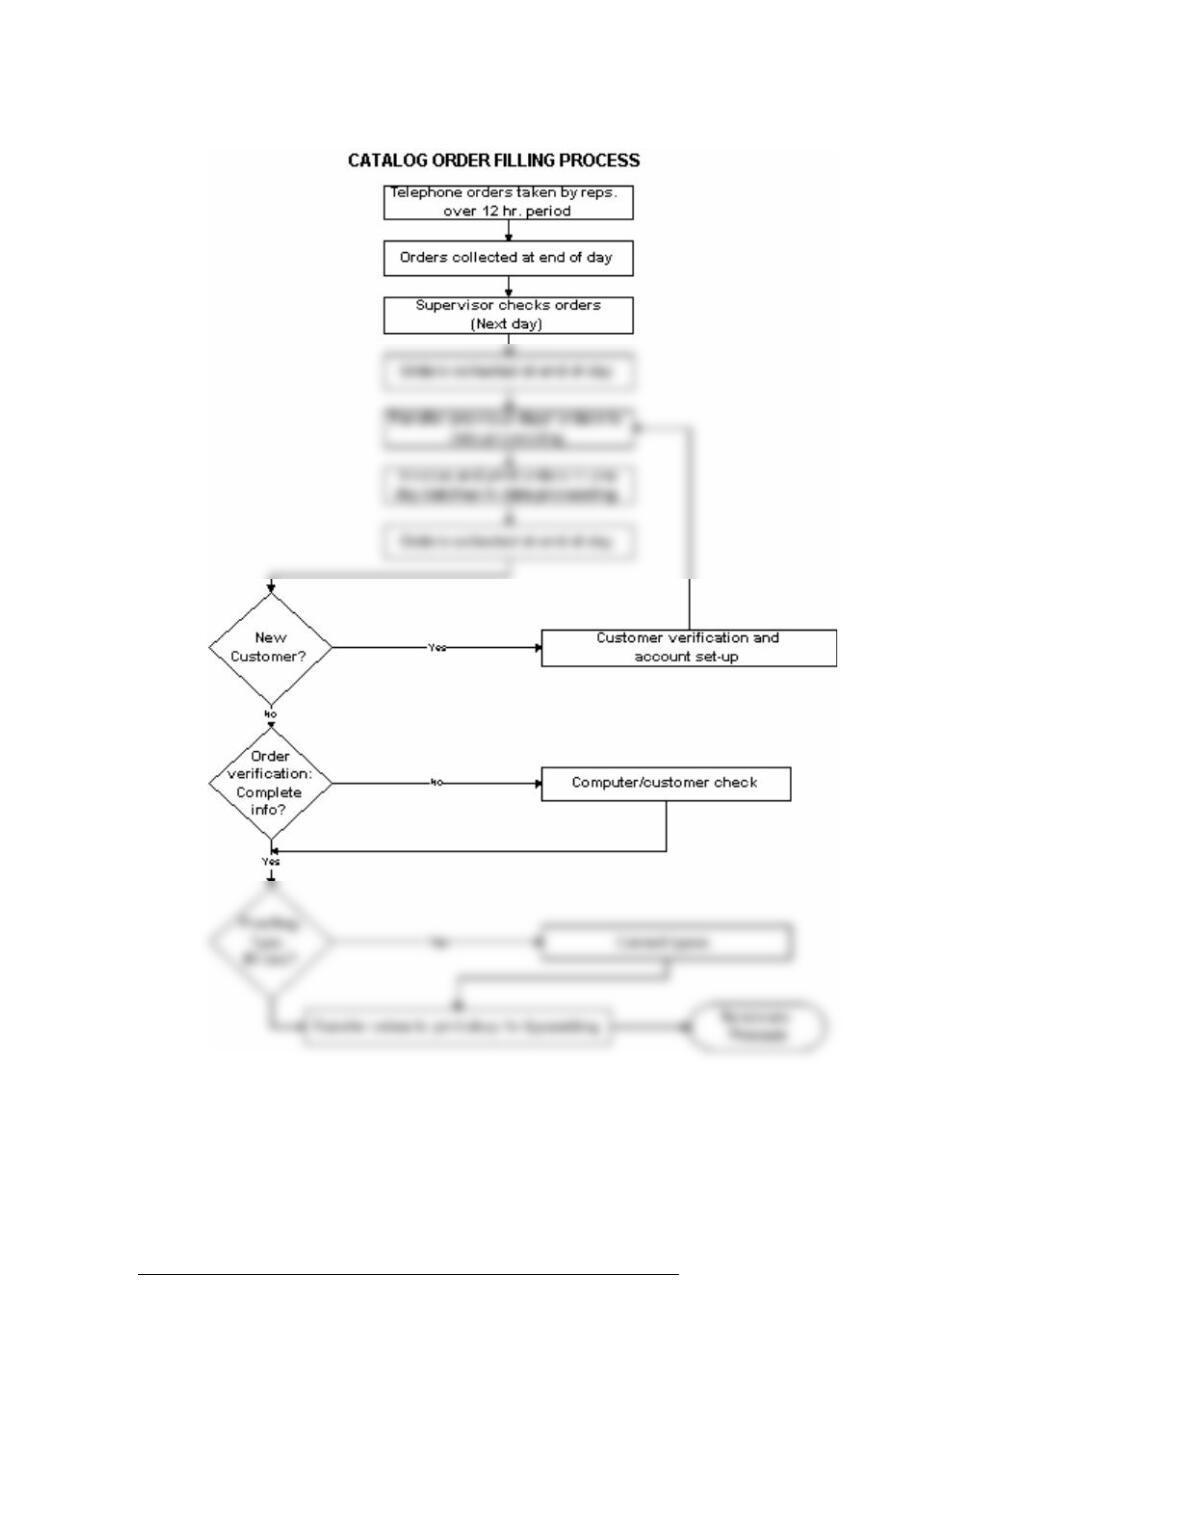
See flowchart below for the summary of the process. The most serious problem from the
standpoint of customer service is the potential for a 12-hour delay before an order reaches the
supervisor for error checking, and another 3-4 hours may be required before entry into the
Process Improvement and Six Sigma 29
15. A Six Sigma analyst in Lakerio United Bank suspected that errors in counting and
manually strapping cash into bundles were related to the number of weeks that employees
had been employed on that job. Data collected are available in the C09 Problem Data
workbook. What tool would you use to analyze these data? What do you conclude from
your analysis?
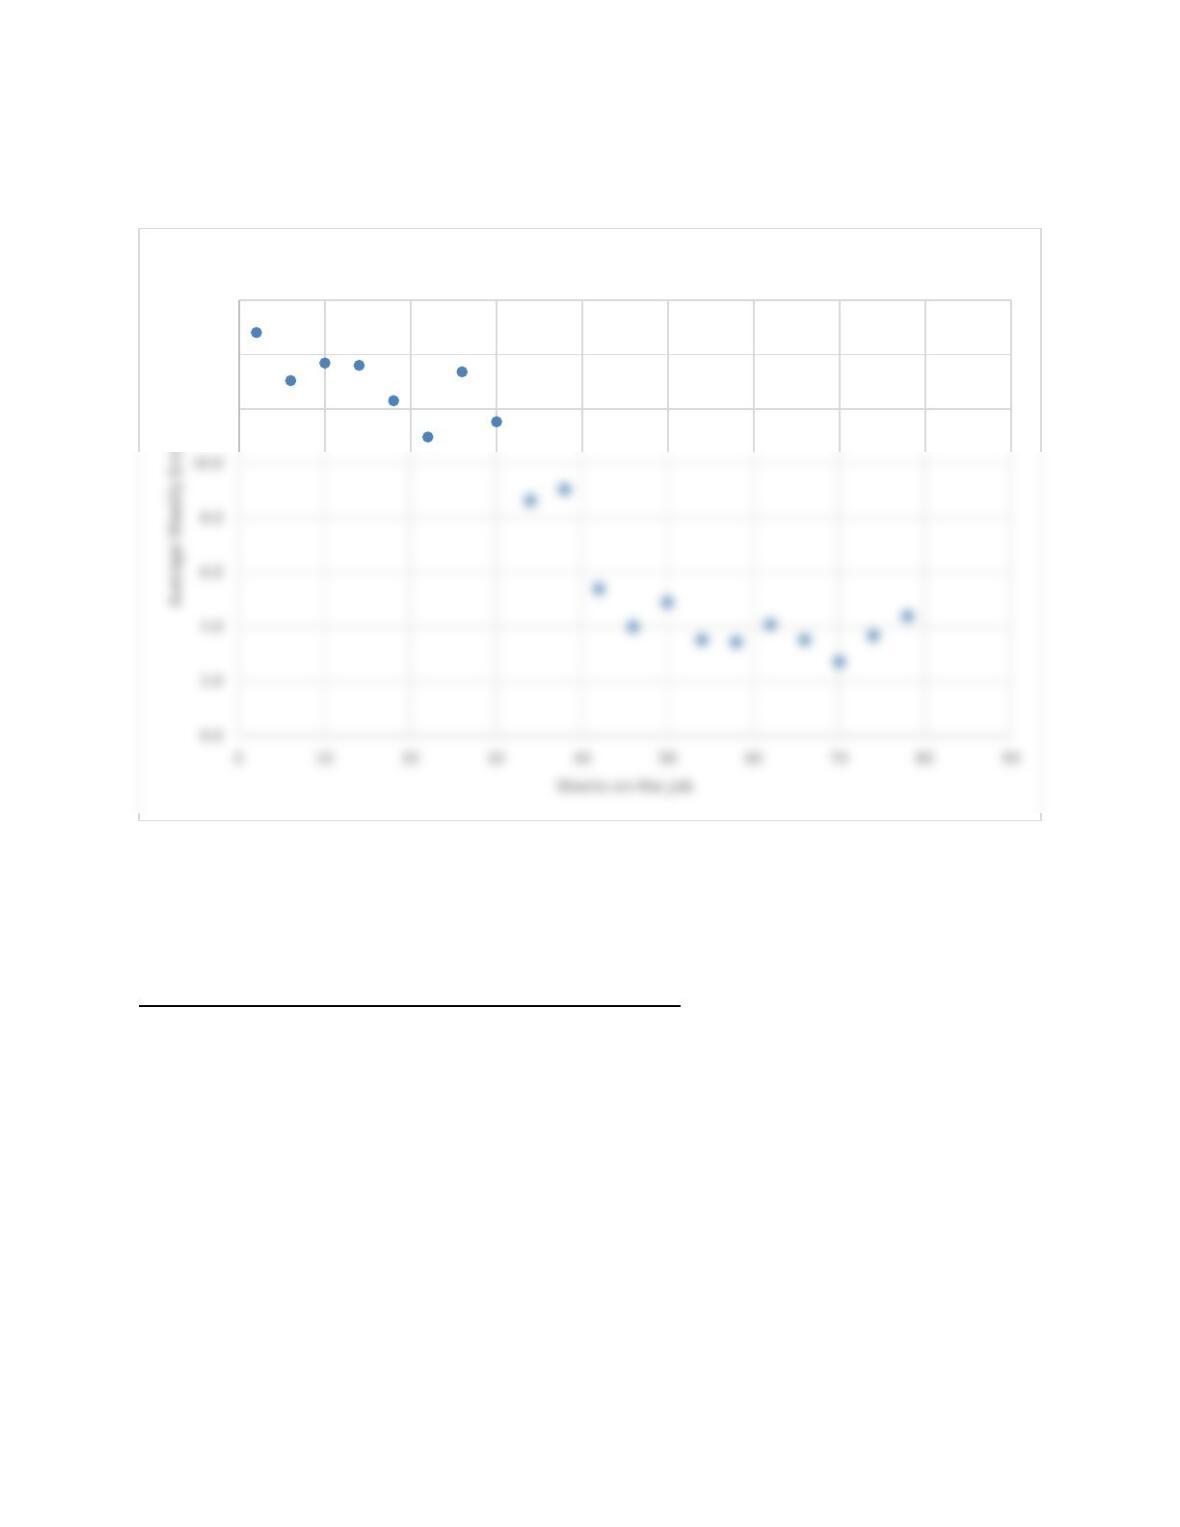
See the Excel file Problem 9.15 in the instructor materials.
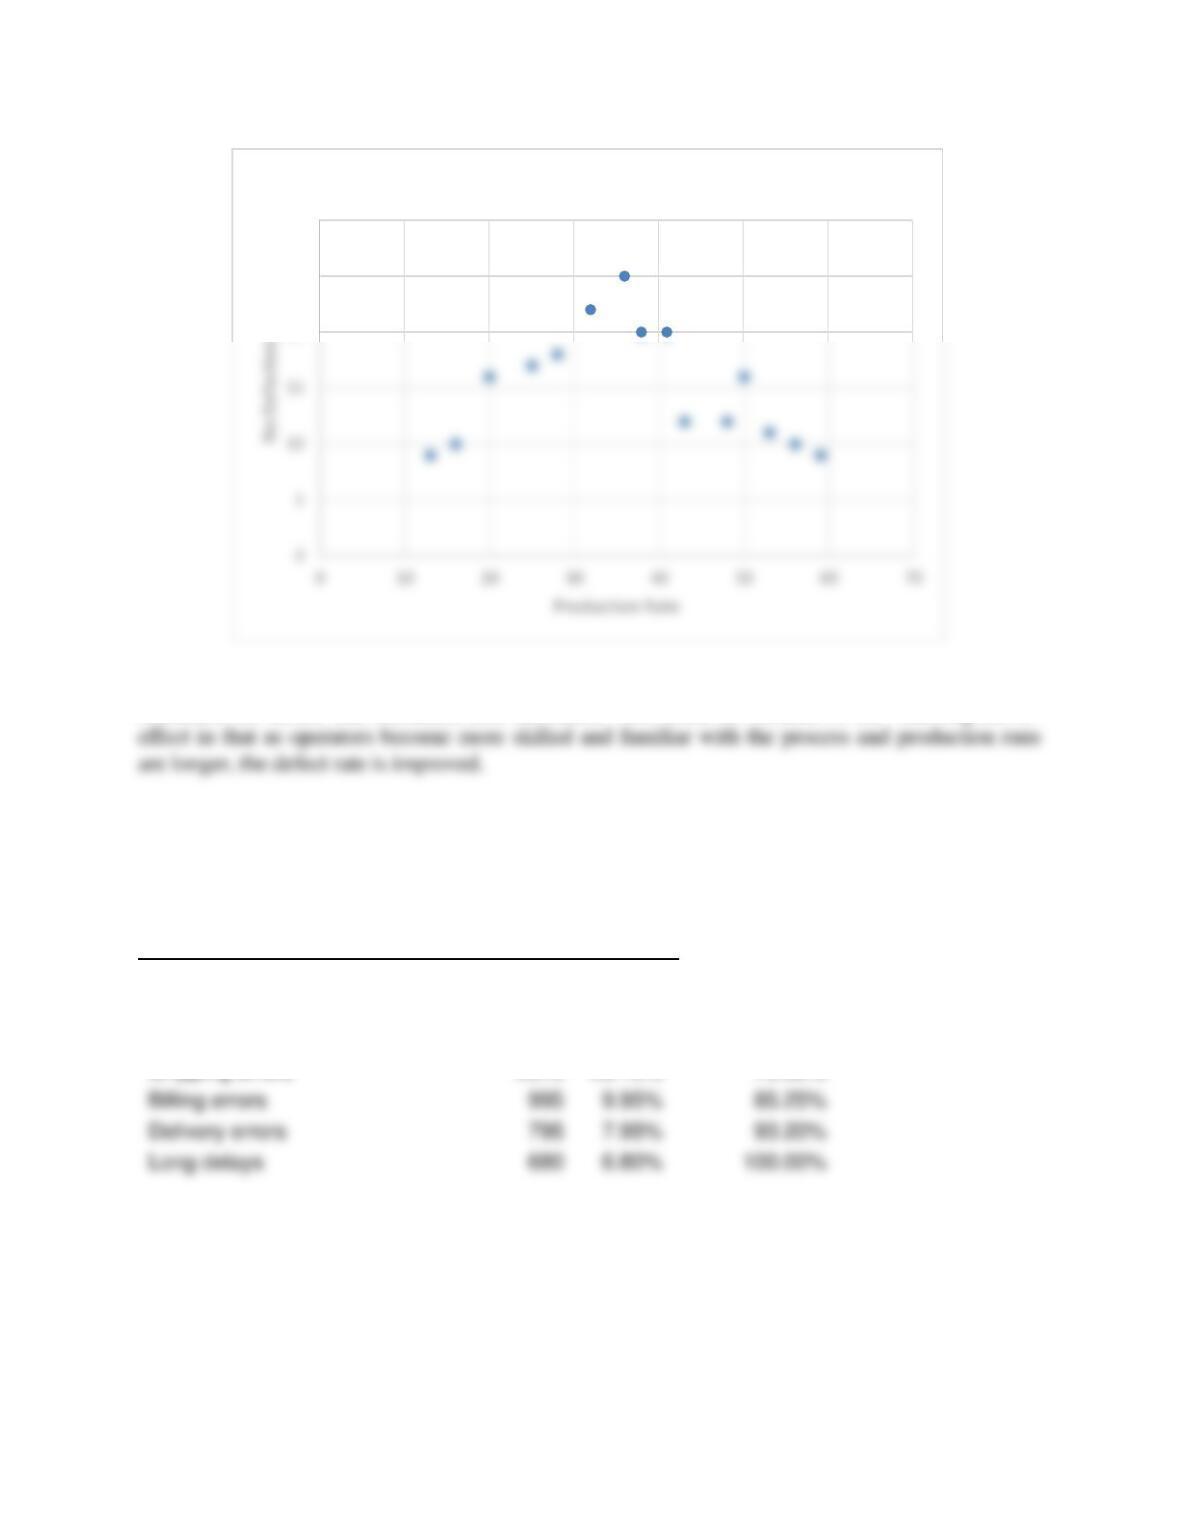
A scatter diagram is appropriate. It shows that the employees’ accuracy improves continuously
during the first 50 weeks on the job, but then levels off and appears to become a stable system.
Process Improvement and Six Sigma 30
This may be a result of training and experience. However, management should investigate how
to eliminate the errors that still occur after 50 weeks.
16. The times required for 50 trainees in an electronics course at ElecktronTech to
assemble a component used in a computer were measured. These are provided in the C09
Problem Data workbook. Construct a histogram of the data. What recommendations for
improvement would you give the course instructor?
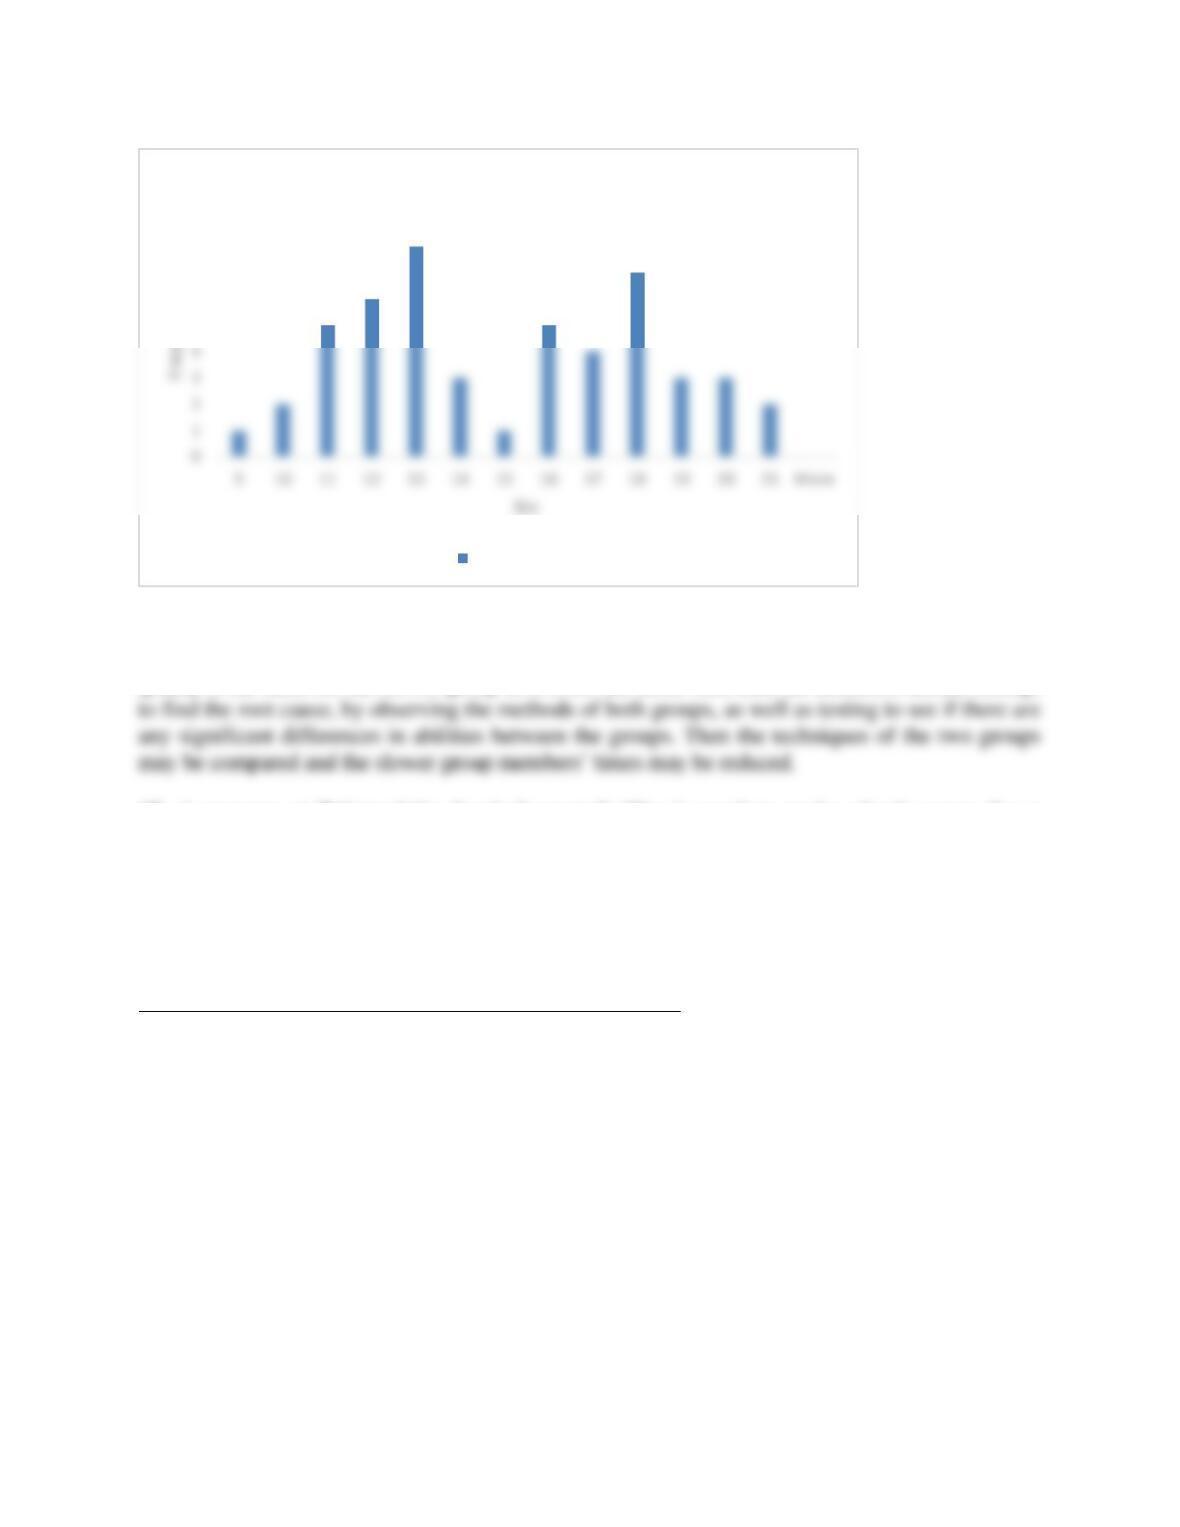
See the Excel file Problem 9.16 in the instructor materials.
12.0
14.0
16.0
Average Weekly Errors
Process Improvement and Six Sigma 31
The histogram appears to have a bi-modal distribution, indicating that the data might come from
different distributions. A group of students takes a longer time than the others. If the assembly
quality is the same for the slower group as it is for the faster one, then the instructor should attempt
17. A process at Printwright, Inc.’s largest facility is used to make plastic gears for a
computer printer. They have been receiving numerous complaints that the gears are
jamming. The data provided in the C09 Problem Data workbook were gathered by a
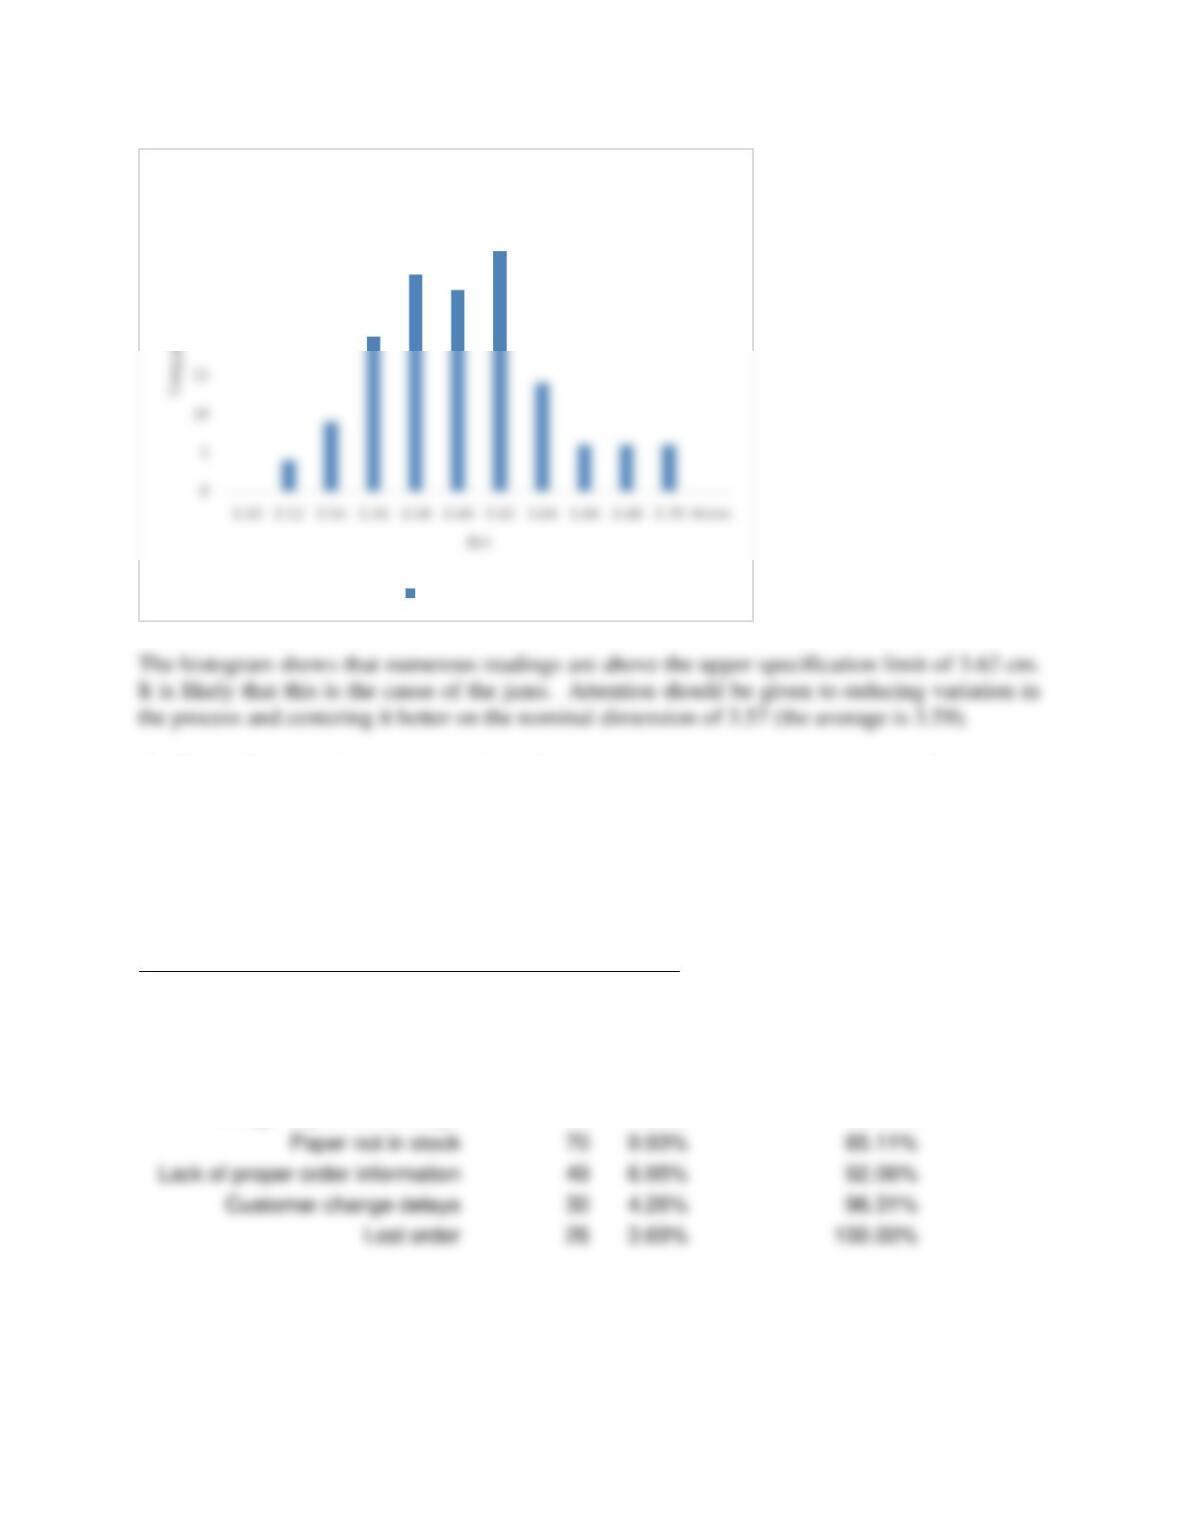
quality analyst. The gears were designed to be 3.57 ± 0.05 centimeters (cm) in diameter.
Construct a histogram of the data and use it to propose the problem that is causing the
jams.
See the Excel file Problem 9.17 in the instructor materials.
5
6
7
8
9
Histogram
Frequency
Process Improvement and Six Sigma 32
18. Deuce Printing Company realized that they were losing customers and orders due to
various delays and errors. In order to get to the root cause of the problem, they decided to
track problems that might be contributing to customer dissatisfaction. The list of the errors
provided in the C09 Problem Data workbook shows their frequencies of occurrence over a
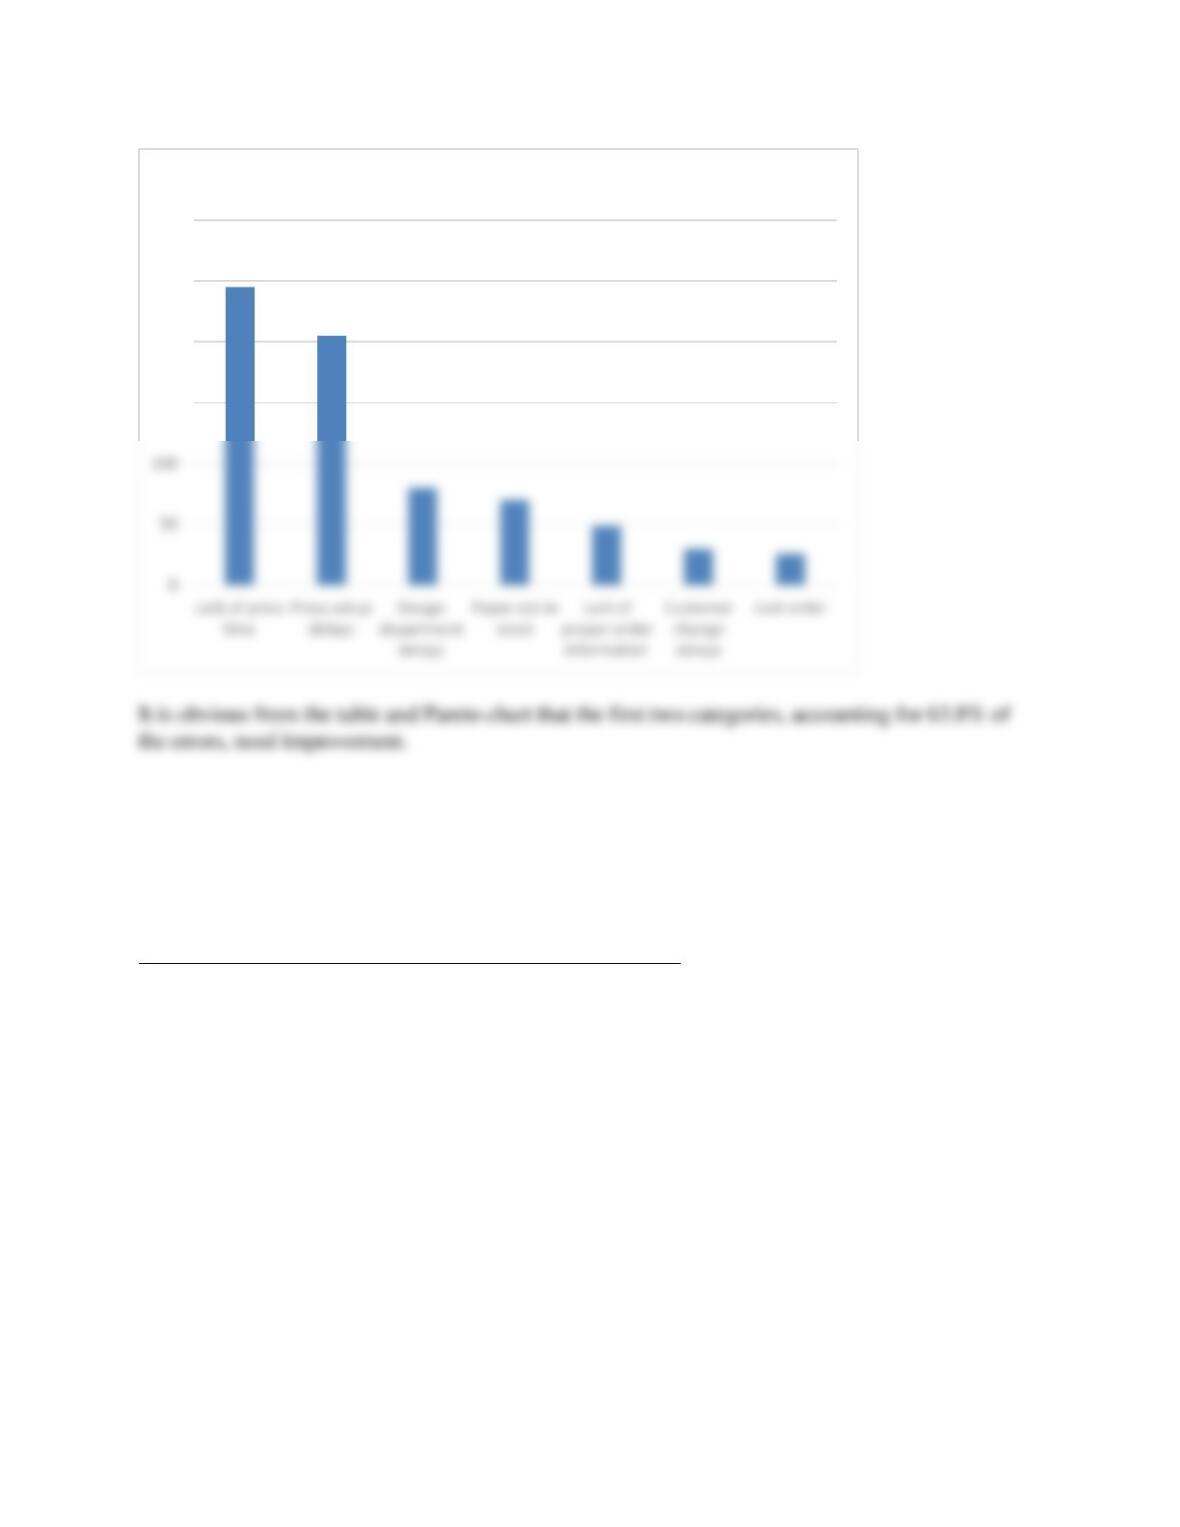
six-month period. Use the appropriate technique to analyze the errors. What
recommendations could you make to reduce errors and increase customer satisfaction?
See the Excel file Problem 9.18 in the instructor materials.
Error/Delay Cause
Frequency
Percent
Cumulative Percent
Lack of press time
245
34.75%
34.75%
Press setup delays
205
29.08%
63.83%
Design department delays
80
11.35%
75.18%
85.11%
49
92.06%
30
96.31%
20
25
30
35
Histogram
Frequency
Process Improvement and Six Sigma 33
19. In a DeltaWidgets, Inc. process, the production rate (parts/hour) was thought to affect
the number of defectives found during a subsequent inspection. To test this theory, the
production rate was varied and the numbers of defects were collected for the same batch
sizes. The results can be found in the C09 Problem Data workbook. Use the most
appropriate tool to analyze these data. What conclusions can you reach?
See the Excel file Problem 9.19 in the instructor materials.
150
200
250
300
Pareto Chart
Process Improvement and Six Sigma 34
The scatter diagram shows an interesting, and counter-intuitive result. As the production rate
increases, the defect rate increases, then decreases. This could be because of the “learning curve”
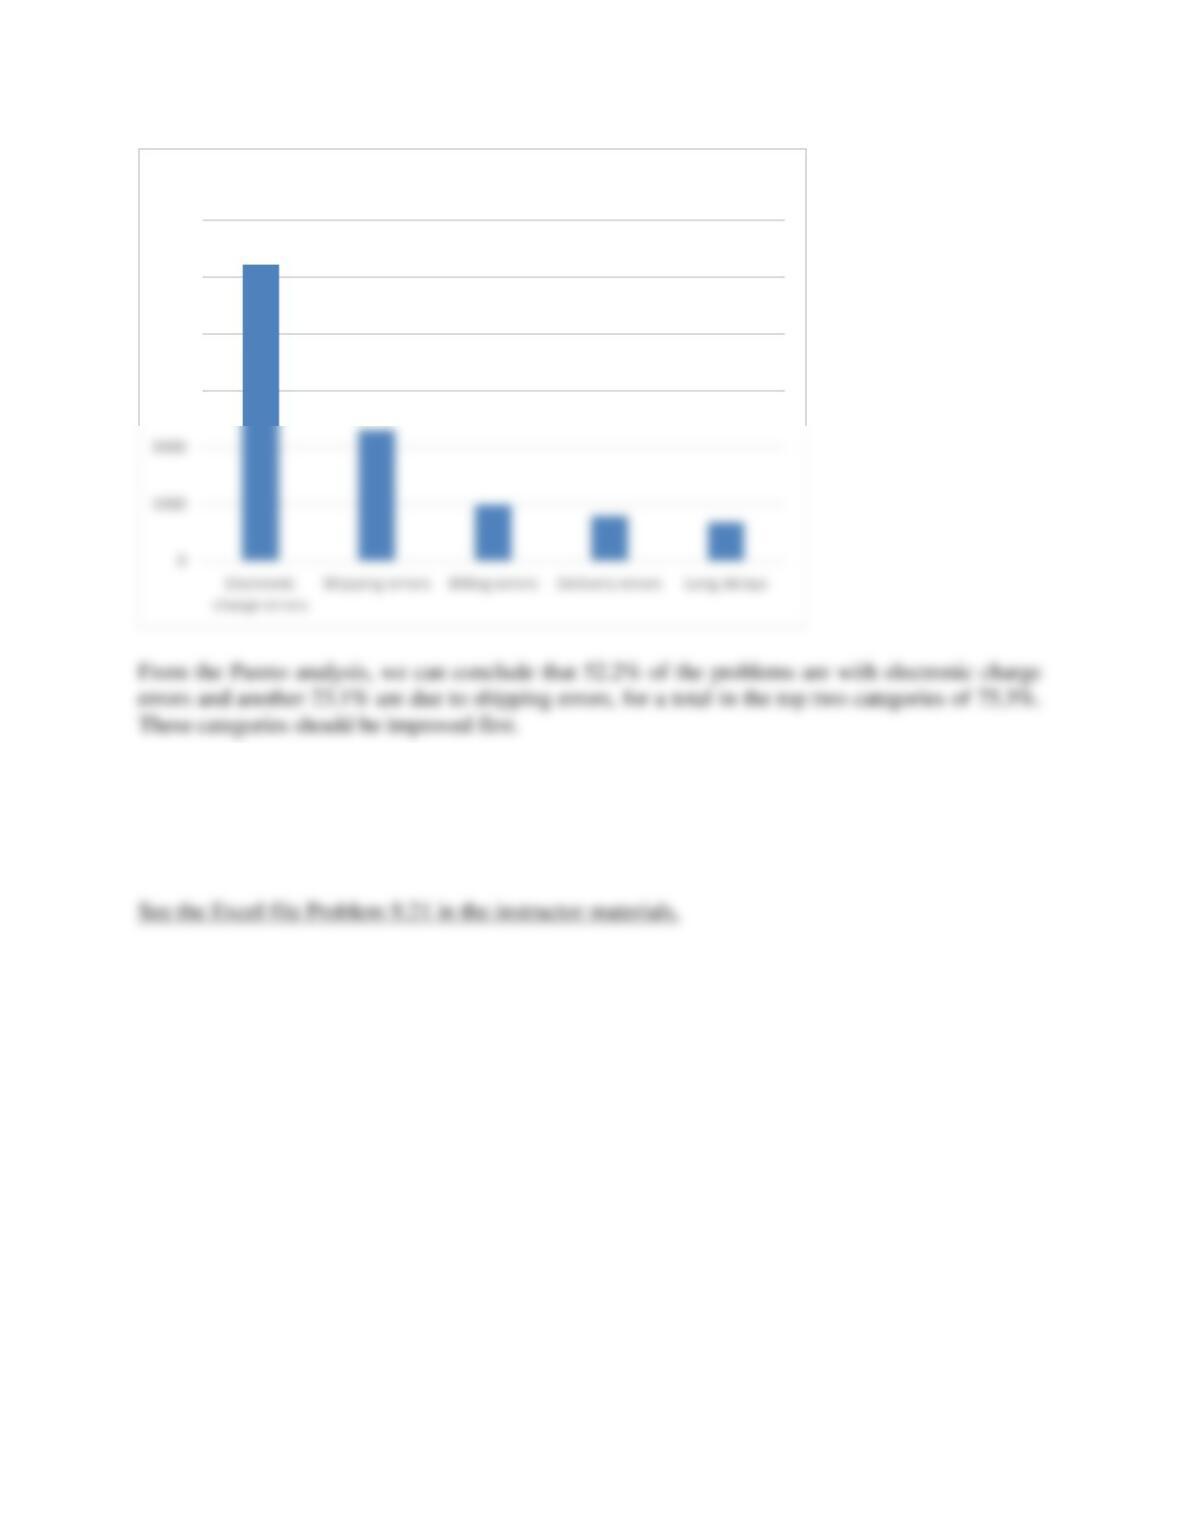
20. Analysis of customer complaints at the Lauren Elizabeth Apparel Company revealed
errors in five categories, such as billing, shipping, etc. Data can be found in the C09
Problem Data workbook. Use the appropriate tool to analyze the data and determine the
next step in the improvement process.
See the Excel file Problem 9.20 in the instructor materials.
Error
Frequency
Percent
Cumulative %
Electronic charge errors
5220
52.20%
52.20%
Shipping errors
2310
23.10%
75.30%
Billing errors
85.25%
Delivery errors
93.20%
Long delays
20
25
30
Scatter Chart
Process Improvement and Six Sigma 35
21. Santucci’s Restaurant suspects that customer wait time is related to its customer
satisfaction ratings on surveys customers receive with their bill. It has data for 25
customers, available in the C09 Problem Data workbook. Use the appropriate tool to
analyze these data. What do your results indicate?
3000
4000
5000
6000
Pareto Chart