
Case: The PIVOT Initiative at Midwest Bank – Part II
1
This case is a continuation of PIVOT Initiative at Midwest Bank in Chapter 7. You
should review that case for background on the project and a description of the Define
stage of the DMAIC approach. In this case, the focus is on the remaining steps—
Measure, Analyze, Improve, and Control.
The Measure stage demanded an intense data collection effort by the PIVOT
team. They used a tool called an XY matrix (see example in Table 1), designed to rank
factors for potential error causes (Xs) and for customer outputs (Ys). The team gathered
data and studied departmental process flows, seeking to find root causes of the problem,
For CPD, the principal customer outputs selected were risk mitigation, error
reduction, and reducing dollar loss, which were then stratified against potential error
causes. The matrix was then used to calculate an overall ranking to guide the team toward
the most probable causes of errors. After deciding to focus on the top seven potential
causes, the CPD department’s staff began the task of gathering data for each of them to
verify their impact on errors in the process.
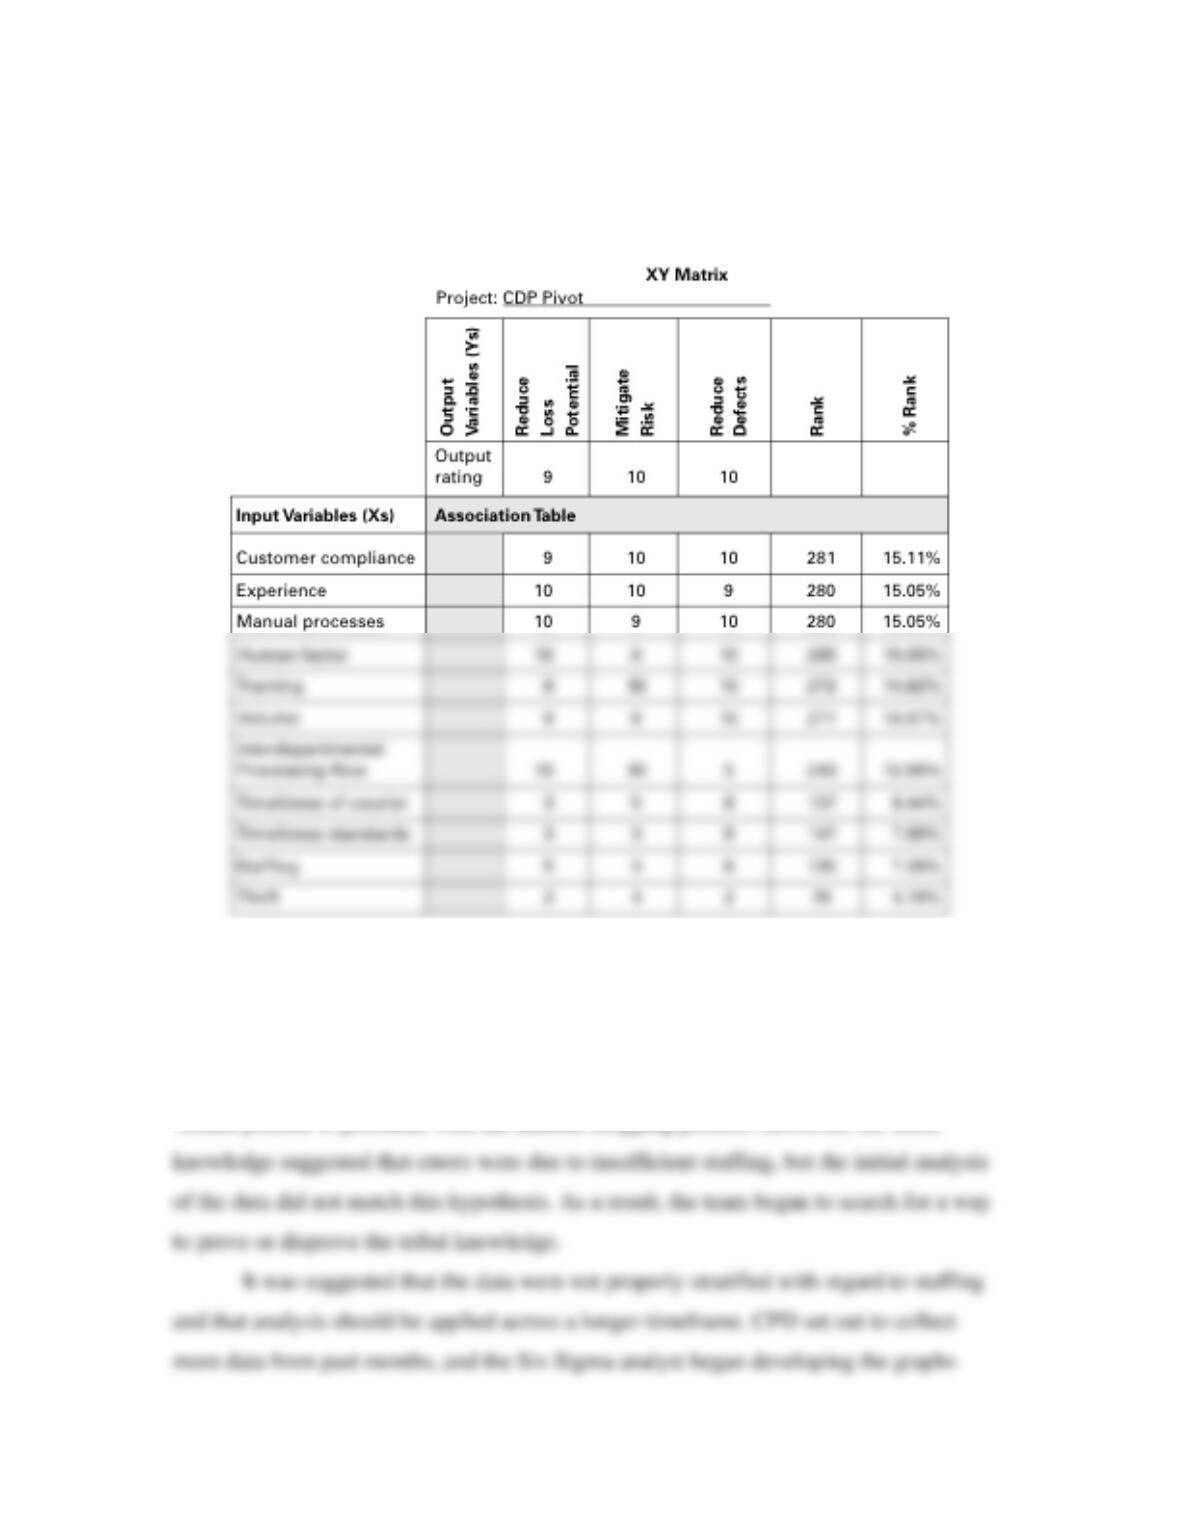
Table 1 Example of an XY Matrix
The Six Sigma analyst stratified the data collected across the potential error
categories. During the Analysis stage, analysis of an extensive array of graphs developed
from the data permitted the team to see trends in the process and to begin seeking
strategic solutions. Construction of the graphs required more than 48 hours of team effort.
Trends pointed to problems with the manual strapping process. However, the tribal

needed to examine the new data. Over the next week, some 100 different graphs were
created, depicting data in single strands and also paired with variables that interacted with
one another. The team’s Six Sigma training had emphasized the importance of fully
exploring all data interactions, using graphs to illustrate relationships between variables.
Despite the team’s best efforts to find a relationship, staffing and volume did not appear
to affect strapping errors. This finding disproved the tribal knowledge, while providing a
multitude of additional graphs for analysis.
Strong correlations were seen in the graphs involving human factors and manual
processes. CPD’s processes called for numerous manual steps when handling cash. The
graphs’ trends suggested that whenever a manual process occurred, the number of errors
To further evaluate the process, the team decided to utilize Failure Mode and
Effects Analysis. The FMEA paralleled the process map constructed in the Measure
stage, but concentrated more on the inputs to the processes. Once the steps were laid out,
the team brainstormed potential fallouts or errors from the process. Each of these errors
was then charted until the potential effect of the individual problem was found. After the
causes and effects were mapped out, each process step was then ranked on three
categories: severity, occurrence, and detection, to create an overall ranking of potential

problem. These issues focused the team on the need to alleviate the human interaction
with the process, and especially on fixing strapping errors.
Table 2 Typical Pivot FMEA Showing Key Process Steps
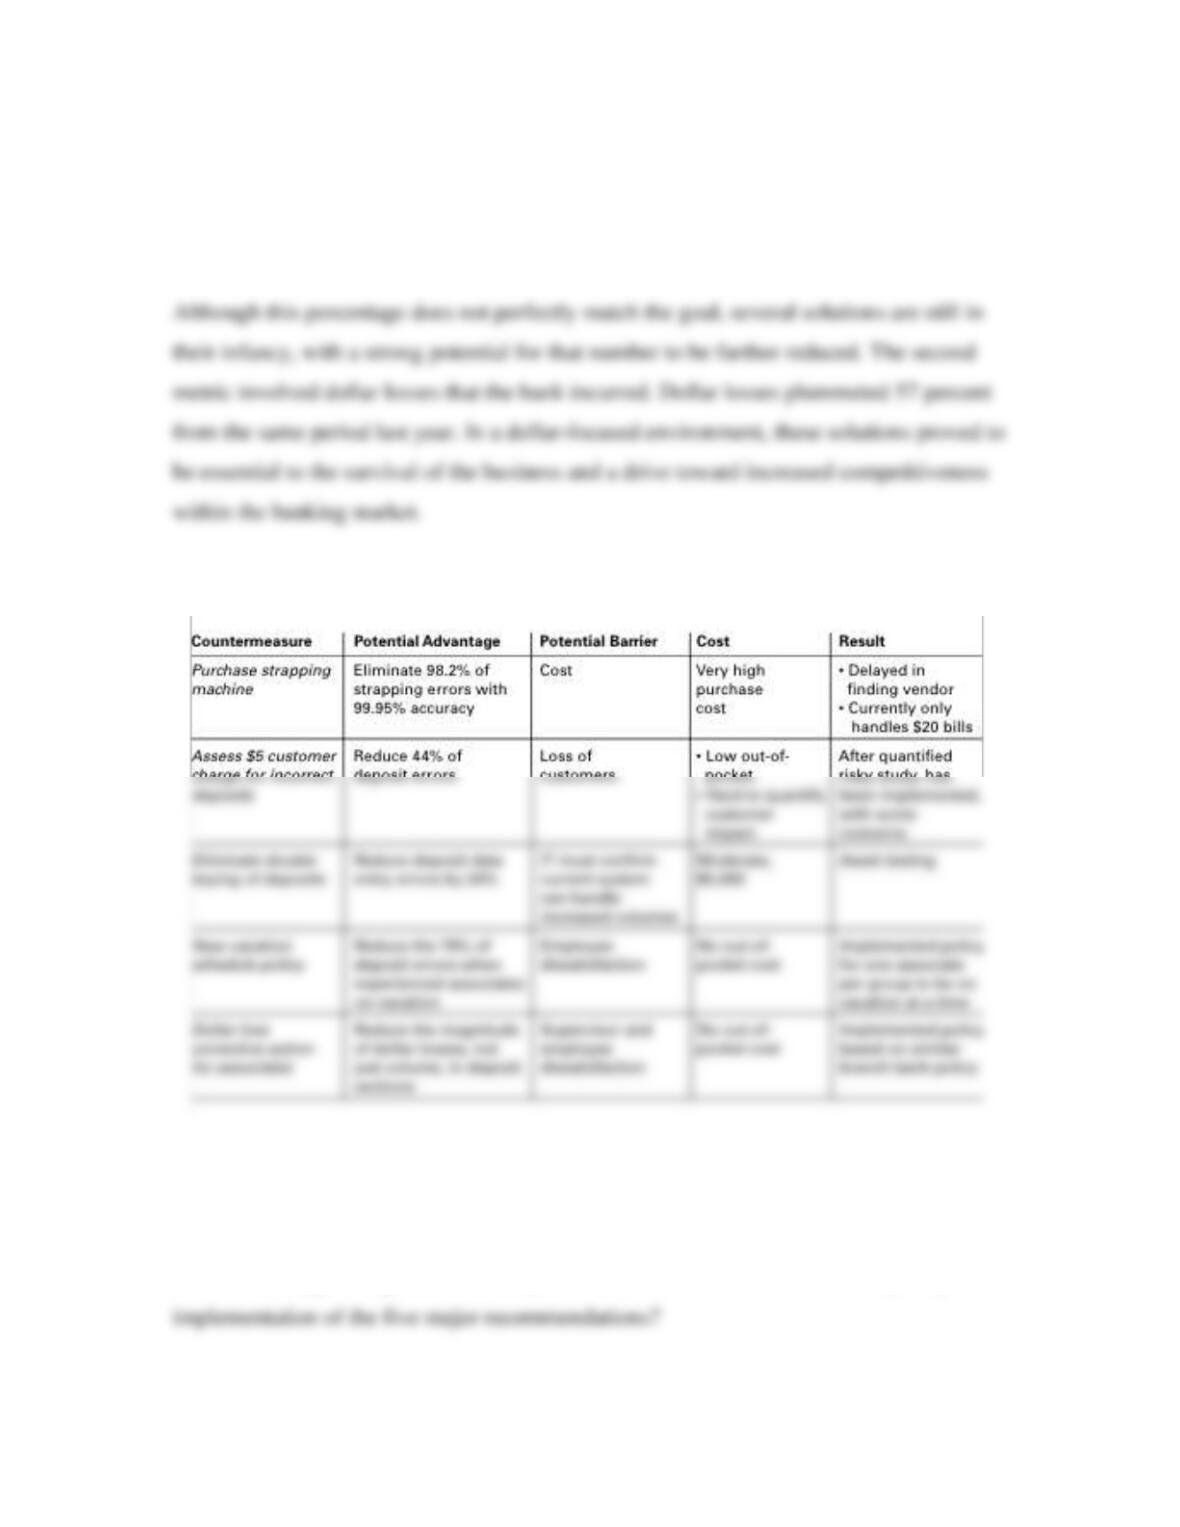
With statistically proven error causes available, the PIVOT team turned its
attention to the Improve stage to develop corrective actions. One of the most beneficial
tools used to find solutions to error causes was the Countermeasures Matrix. A portion of
this matrix is shown in Table 3. This diagram helped the team organize potential

After two or three potential solutions were identified for each root cause, the team
disbanded to conduct individual research on the feasibility and effectiveness of each
solution. These activities included bringing in vendors, visiting other cash vaults around
1. Purchase a cash strapping machine.
2. Assess a $5 charge to the clients for incorrect deposits.
3. Eliminate double keying of deposits in both CPD and Processing departments.
4. Implement a new vacation scheduling system for deposit processing associates to
reduce the number of errors attributable to inexperienced personnel on the job.
5. Implement a dollar loss corrective action program to discourage associates from
making large dollar errors in CPD’s deposit section.
The potential advantages and barriers for each countermeasure are shown in Table 3.
The CPD PIVOT team started out slowly in the Control stage as many solutions
were left to the subject matter experts to implement while some of the minor solutions
were immediately implemented into daily CPD processes. Some of the recommended
improvements were easy to sell and showed immediate results, while others were
extremely difficult. A pilot study of the $5 charge for incorrect deposits showed promise
project. The corrective action plan for dollar losses mirrored the branch plan, as it was
introduced to CPD associates. Its success had not been accurately measured.
The project has had a significant impact on errors within the department. Some of
the solutions have proved to be effective. Overall errors are down by 30 percent.
Table 3 Countermeasures Selection and Control
DISCUSSION QUESTIONS
1. How difficult did it appear to be to find the “root cause” of the errors? What do
you think contributed to the difficulty?
2. What types of quantitative analysis would need to be done in order to justify the