Excel Templates to accompany Operations Management, Eleventh Edition
created by Lee Tangedahl
Copyright © 2012 by The McGraw Hill Companies, Inc. All rights reserved.
Supplement to Chapter Eight – The Transportation Model
Templates: Transportation Model (Basic)
Lecture Suggestions
Transportation Model (Basic) Notes Use Solver on Data Ribbon to solve – see notes below.
<Back
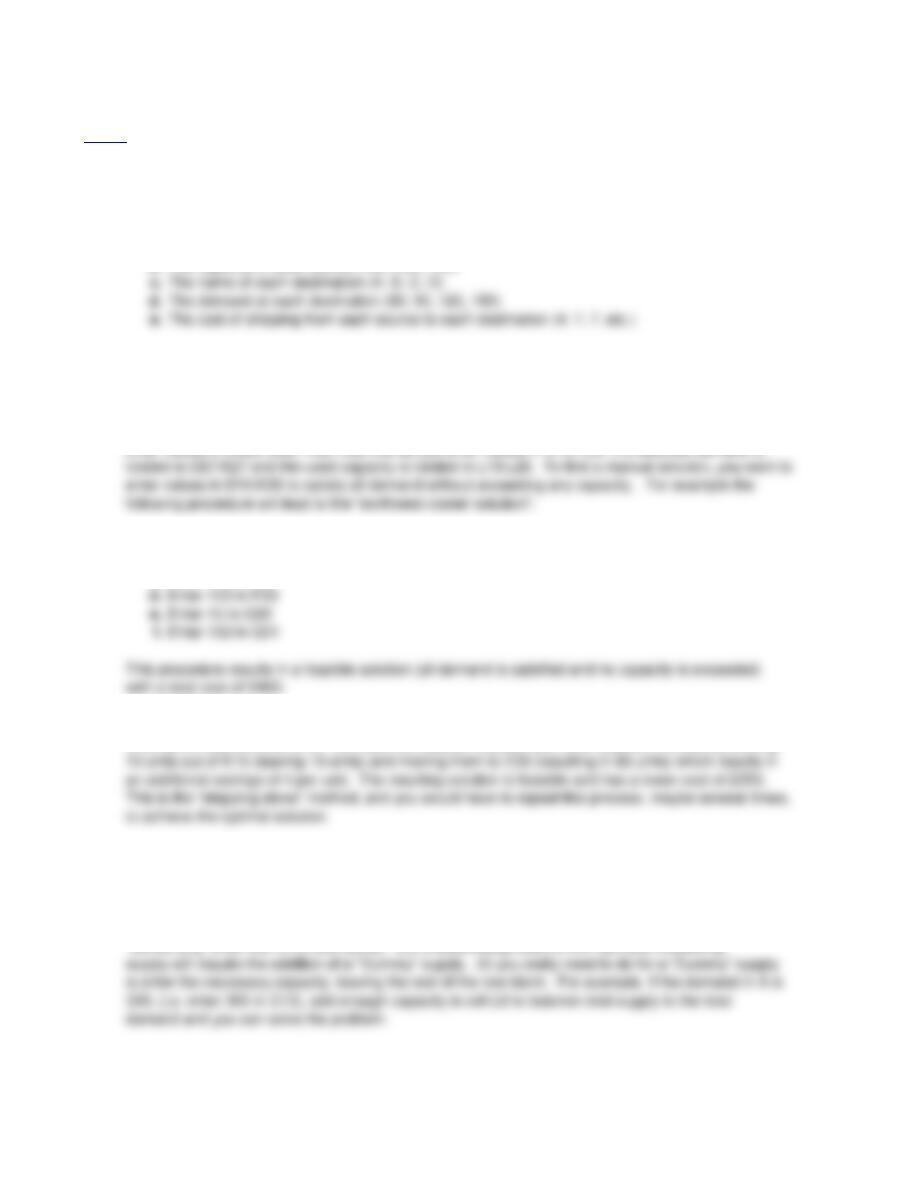
Input Matrix: Destinations
A B C D
1 4 7 7 1 100
Demand Required
Total Supply Available = 450
Do not change or delete unshaded cells. Total Demand Required = 450
Solution Matrix: Destinations
A B C D
1 0 0 10 90 0 0 0 0 100
2 0 90 110 00000200
380 0 0 70 0 0 0 0 150
Notes: See the Transportation tutorial for a demonstration of this template.
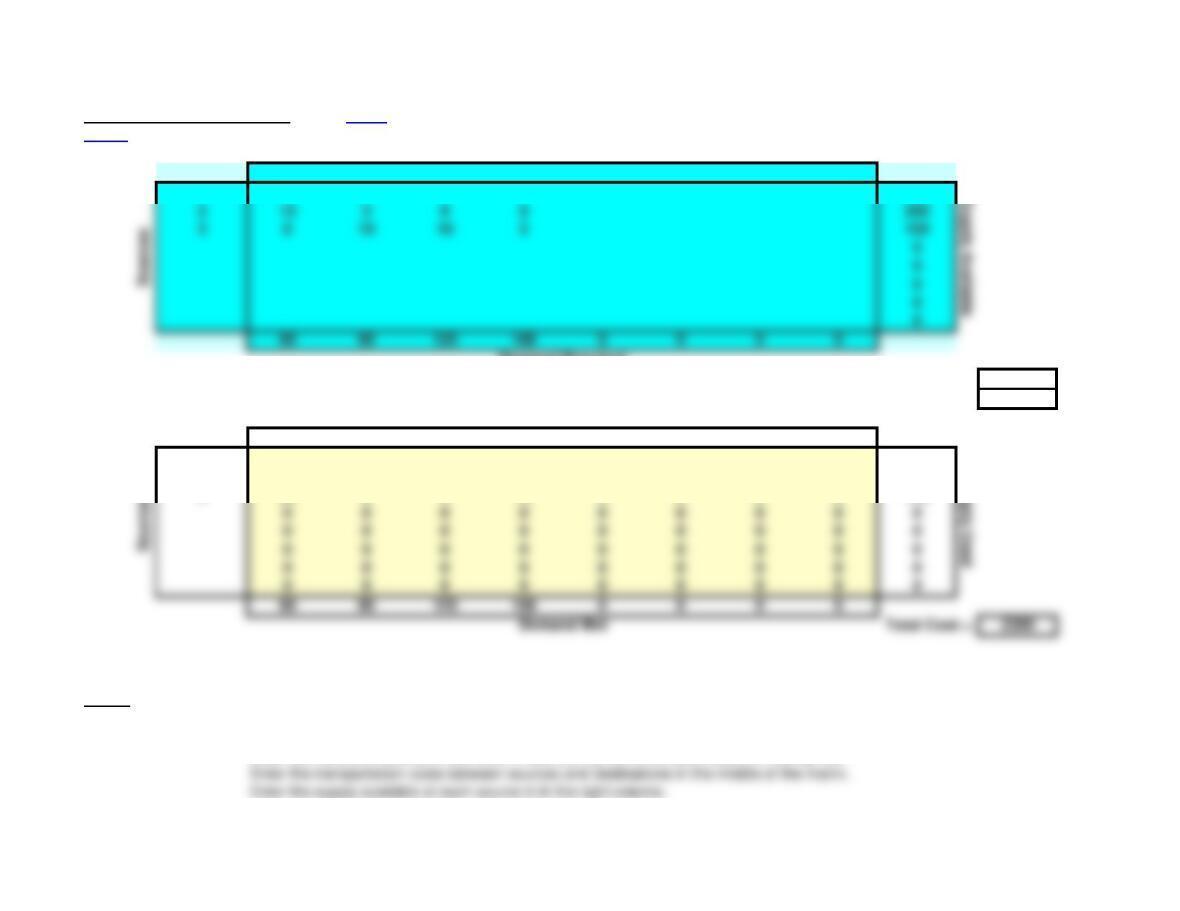
1. Enter the problem into the Input Matrix (top shaded area):
Enter the names of sources in left column and the names of the destinations in the top row.
Supply Available
Supply Used
212 3 8 8 200
3 8 10 16 5150
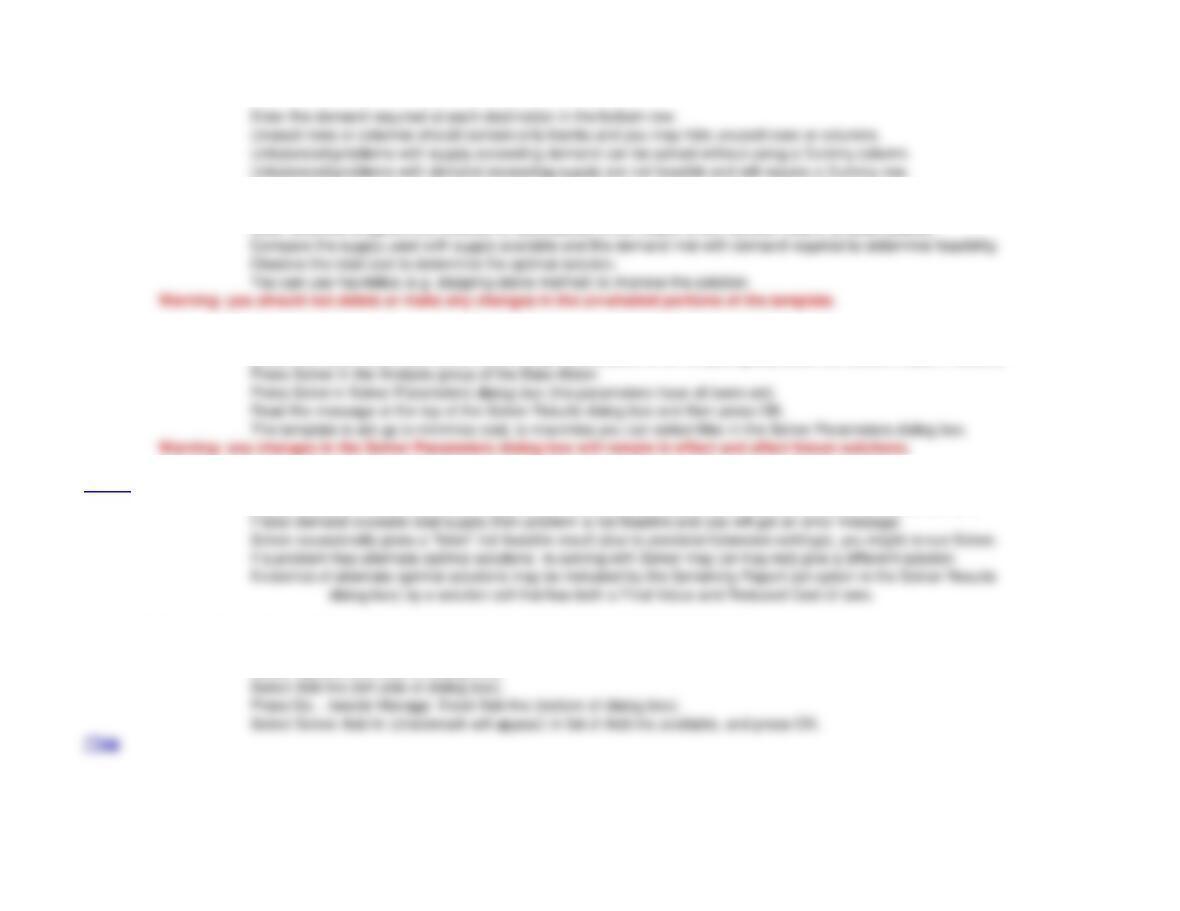
2.
You can manually create solutions in the Solution Matrix (bottom shaded area):
Enter amounts shipped from sources to destinations in the middle of the Solution Matrix (shaded yellow).
3. Using Solver to find the optimal solution:
Select the Data ribbon, the Solver Add-in must be available in the Analysis group (see note below to add-in Solver).
More… 4. Notes on the Solver solution:
Small numbers in scientific notation (e.g. 2.4091E-11) reflect the precision of Solver and can be treated as zero.
5. How to Add-In Solver if it does not appear in the Analysis group of the Data ribbon:
Select File (left-most item in main menu at top of screen).
Select Options (left side of dialog box).
Enter the demand required at each destination in the bottom row.
Lecture Suggestions – Supplement to Chapter 8
<Back
Example 1: Transportation Method
1. Select the Example 1 worksheet, note that the following data has been entered:
a. The name of each source (1, 2, 3)
b. The capacity of each source (100, 200, 150)
Note that total supply and demand are computed.
2. Delete the current solution by selecting cells D19:K26 and pressing delete.
3. Manually find a solution. Note that even though cells D19:K26 are not shaded you may manually
enter values in these cells. Also note that as you enter values in D19:K26, the satisfied demand is
a. Enter 80 in D19
b. Enter 20 in E19
c. Enter 70 in E20
d. Enter 120 in F20
e. Enter 10 in G20
4. Manually improve this solution. For example, you could save 7 per unit by shifting the 10
units out of G20 and into G19. To make the solution feasible, you must balance this shift by shifting
5. Use Solver to find the optimal solution. Use Solver in Data Ribbon (see notes) – this results in
the optimal solution with a cost of 2300. Actually there are two alternate optimal solutions, shifting 80
units between D19, D21, G21, andG19.
6. You may also demonstrate that unbalanced problems with supply exceeding demand may be
solved (e.g. enter 200 in L5 and Solve). But unbalanced problems with demand exceeding
c. The name of each destination (A, B, C, D)
d. The demand at each destination (80, 90, 120, 160)
e. The cost of shipping from each source to each destination (4, 7, 7, etc.)
Transportation Model (Basic) Notes Use Solver on Data Ribbon to solve – see notes below.
<Back
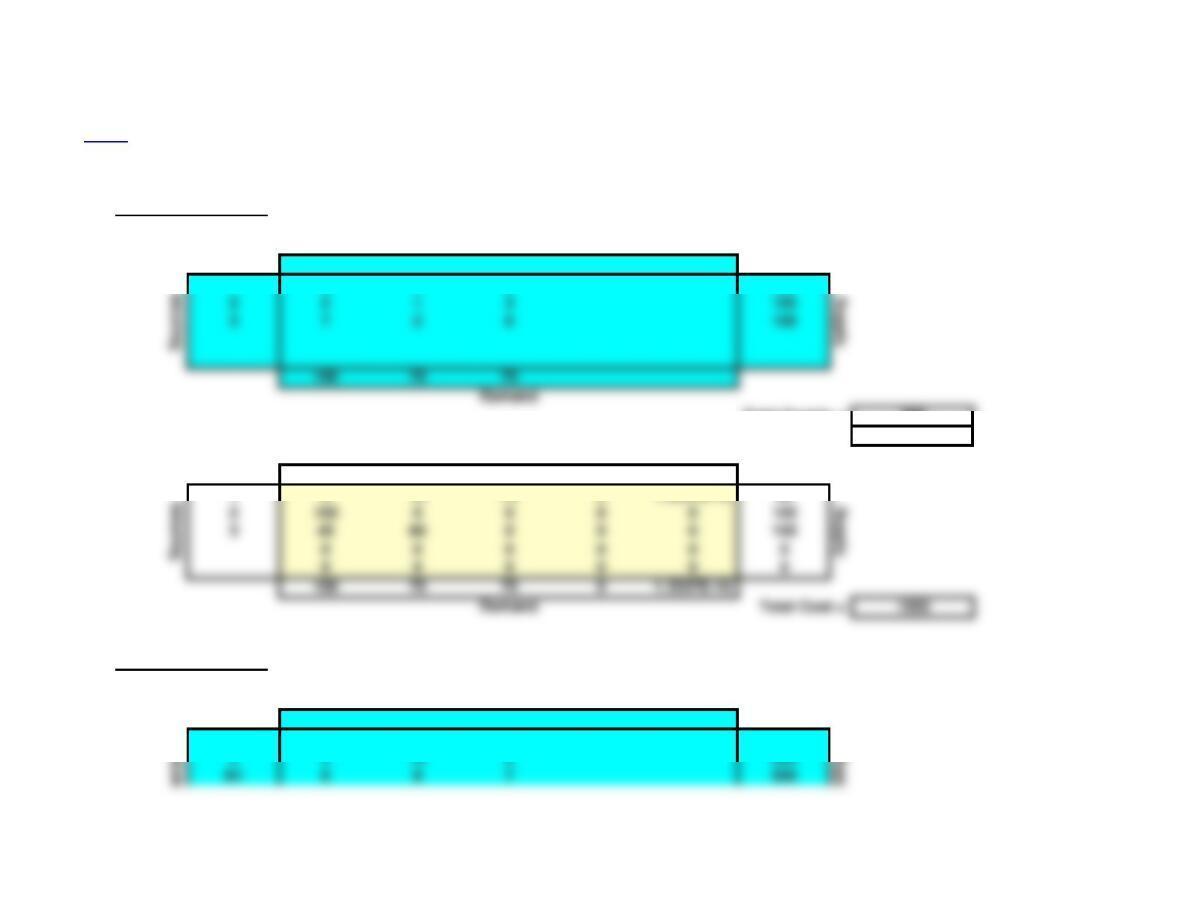
Input Matrix: Destinations
A B C D
1 4 7 7 1 100
Total Supply Available = 450
Do not change or delete unshaded cells. Total Demand Required = 450
Solution Matrix: Destinations
A B C D
180 010 10 0 0 0 0 100
2 0 90 110 00000200
Notes: See the Transportation tutorial for a demonstration of this template.
1. Enter the problem into the Input Matrix (top shaded area):
Enter the names of sources in left column and the names of the destinations in the top row.
Supply Available
Supply Used
212 3 8 8 200
3 8 10 16 5150
2.
You can manually create solutions in the Solution Matrix (bottom shaded area):
Enter amounts shipped from sources to destinations in the middle of the Solution Matrix (shaded yellow).
3. Using Solver to find the optimal solution:
Select the Data ribbon, the Solver Add-in must be available in the Analysis group (see note below to add-in Solver).
Press Solver in the Analysis group of the Data ribon.
More… 4. Notes on the Solver solution:
Small numbers in scientific notation (e.g. 2.4091E-11) reflect the precision of Solver and can be treated as zero.
5. How to Add-In Solver if it does not appear in the Analysis group of the Data ribbon:
Select File (left-most item in main menu at top of screen).
Select Options (left side of dialog box).
Enter the demand required at each destination in the bottom row.
Supplement to Chapter 8 – Problems 1-4 Note: This worksheet displays results only, you must copy the shaded
<Back area into the corresponding template to make additional calculations.
Note: unused rows and columns were deleted from the template solution for the following problems.
1. Transportation Model
Input Matrix: Destinations
1 2 3
1 8 2 5 90
Total Supply = 300
Total Demand = 300
Solution Matrix: Destinations
1 2 3
1 0 15 75 0 1.3337E-10 90
0 0 0 0 0 0
2. Transportation Model
Input Matrix: Destinations
A B C
1 8 3 7 500
2 5 10 9900
Sources
Supply
2 2 1 3 105
3 7 2 6 105

Total Supply = 1900
Total Demand = 1350
Solution Matrix: Destinations
A B C
1 0 500 0 0 0 500
2400 0 0 500 0900
400 600 350 500 0
Sources
Transportation Model
Input Matrix: Destinations
A B C
1 8 3 7 500
2 5 10 9900
N2 10 6 4 500
400 600 350
Demand
Total Supply = 1900
Total Demand = 1350
Solution Matrix: Destinations
A B C
1 0 500 0 0 0 500
2400 0 0 0 0 400
Sources
Sources
Supply
Supply
Supply
400 600 350
Demand
Sources
400 600 350 0 0
Demand Total Cost = 5500
3. Transportation Model
Input Matrix: Destinations
A B C
110 14 10 210
Total Supply = 660
Total Demand = 660
Solution Matrix: Destinations
A B C
1 0 0 210 0 0 210
2140 0 0 0 0 140
380 60 10 0 0 150
Toledo 0 160 0 0 0 160
0 0 0 0 0 0
220 220 220 0 0
Demand Total Cost = 6720
Input Matrix: Destinations
A B C
110 14 10 210
212 17 20 140
311 11 12 150
220 220 220
Sources
Supply
Sources
Supply
212 17 20 140
311 11 12 150
220 220 220
Sources
Total Supply = 660
Total Demand = 660
Solution Matrix: Destinations
A B C
1 0 0 210 0 0 210
4. Transportation Model
Input Matrix: Destinations
A B SCP
115 9 4 660
210 711 340
314 18 5200
Total Supply = 1200
Total Demand = 1200
Solution Matrix: Destinations
A B SCP
1 0 500 160 0 0 660
2340 0 0 0 0 340
360 0140 0 0 200
Supply
260 80 0 0 0 140
3 0 140 10 0 0 150
Input Matrix: Destinations
A B FI
Total Supply = 1200
Total Demand = 1200
Solution Matrix: Destinations
A B FI
160 500 100 0 0 660
2340 0 0 0 0 340
3 0 0 200 0 0 200
0 0 0 0 0 0
0 0 0 0 0 0
400 500 300 0 0
Demand Total Cost = 10500
Input Matrix: Destinations
A B LH
115 9 5 660
210 7 5 340
314 18 6200
400 500 300
Total Supply = 1200
Sources
Supply
Total Demand = 1200
Solution Matrix: Destinations
A B LH
1 0 500 160 0 0 660
2340 0 0 0 0 340
Sources
Supply
Sources
Supply
115 9 7 660
210 7 6 340
314 18 5200
400 500 300
Sources
Supply