Chapter 8
Morelia Mortgage Co. – Original data
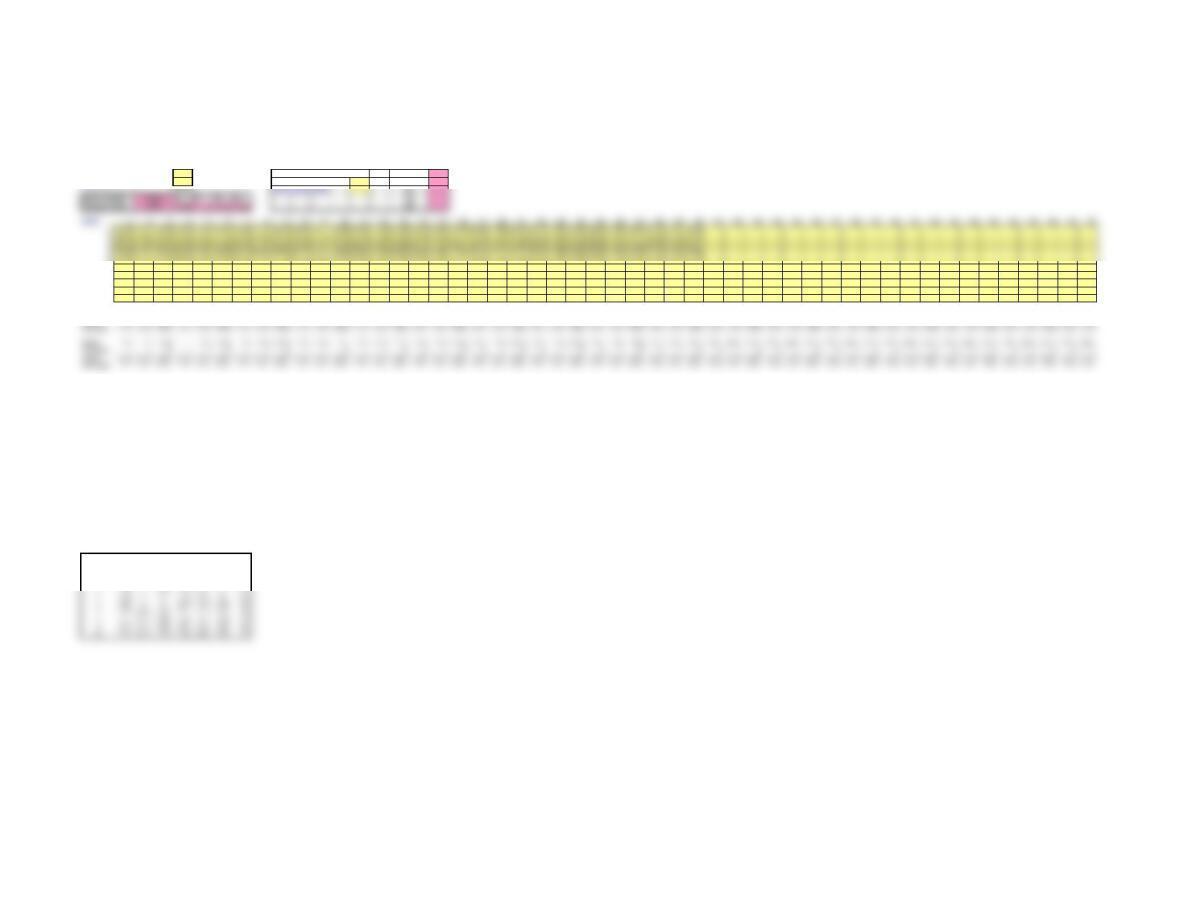
This spreadsheet is designed for up to 50 samples, each of a constant sample size from 2 to 10. Enter data ONLY in yellow-shaded cells.
Enter the number of samples in cell E6 and the sample size in cell E7. Then enter your data in the grid below.
Click on sheet tabs for a display of the control charts. Specification limits may be entered in cells N7 and N8 for process capability.
Number of samples (<= 50) 30 Process Capability Calculations Six sigma 21.7
5Upper specification
59.34 10.40 14.16 18.80 15.69 18.26 15.24 12.13 21.30 17.41 21.96 18.42 20.79 5.62 20.19 16.28 15.93 10.11 13.88 17.33 18.88 15.62 11.09 14.99 12.81 14.40 17.30 17.64 10.64 15.49
6
7
8
9
10
Average 16.32 14.74 14.22 16.17 15.86 14.36 14.68 16.3 22.03 16.67 17.47 15.82 15.06 12.76 18.57 17.1 17.44 13 17.06 14.28 23.69 16.52 13.67 15.37 15.23 12.12 14.06 17.18 17.41 15.47 #N/A #N/A #N/A #N/A #N/A #N/A #N/A #N/A #N/A #N/A #N/A #N/A #N/A #N/A #N/A #N/A #N/A #N/A #N/A #N/A
LCLx-bar 11.16 11.16 11.16 11.16 11.16 11.16 11.16 11.16 11.16 11.16 11.16 11.16 11.16 11.16 11.16 11.16 11.16 11.16 11.16 11.16 11.16 11.16 11.16 11.16 11.16 11.16 11.16 11.16 11.16 11.16 11.16 11.16 11.16 11.16 11.16 11.16 11.16 11.16 11.16 11.16 11.16 11.16 11.16 11.16 11.16 11.16 11.16 11.16 11.16 11.16
Center 16.02 16.02 16.02 16.02 16.02 16.02 16.02 16.02 16.02 16.02 16.02 16.02 16.02 16.02 16.02 16.02 16.02 16.02 16.02 16.02 16.02 16.02 16.02 16.02 16.02 16.02 16.02 16.02 16.02 16.02 16.02 16.02 16.02 16.02 16.02 16.02 16.02 16.02 16.02 16.02 16.02 16.02 16.02 16.02 16.02 16.02 16.02 16.02 16.02 16.02
Center 8.424 8.424 8.424 8.424 8.424 8.424 8.424 8.424 8.424 8.424 8.424 8.424 8.424 8.424 8.424 8.424 8.424 8.424 8.424 8.424 8.424 8.424 8.424 8.424 8.424 8.424 8.424 8.424 8.424 8.424 8.424 8.424 8.424 8.424 8.424 8.424 8.424 8.424 8.424 8.424 8.424 8.424 8.424 8.424 8.424 8.424 8.424 8.424 8.424 8.424
DO NOT MODIFY THIS TABLE
nA2 D3 D4 d2 A3 B3 B4
2 1.88 0 3.27 1.13 2.66 0 3.27
3 1.02 0 2.57 1.69 1.95 0 2.57
4 0.73 0 2.28 2.06 1.63 0 2.27
5 0.58 0 2.11 2.33 1.43 0 2.09
6 0.48 0 2 2.53 1.29 0.03 1.97
7 0.42 0.08 1.92 2.7 1.18 0.12 1.88
8 0.37 0.14 1.86 2.85 1.1 0.19 1.82
9 0.34 0.18 1.82 2.97 1.03 0.24 1.76
Control Chart Factors
X-bar and R-Chart
Sample size (2 – 10)
Cp
Grand Average A2 D3 D4 d2
22
24
26
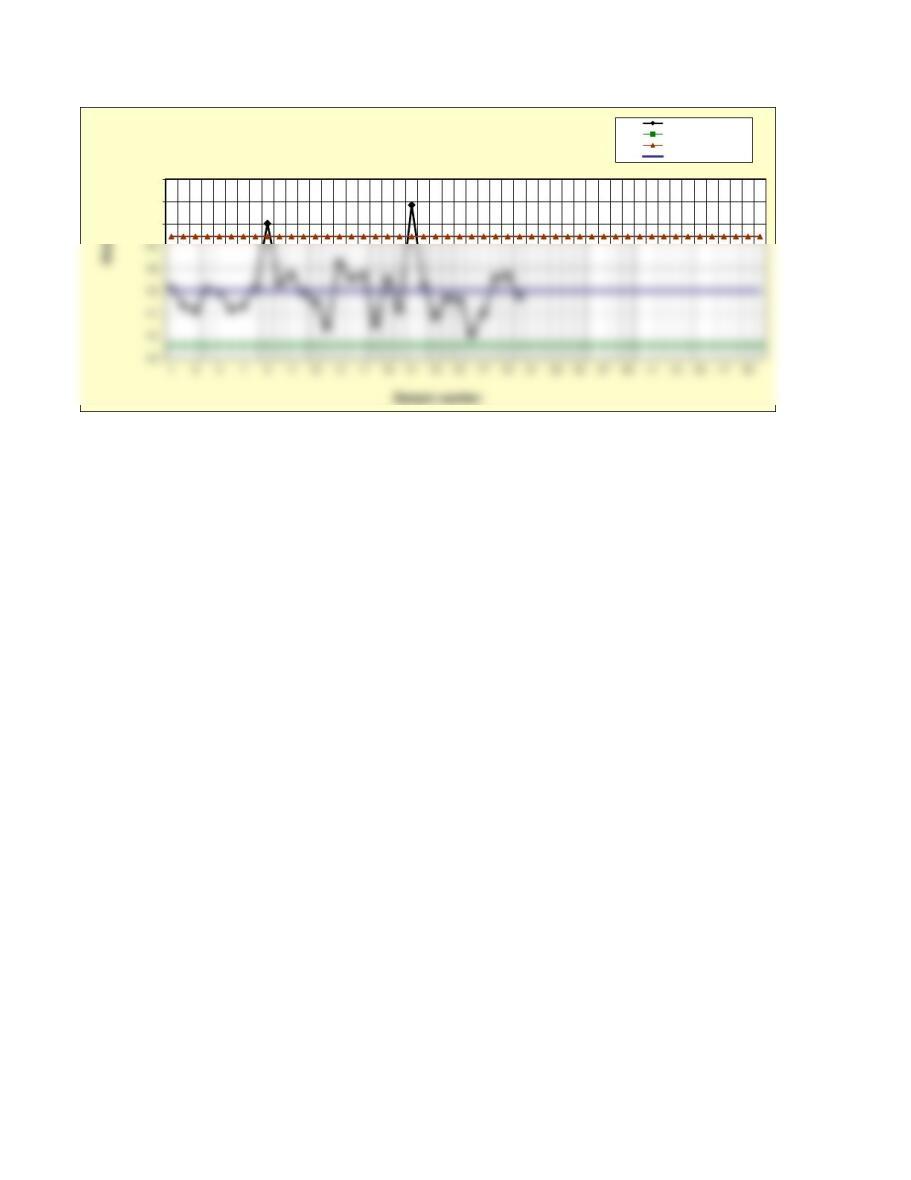
MMC– X-bar Chart
Averages
Lower control limit
Upper control limit
Center line
16
18
20
Sample number
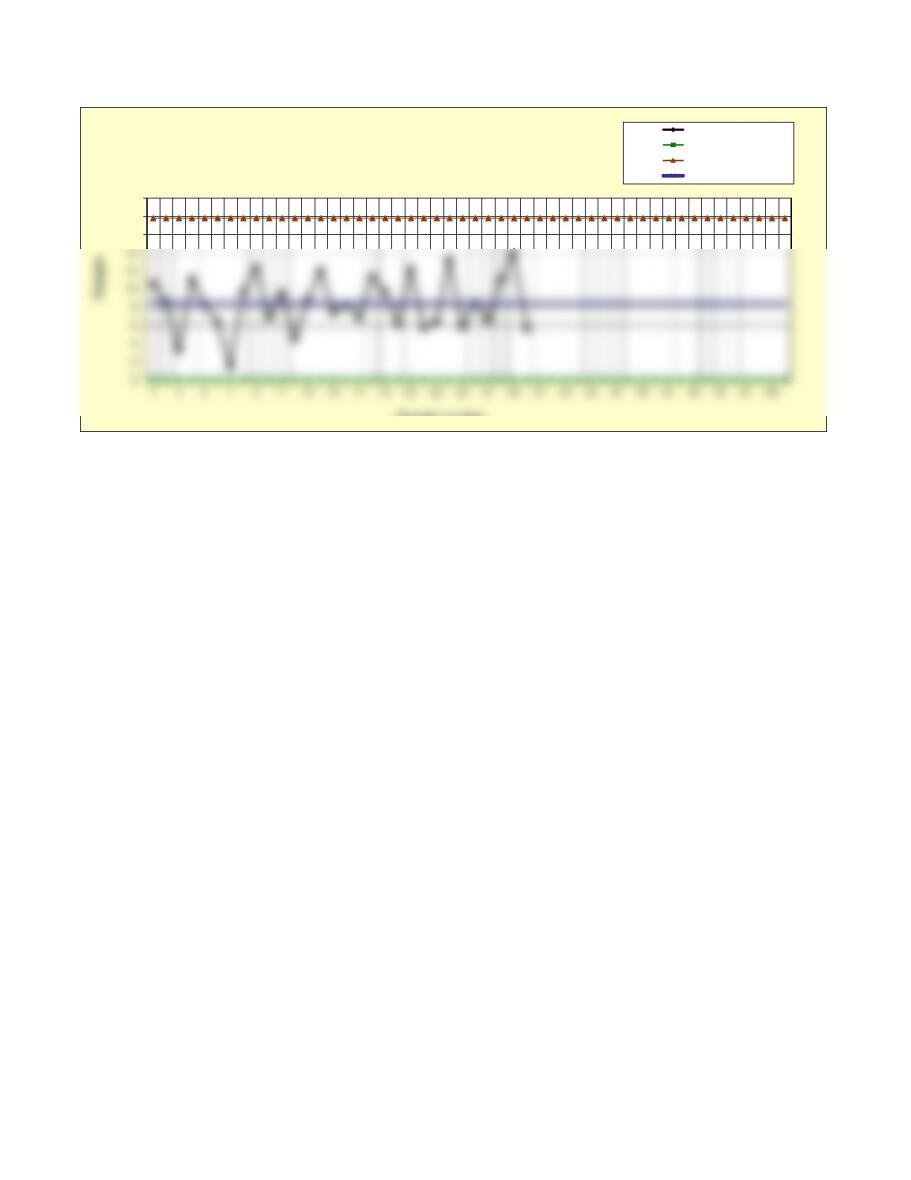
MMC– R-Chart
Ranges
Lower control limit
Upper control limit
Center line