Knight Industries
Solids Measures
X and Moving Range Chart
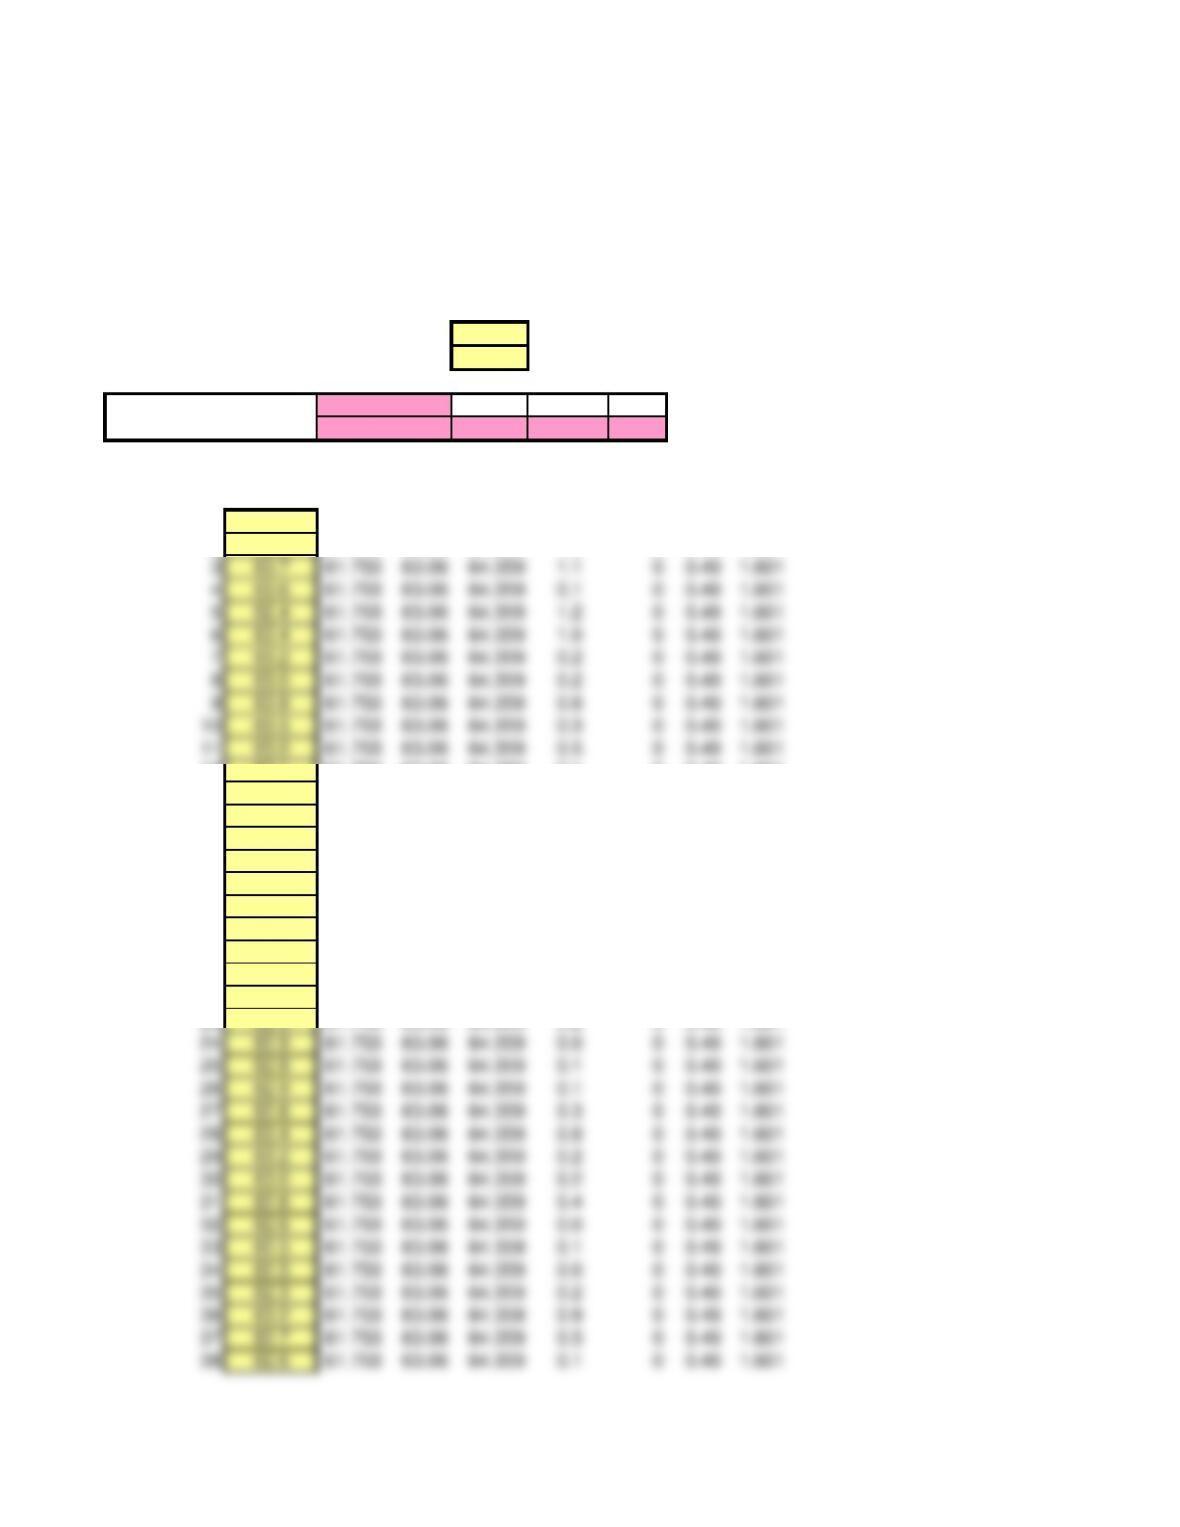
This spreadsheet is designed for up to 50 observations and a moving range from 2 to 5. Enter data ONLY in yellow-shaded cells.
Enter the number of samples in cell E6 and the sample size in cell E7. Then enter your data in the grid below.
Click on sheet tabs to display the control charts (some rescaling may be needed).
Number of samples (<= 50) 41
2
Grand Average D3 D4 d2
Average Range 0 3.267 1.128
Moving
Observation Value LCLx CLx UCLx Range LCLr CLr UCLr
164.2 61.753 63.06 64.359
262.6 61.753 63.06 64.359 1.6 00.49 1.601
12 63.1 61.753 63.06 64.359 0.1 00.49 1.601
13 62.9 61.753 63.06 64.359 0.2 00.49 1.601
14 63.4 61.753 63.06 64.359 0.5 00.49 1.601
15 62.6 61.753 63.06 64.359 0.8 00.49 1.601
16 63.3 61.753 63.06 64.359 0.7 00.49 1.601
17 64.1 61.753 63.06 64.359 0.8 00.49 1.601
18 62.7 61.753 63.06 64.359 1.4 00.49 1.601
19 63.8 61.753 63.06 64.359 1.1 00.49 1.601
20 63.9 61.753 63.06 64.359 0.1 00.49 1.601
21 63.4 61.753 63.06 64.359 0.5 00.49 1.601
22 62.7 61.753 63.06 64.359 0.7 00.49 1.601
23 62.9 61.753 63.06 64.359 0.2 00.49 1.601
Sample size for moving range(2 – 5)
63.056
0.490
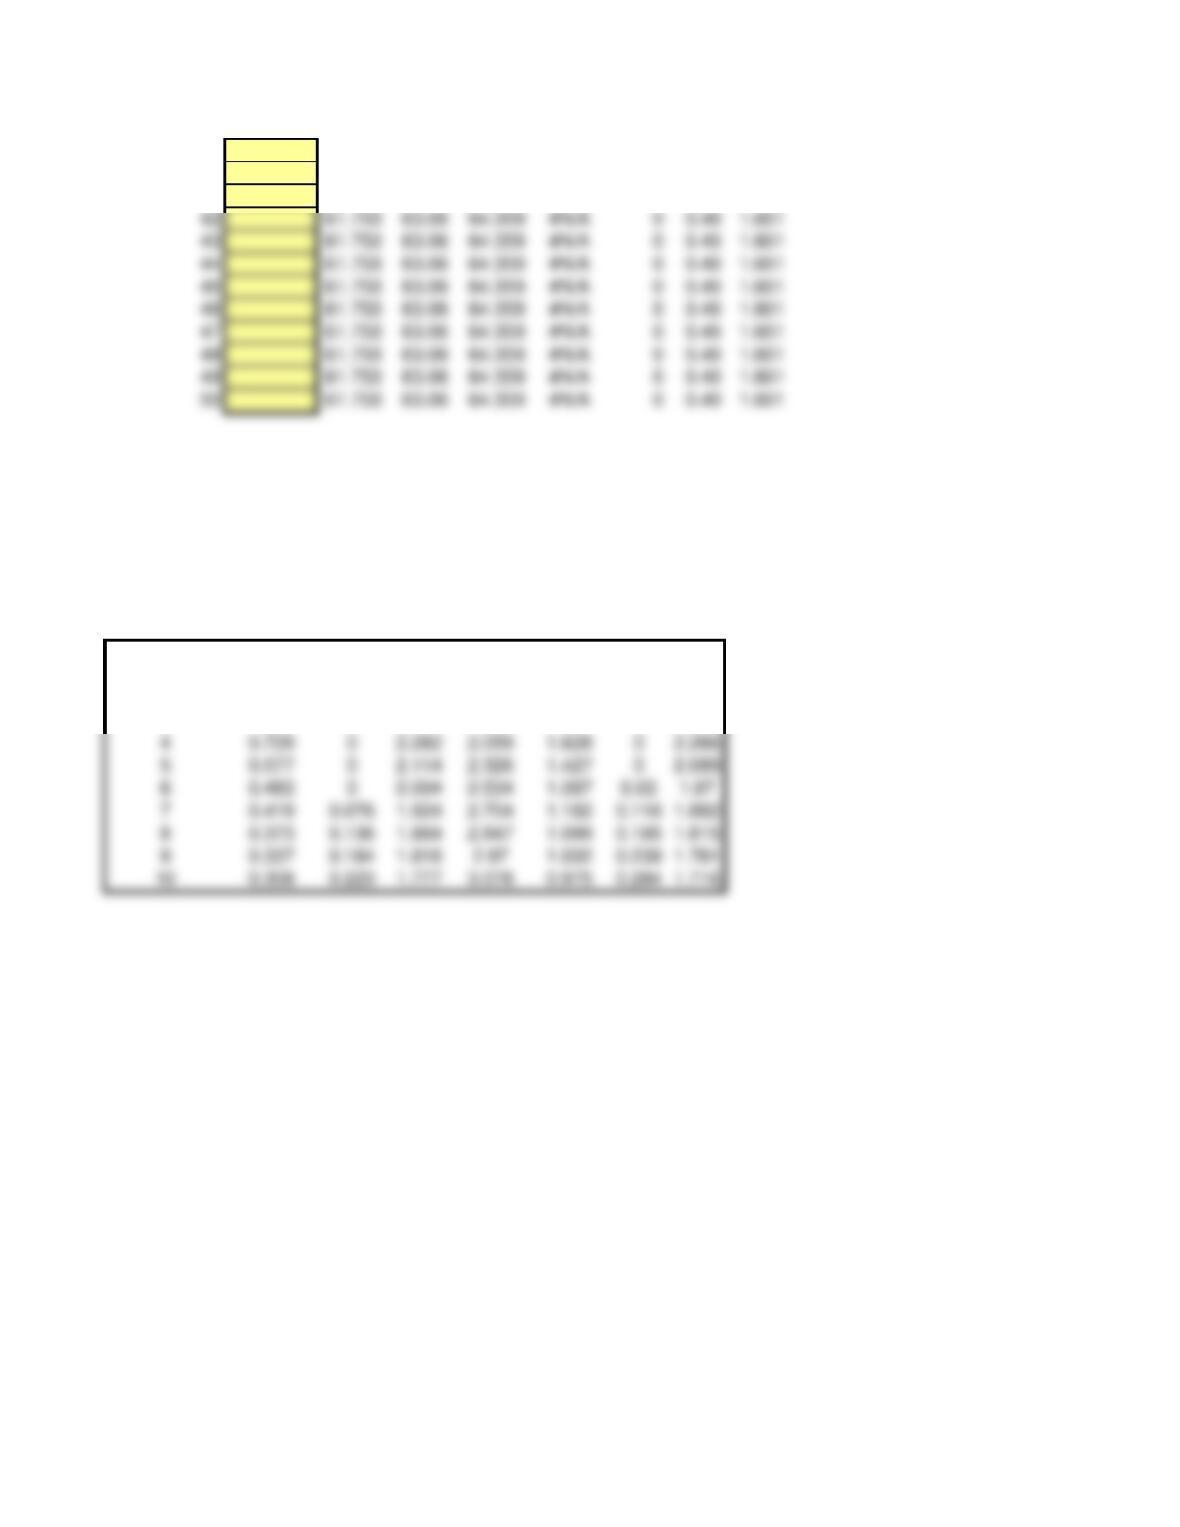
39 62.3 61.753 63.06 64.359 0.3 00.49 1.601
40 62.4 61.753 63.06 64.359 0.1 00.49 1.601
41 63.6 61.753 63.06 64.359 1.2 00.49 1.601
DO NOT MODIFY THIS TABLE
nA2 D3 D4 d2 A3 B3 B4
21.88 03.267 1.128 2.659 03.267
31.023 02.574 1.693 1.954 02.568
Control Chart Factors
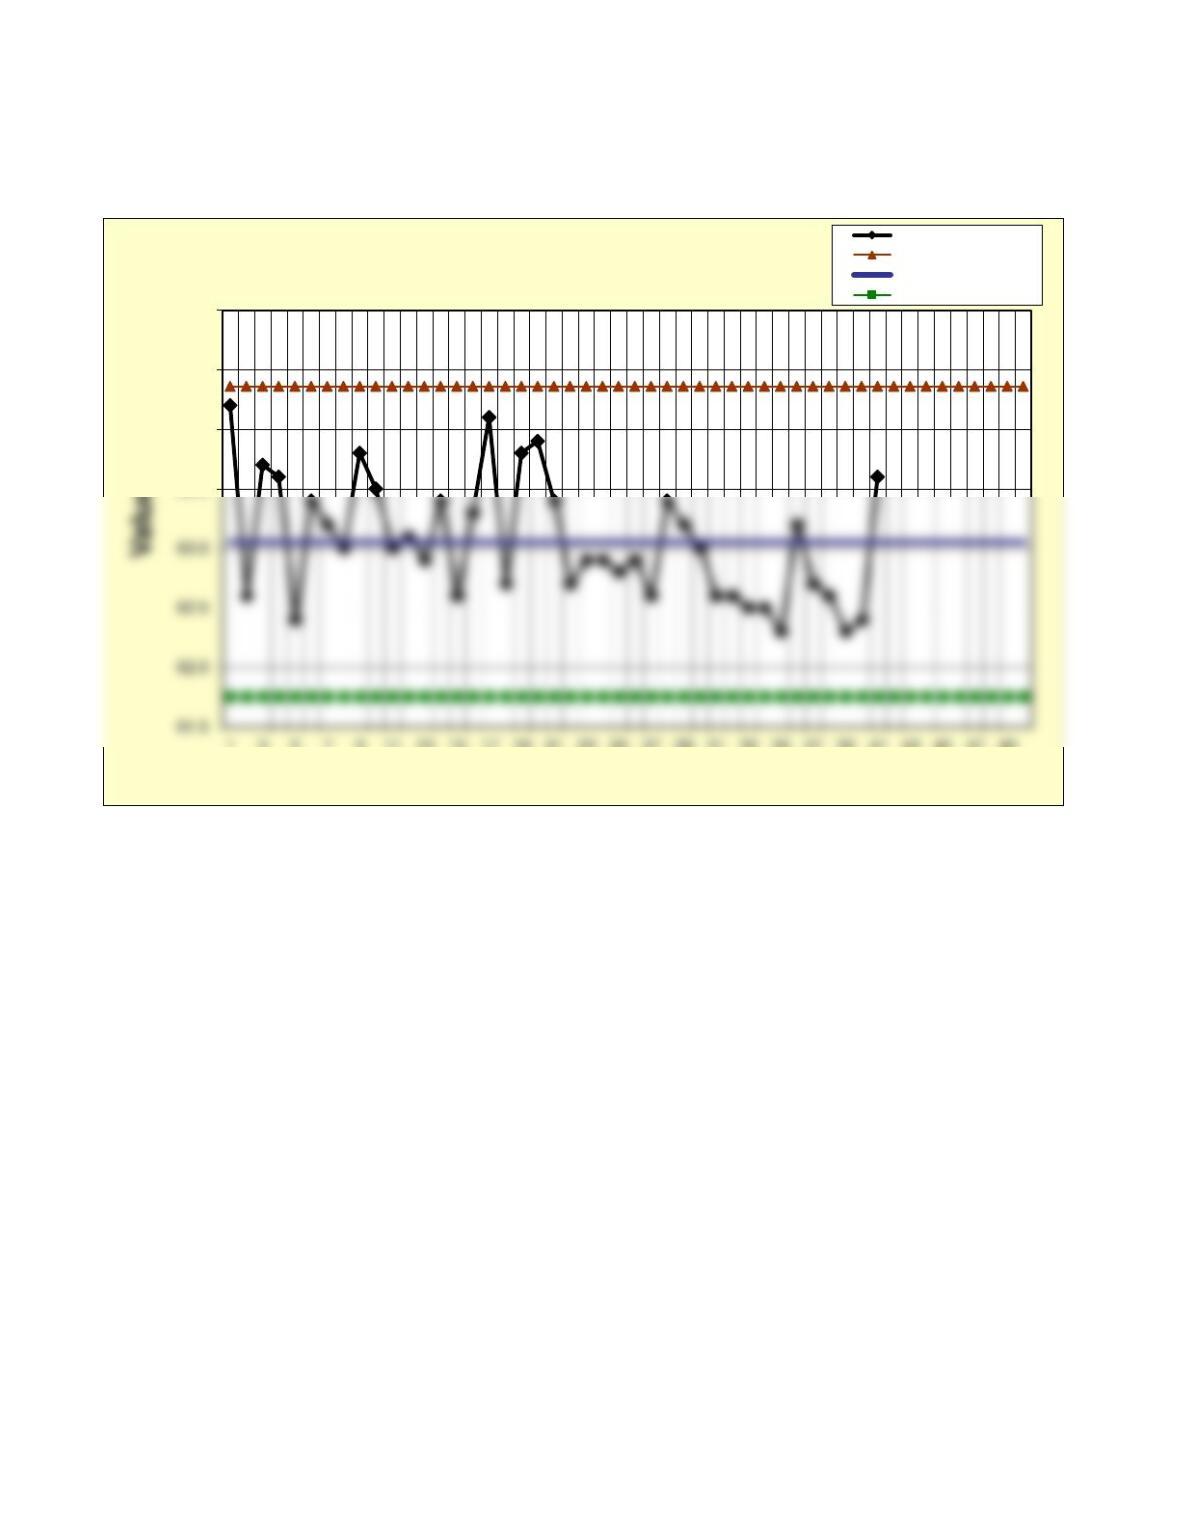
Knight Industries
Solids Measures
63.5
64.0
64.5
65.0
1357911 13 15 17 19 21 23 25 27 29 31 33 35 37 39 41 43 45 47 49
Observation number
Individuals (X) Chart – Solids Individuals
Upper control limit
Center line
Lower control limit
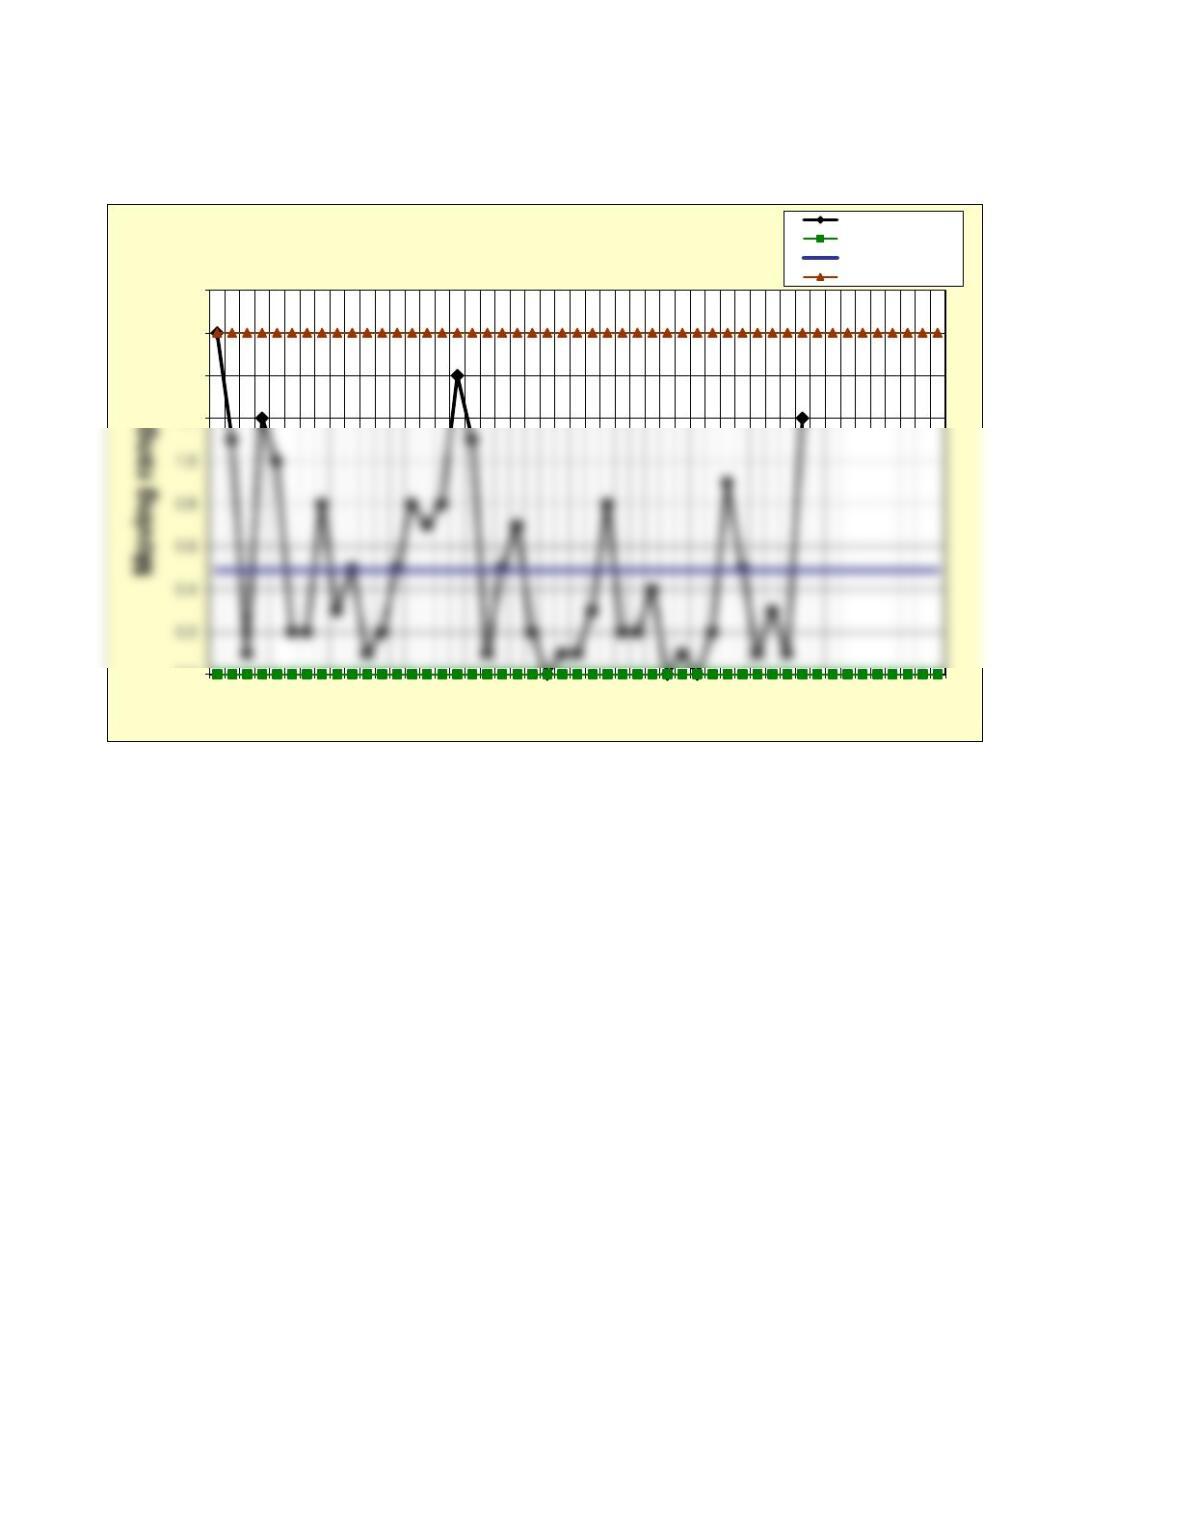
Knight Industries
Solids Measures
0.0
1.2
1.4
1.6
1.8
1 3 5 7 9 11 13 15 17 19 21 23 25 27 29 31 33 35 37 39 41 43 45 47 49
Observation number
Moving Range Chart – Solids Moving ranges
Lower control limit
Center line
Upper control limit