Chapter 8
Morelia Mortgage Co. – Remove outliers
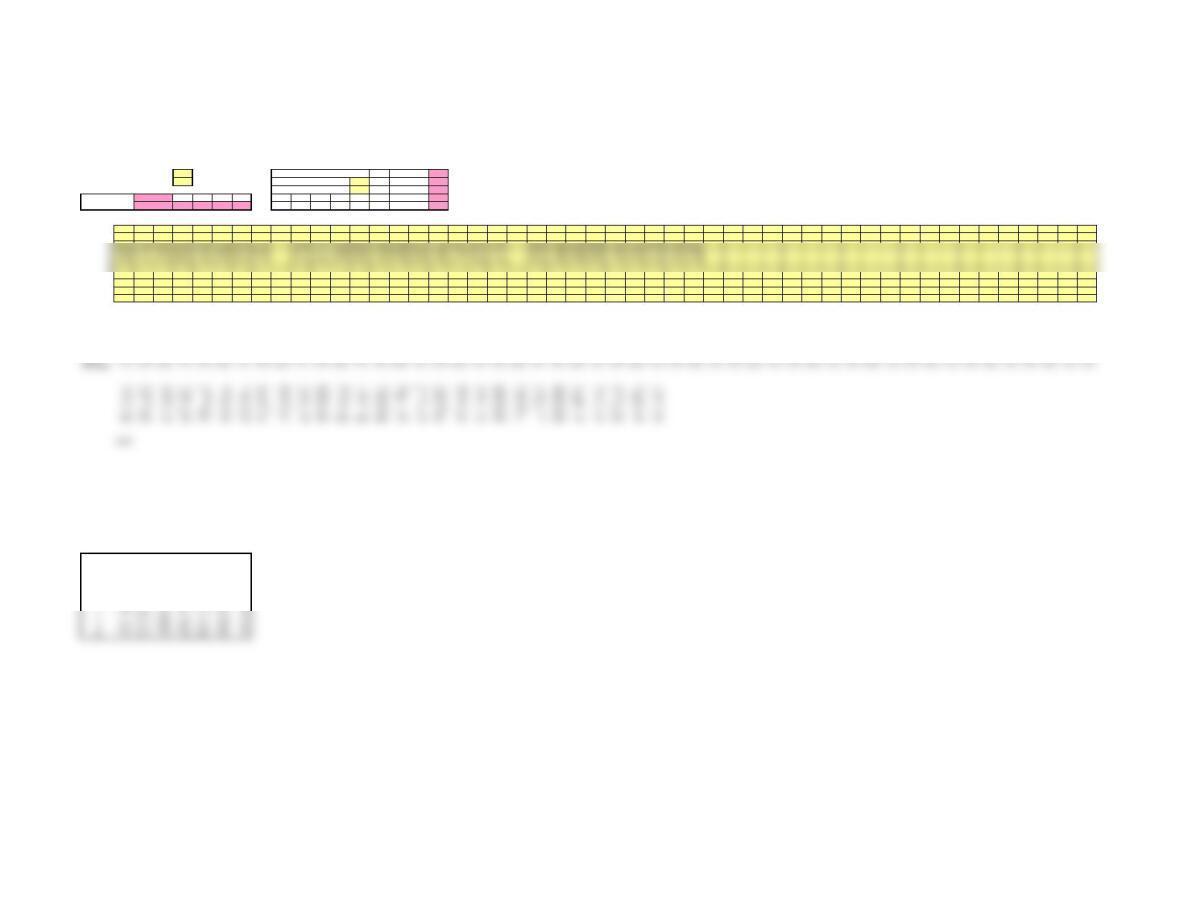
This spreadsheet is designed for up to 50 samples, each of a constant sample size from 2 to 10. Enter data ONLY in yellow-shaded cells.
Enter the number of samples in cell E6 and the sample size in cell E7. Then enter your data in the grid below.
Click on sheet tabs for a display of the control charts. Specification limits may be entered in cells N7 and N8 for process capability.
Number of samples (<= 50) 28 Process Capability Calculations Six sigma 21
5Upper specification 20.5 0.48
Lower specification 10.5 0.47
Grand Average A2 D3 D4 d2 0.48
Average Range 0.58 0 2.11 2.33 0.47
DATA 12345678910 11 12 13 14 15 16 17 18 19 20 21 22 23 24 25 26 27 28 29 30 31 32 33 34 35 36 37 38 39 40 41 42 43 44 45 46 47 48 49 50
117.81 11.91 16.15 17.37 11.18 13.01 14.02 15.74 16.60 12.41 13.88 12.90 17.68 21.29 17.64 20.90 17.43 23.59 15.58 19.17 17.26 14.27 13.55 15.35 13.82 17.19 14.01 12.32
219.93 15.86 13.53 9.42 18.04 11.87 14.51 18.08 12.29 19.76 16.76 11.94 12.39 13.86 22.39 14.04 16.91 14.26 13.54 16.20 15.56 13.83 18.32 6.81 10.71 16.96 24.70 15.52
7
8
9
10
Average 16.32 14.74 14.22 16.17 15.86 14.36 14.68 16.3 #N/A 16.67 17.47 15.82 15.06 12.76 18.57 17.1 17.44 13 17.06 14.28 #N/A 16.52 13.67 15.37 15.23 12.12 14.06 17.18 17.41 15.47 #N/A #N/A #N/A #N/A #N/A #N/A #N/A #N/A #N/A #N/A #N/A #N/A #N/A #N/A #N/A #N/A #N/A #N/A #N/A #N/A
LCLx-bar 10.83 10.83 10.83 10.83 10.83 10.83 10.83 10.83 10.83 10.83 10.83 10.83 10.83 10.83 10.83 10.83 10.83 10.83 10.83 10.83 10.83 10.83 10.83 10.83 10.83 10.83 10.83 10.83 10.83 10.83 10.83 10.83 10.83 10.83 10.83 10.83 10.83 10.83 10.83 10.83 10.83 10.83 10.83 10.83 10.83 10.83 10.83 10.83 10.83 10.83
Center 15.53 15.53 15.53 15.53 15.53 15.53 15.53 15.53 15.53 15.53 15.53 15.53 15.53 15.53 15.53 15.53 15.53 15.53 15.53 15.53 15.53 15.53 15.53 15.53 15.53 15.53 15.53 15.53 15.53 15.53 15.53 15.53 15.53 15.53 15.53 15.53 15.53 15.53 15.53 15.53 15.53 15.53 15.53 15.53 15.53 15.53 15.53 15.53 15.53 15.53
UCLx-bar 20.23 20.23 20.23 20.23 20.23 20.23 20.23 20.23 20.23 20.23 20.23 20.23 20.23 20.23 20.23 20.23 20.23 20.23 20.23 20.23 20.23 20.23 20.23 20.23 20.23 20.23 20.23 20.23 20.23 20.23 20.23 20.23 20.23 20.23 20.23 20.23 20.23 20.23 20.23 20.23 20.23 20.23 20.23 20.23 20.23 20.23 20.23 20.23 20.23 20.23
Range 10.59 8.6 3.28 11.11 8.24 6.39 1.48 9.69 #N/A 6.88 9.55 4.54 8.85 12.06 7.43 8.29 6.86 11.39 9.71 6.08 #N/A 5.72 6.43 13.29 5.83 8.54 6.59 11.03 14.06 5.61 #N/A #N/A #N/A #N/A #N/A #N/A #N/A #N/A #N/A #N/A #N/A #N/A #N/A #N/A #N/A #N/A #N/A #N/A #N/A #N/A
LCLrange 00000000000000000000000000000000000000000000000000
Center 8.147 8.147 8.147 8.147 8.147 8.147 8.147 8.147 8.147 8.147 8.147 8.147 8.147 8.147 8.147 8.147 8.147 8.147 8.147 8.147 8.147 8.147 8.147 8.147 8.147 8.147 8.147 8.147 8.147 8.147 8.147 8.147 8.147 8.147 8.147 8.147 8.147 8.147 8.147 8.147 8.147 8.147 8.147 8.147 8.147 8.147 8.147 8.147 8.147 8.147
DO NOT MODIFY THIS TABLE
nA2 D3 D4 d2 A3 B3 B4
2 1.88 0 3.27 1.13 2.66 0 3.27
3 1.02 0 2.57 1.69 1.95 0 2.57
4 0.73 0 2.28 2.06 1.63 0 2.27
5 0.58 0 2.11 2.33 1.43 0 2.09
6 0.48 0 2 2.53 1.29 0.03 1.97
7 0.42 0.08 1.92 2.7 1.18 0.12 1.88
8 0.37 0.14 1.86 2.85 1.1 0.19 1.82
9 0.34 0.18 1.82 2.97 1.03 0.24 1.76
Control Chart Factors
X-bar and R-Chart
Sample size (2 – 10)
15.532
8.147
Cp
Cpu
Cpl
Cpk
319.12 19.00 12.87 14.74 14.96 15.55 15.50 13.73 17.88 19.91 15.53 16.27 14.13 16.56 14.10 17.05 14.51 14.47 11.25 13.45 13.62 23.52 18.64 9.95 13.12 22.56 18.58 16.11
415.39 16.51 14.37 20.53 19.42 13.09 14.14 21.82 19.17 13.31 14.49 13.41 14.00 20.93 15.08 19.26 6.04 19.10 13.71 18.18 10.83 10.23 12.83 14.09 15.33 11.53 19.12 17.93
6
18
20
22
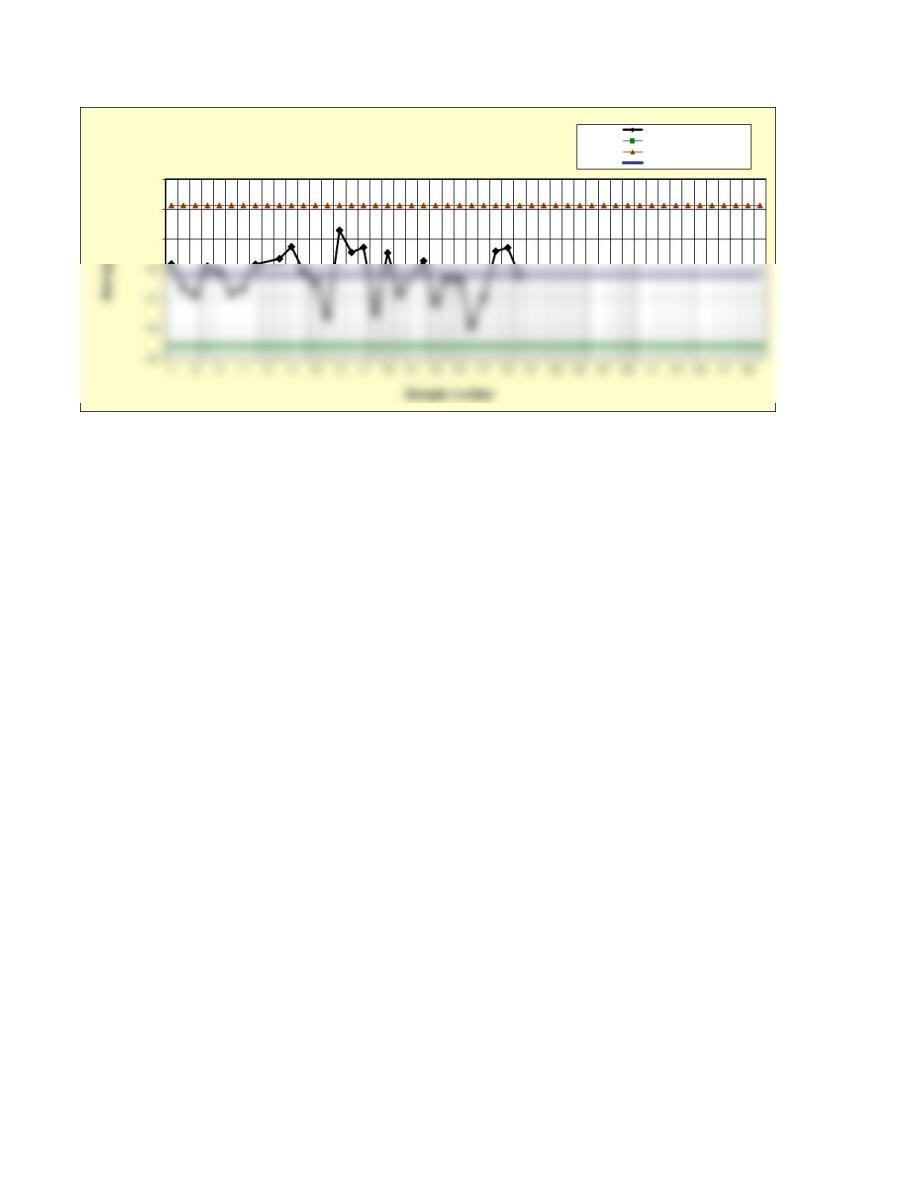
X-bar Chart
Averages
Lower control limit
Upper control limit
Center line
14
16
18
20
Sample number
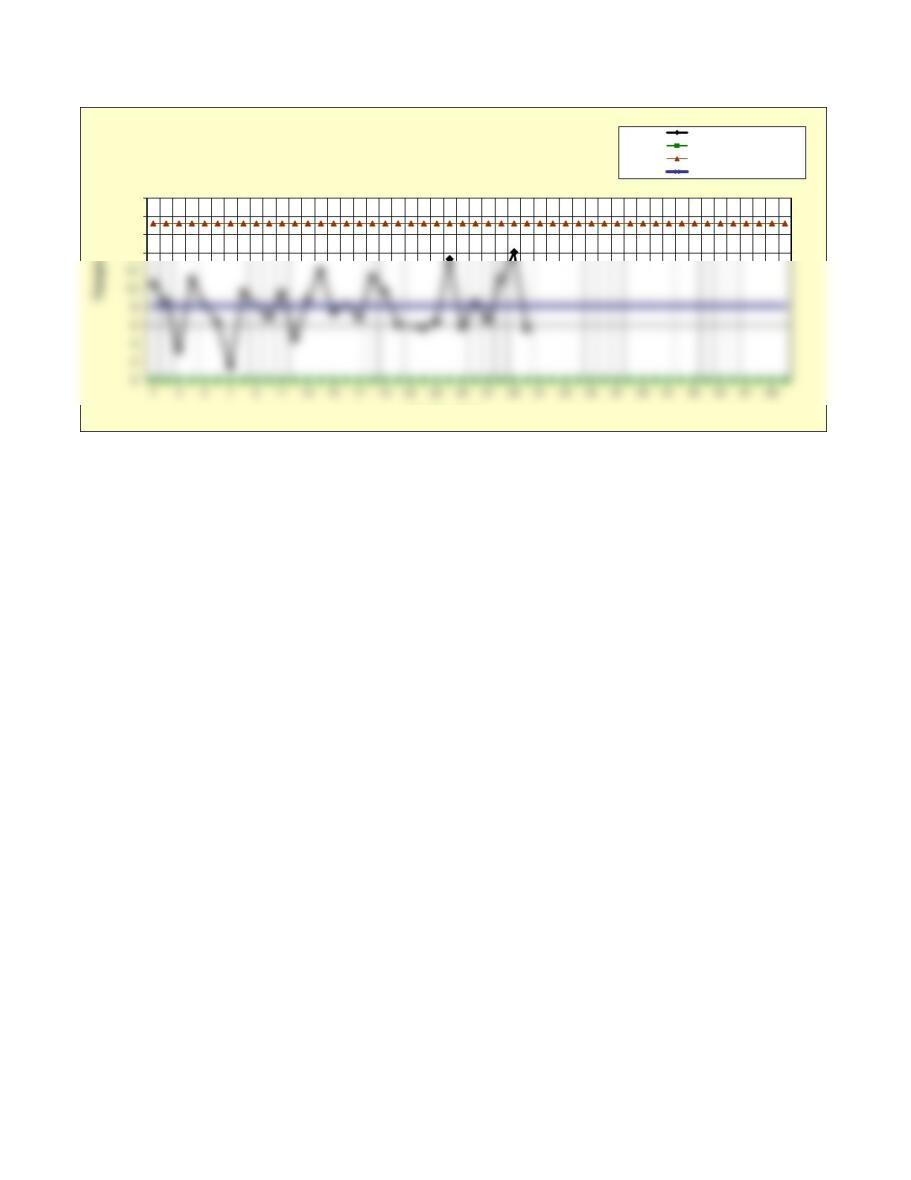
R-Chart
Ranges
Lower control limit
Upper control limit
Center line