Montvalley Short-Haul Lines, Inc.
Initial U-Chart (Base Case)
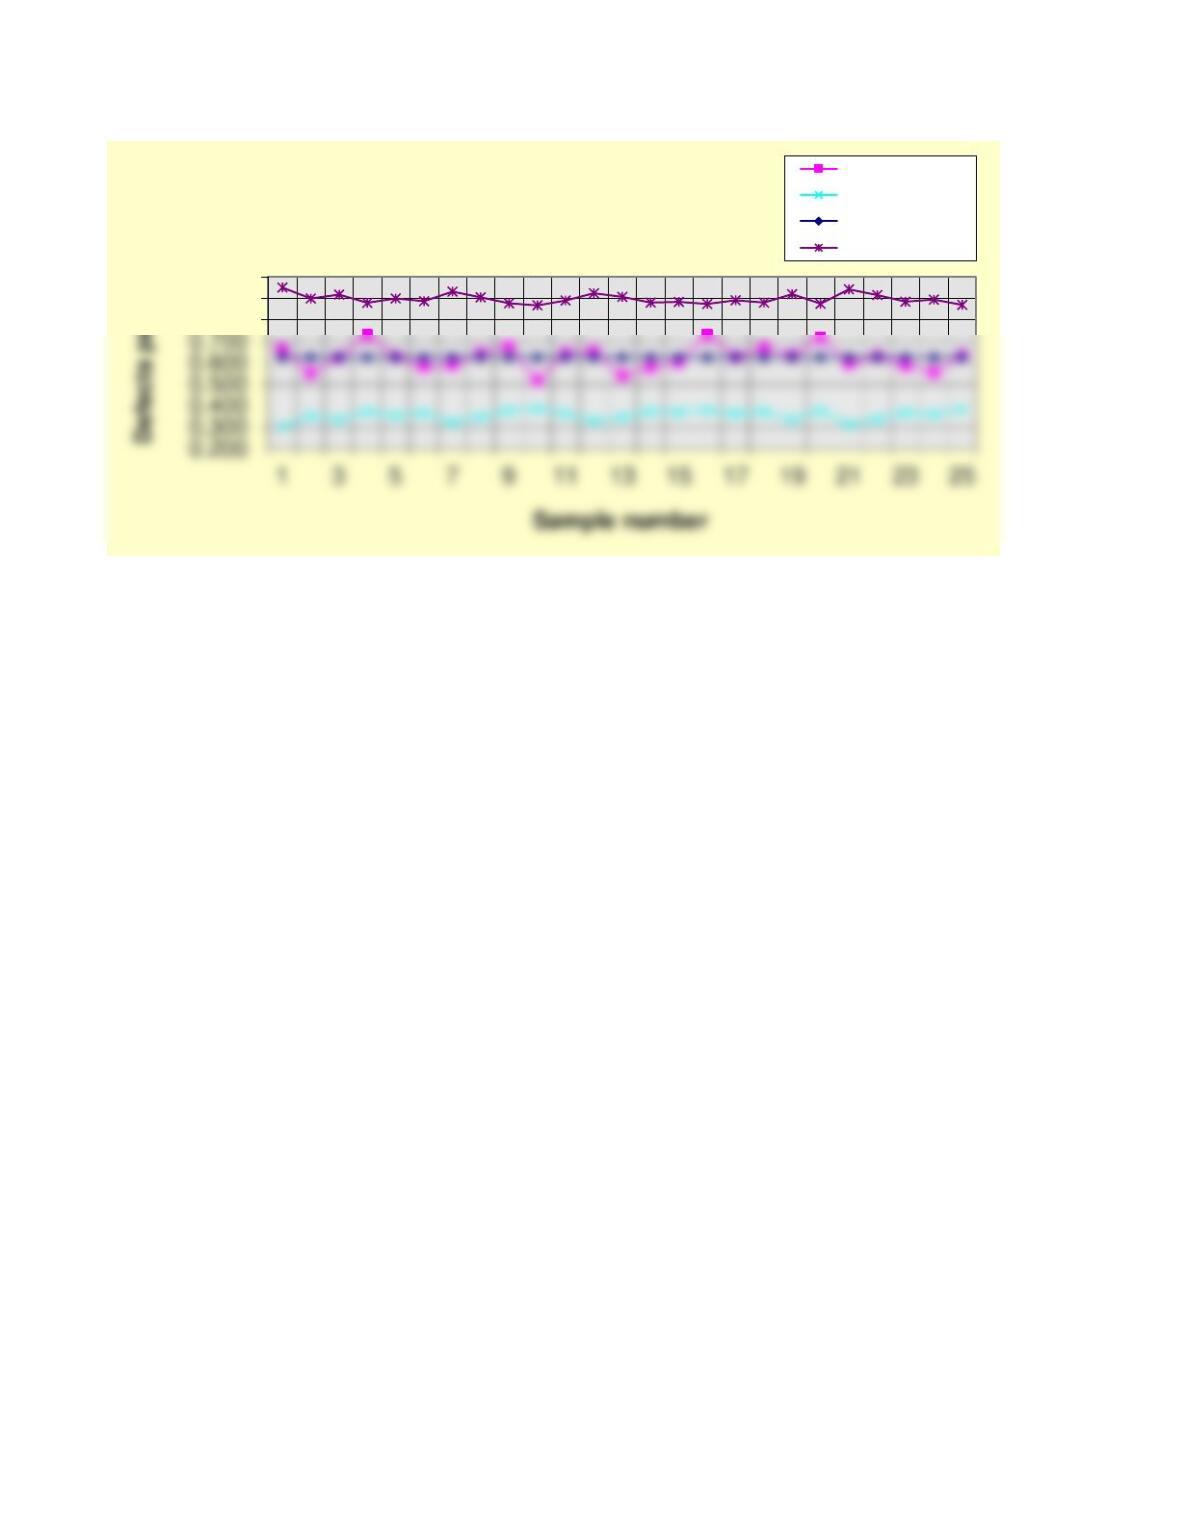
Average Number of Defects Per Unit (u) Chart
This spreadsheet is designed for up to 50 samples. Enter data ONLY in yellow-shaded cells.
Click on the sheet tab to display the control chart (some rescaling may be needed).
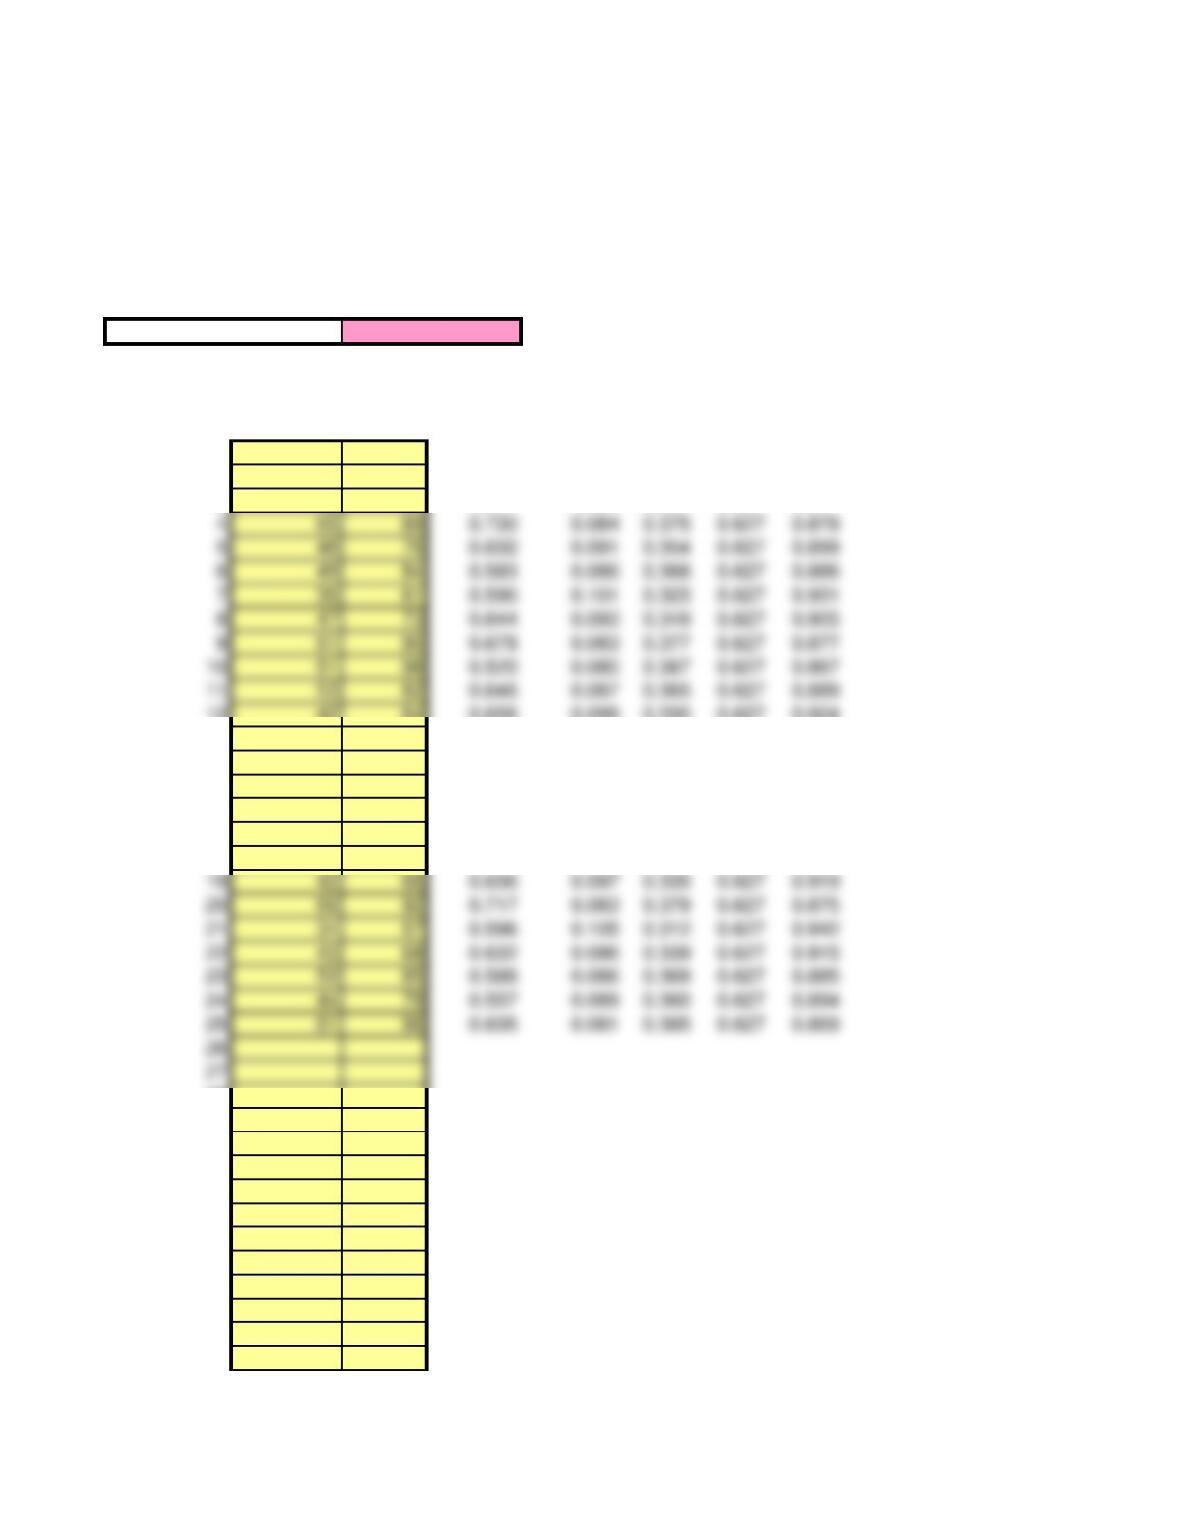
Average (u-bar) 0.6270
Number Sample Defects Standard
Sample of Defects Size per unit Deviation LCLu CL UCLu
136 54 0.667 0.108 0.304 0.627 0.950
242 76 0.553 0.091 0.354 0.627 0.899
342 67 0.627 0.097 0.337 0.627 0.917
12 42 64 0.656 0.099 0.330 0.627 0.924
13 39 72 0.542 0.093 0.347 0.627 0.907
14 51 88 0.580 0.084 0.374 0.627 0.880
15 52 86 0.605 0.085 0.371 0.627 0.883
16 68 93 0.731 0.082 0.381 0.627 0.873
17 51 81 0.630 0.088 0.363 0.627 0.891
18 59 88 0.670 0.084 0.374 0.627 0.880
28
29
30
31
32
33
34
35
36
37
38
39
40
41
42
43
44
45
46
47
48
49
50
0.800
0.900
1.000
Attribute (u) Chart U Values
Lower Control Limit
Center Line
Upper Control Limit