Montvalley Short-Haul Lines, Inc.
Billing Study II
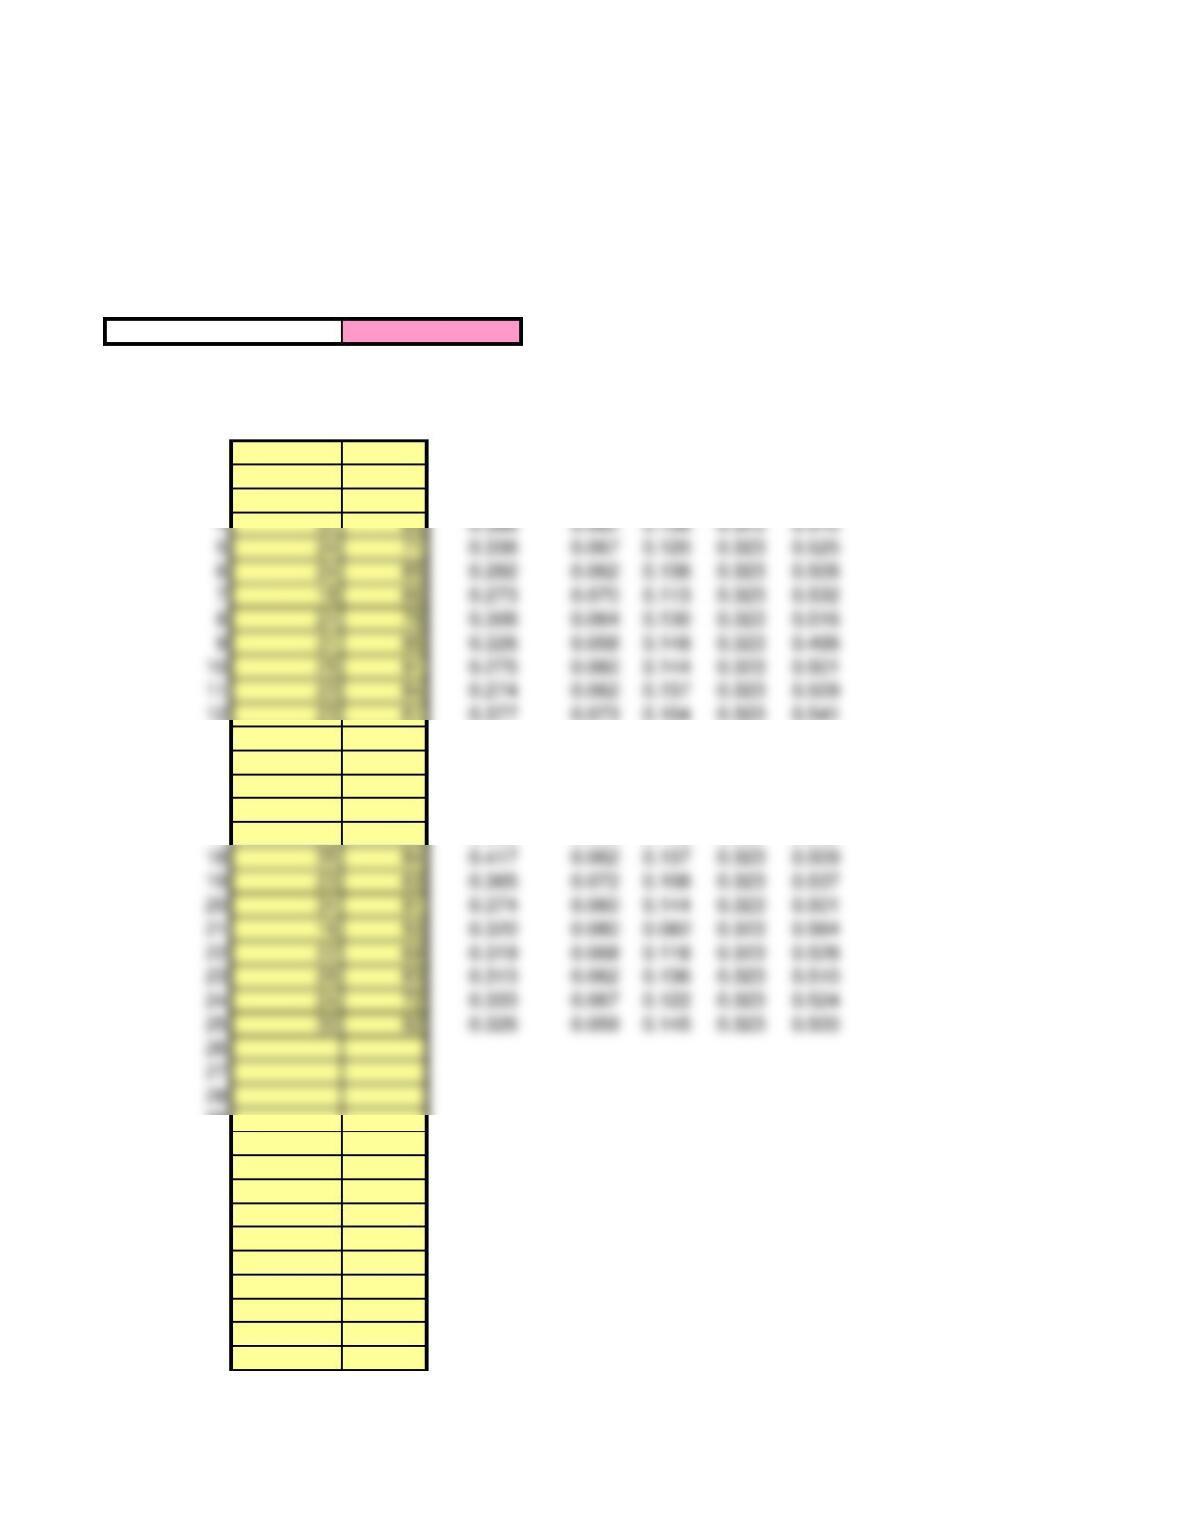
Average Number of Defects Per Unit (u) Chart
This spreadsheet is designed for up to 50 samples. Enter data ONLY in yellow-shaded cells.
Click on the sheet tab to display the control chart (some rescaling may be needed).
Average (u-bar) 0.3227
Number Sample Defects Standard
Sample of Defects Size per unit Deviation LCLu CL UCLu
118 56 0.321 0.076 0.095 0.323 0.550
221 72 0.292 0.067 0.122 0.323 0.524
322 69 0.319 0.068 0.118 0.323 0.528
12 23 61 0.377 0.073 0.104 0.323 0.541
13 20 77 0.260 0.065 0.128 0.323 0.517
14 26 87 0.299 0.061 0.140 0.323 0.505
15 26 80 0.325 0.064 0.132 0.323 0.513
16 33 92 0.359 0.059 0.145 0.323 0.500
17 26 89 0.292 0.060 0.142 0.323 0.503
29
30
31
32
33
34
35
36
37
38
39
40
41
42
43
44
45
46
47
48
49
50
0.600
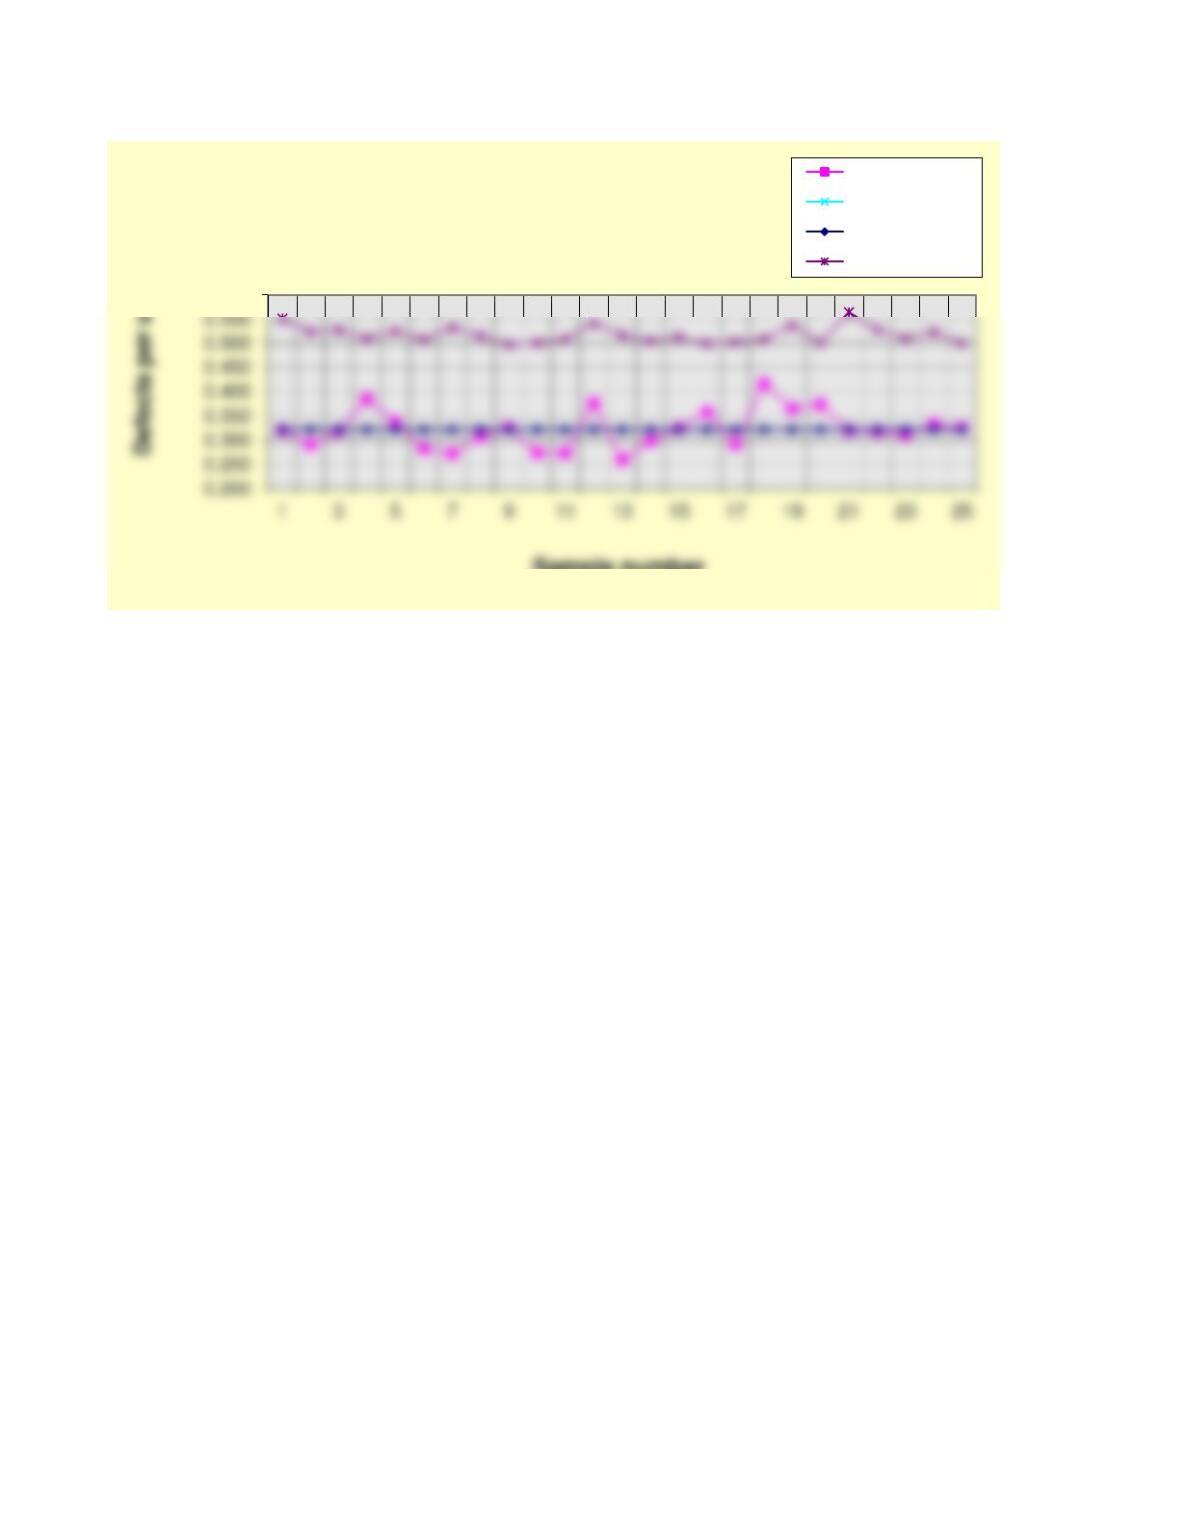
Sample number
Attribute (u) Chart
U Values
Lower Control Limit
Center Line
Upper Control Limit