Chapter 8 – Measuring and Controlling Quality 112
IV. Skyhigh Airlines
The solution to this case involves a fairly straight-forward sequential analysis of the system that
can be obtained by using the following model (note each X = 1 person hour, and the fractions are
additional fractions of person-hours required to complete the task, once it has been started):
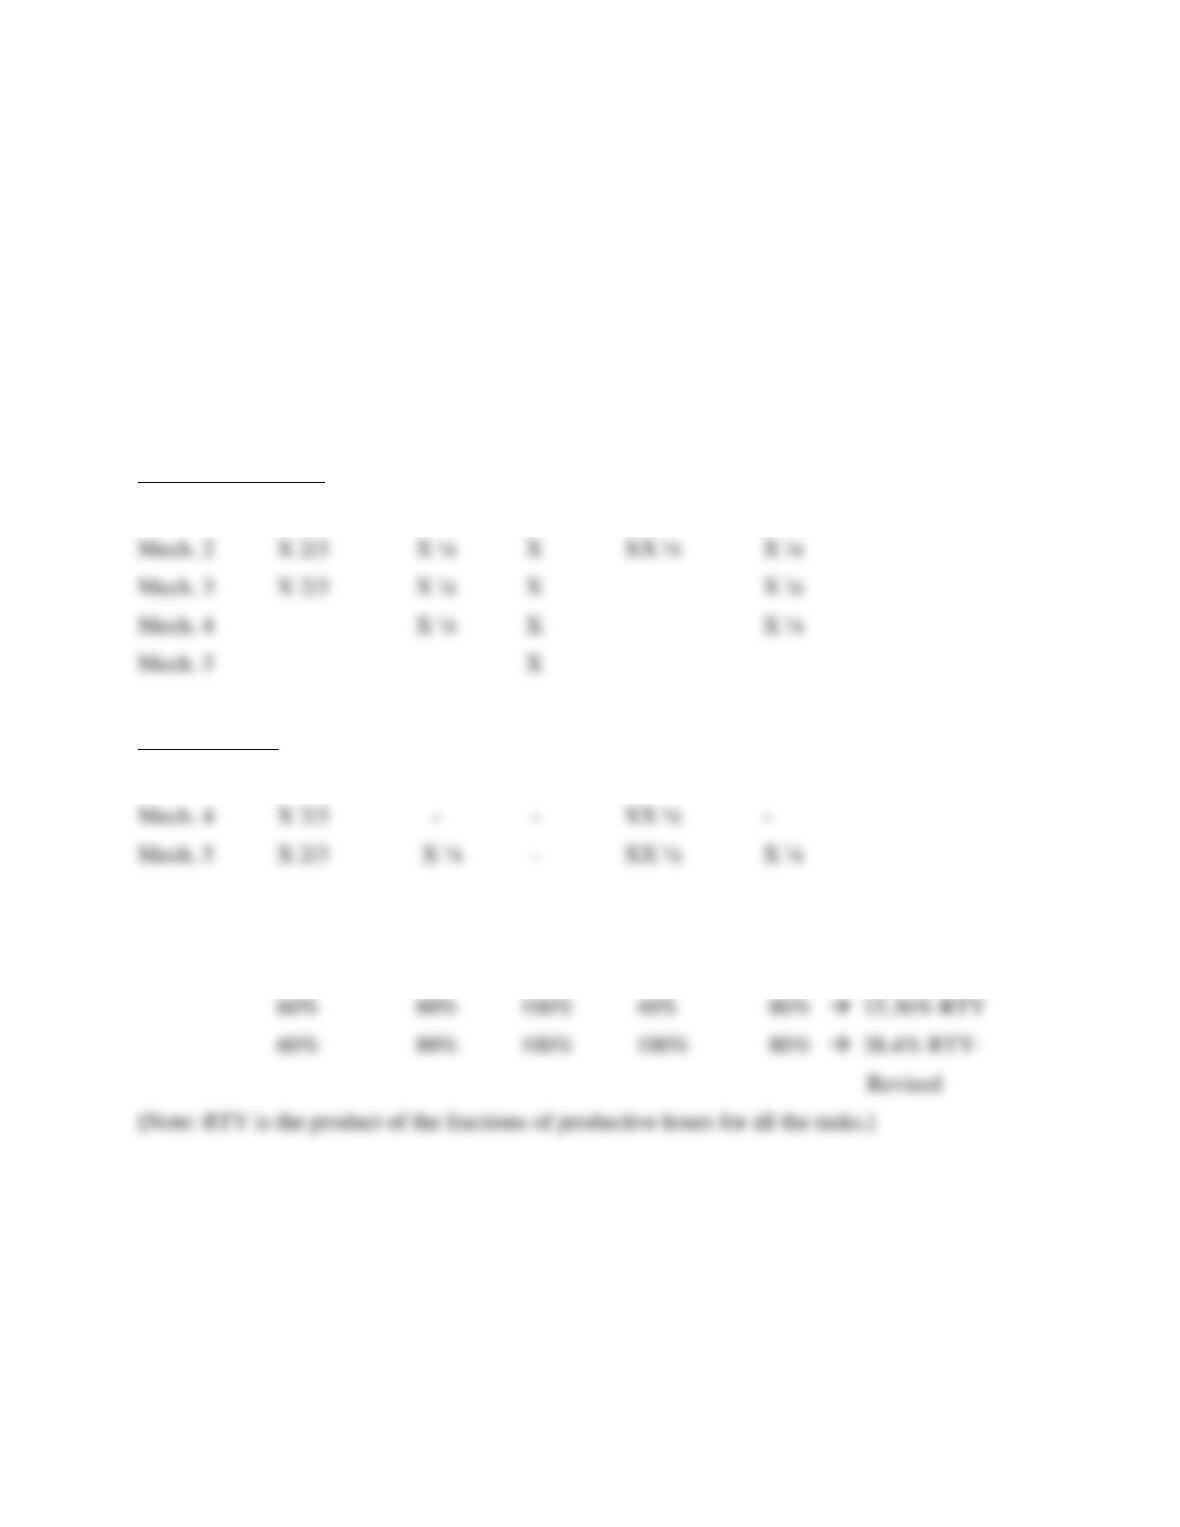
A ————– B ——– C —–—– D ————– E (Tasks) Elapsed Time
Productive Time – Person-hours
Working Mechanics
Mech. 1 X 2/3 X ¼ X XX ½ X ¼ 7.67
Idle Mechanics
Mech. 3 – – 0 XX ½ –
Fraction of productive hrs
5/8.33= 5/6.25= 5/5= 5/12.5= 5/6.25
Thus:
a) How much elapsed time will it take to complete the entire procedure?
1 2/3 + 1 ¼ + 1 + 2 ½ + 1 ¼ = 7.67 hours
b) What percent of time will be productive and what percent will be wasted on each task?
Productive: A = 60%; B= 80%; C = 100%; D = 40%; and E = 80%
Non-productive time will be the reciprocal for each task.
Chapter 8 – Measuring and Controlling Quality 113
c) What is the rolled throughput yield (RTY) of the procedure?
d) If a tool could be developed which would allow all 5 workers to work on task D at the same
time, how would that effect the RTY of the procedure?
INSTRUCTOR RESERVE QIP’s and CASES
Case – Bloomfield Tool Co.
1. See spreadsheet Ch08BloomrrCase.xls in the Instructor Reserve materials for details.
Note that there are some rounding errors in the calculations below that make answers on
the spreadsheet appear slightly different.
Calculations for the repeatability and reproducibility (R&R) study are as follows:
Detailed calculations for the first operator are as follows:
R
Use this method to calculate values for the second operator:
R
R
= (
R
i) / m = (0.0071 + 0.0073) / 2 = 0.0072
Chapter 8 – Measuring and Controlling Quality 114
Square root of a negative number defaults to 0.
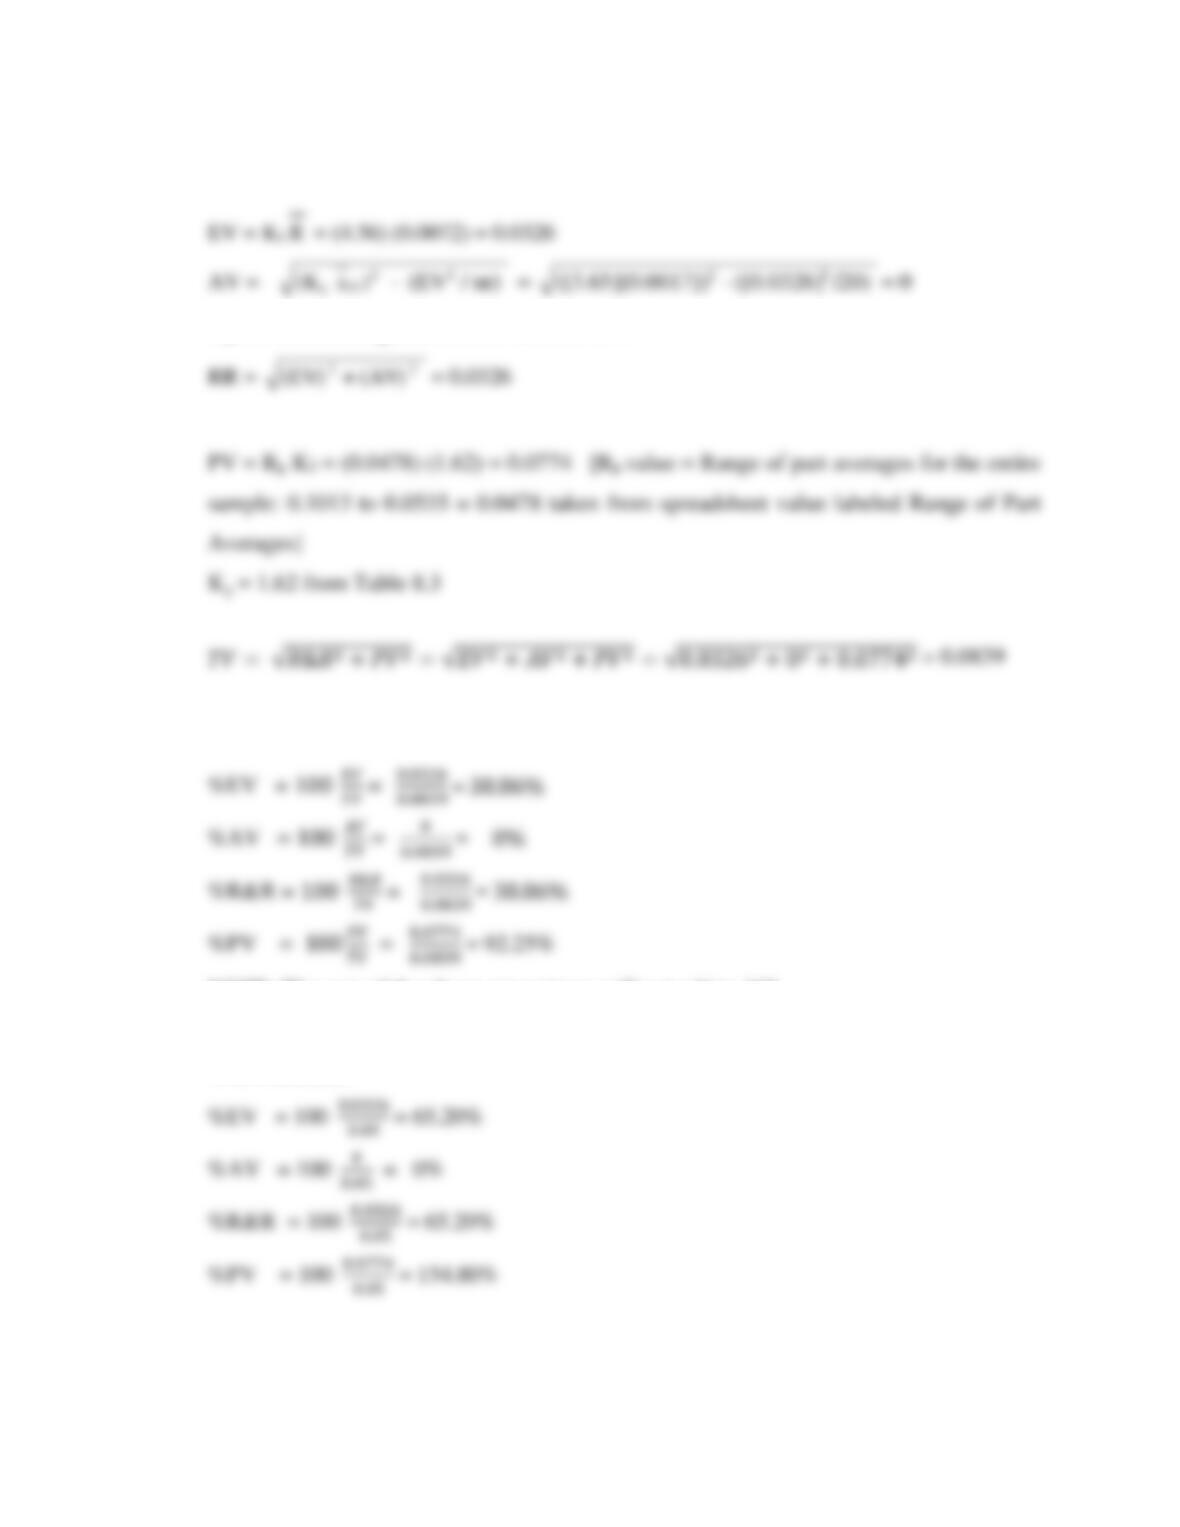
% of Total Variation
NOTE: The sum of the above percentages will not add to 100.
% of Tolerance
Chapter 8 – Measuring and Controlling Quality 115
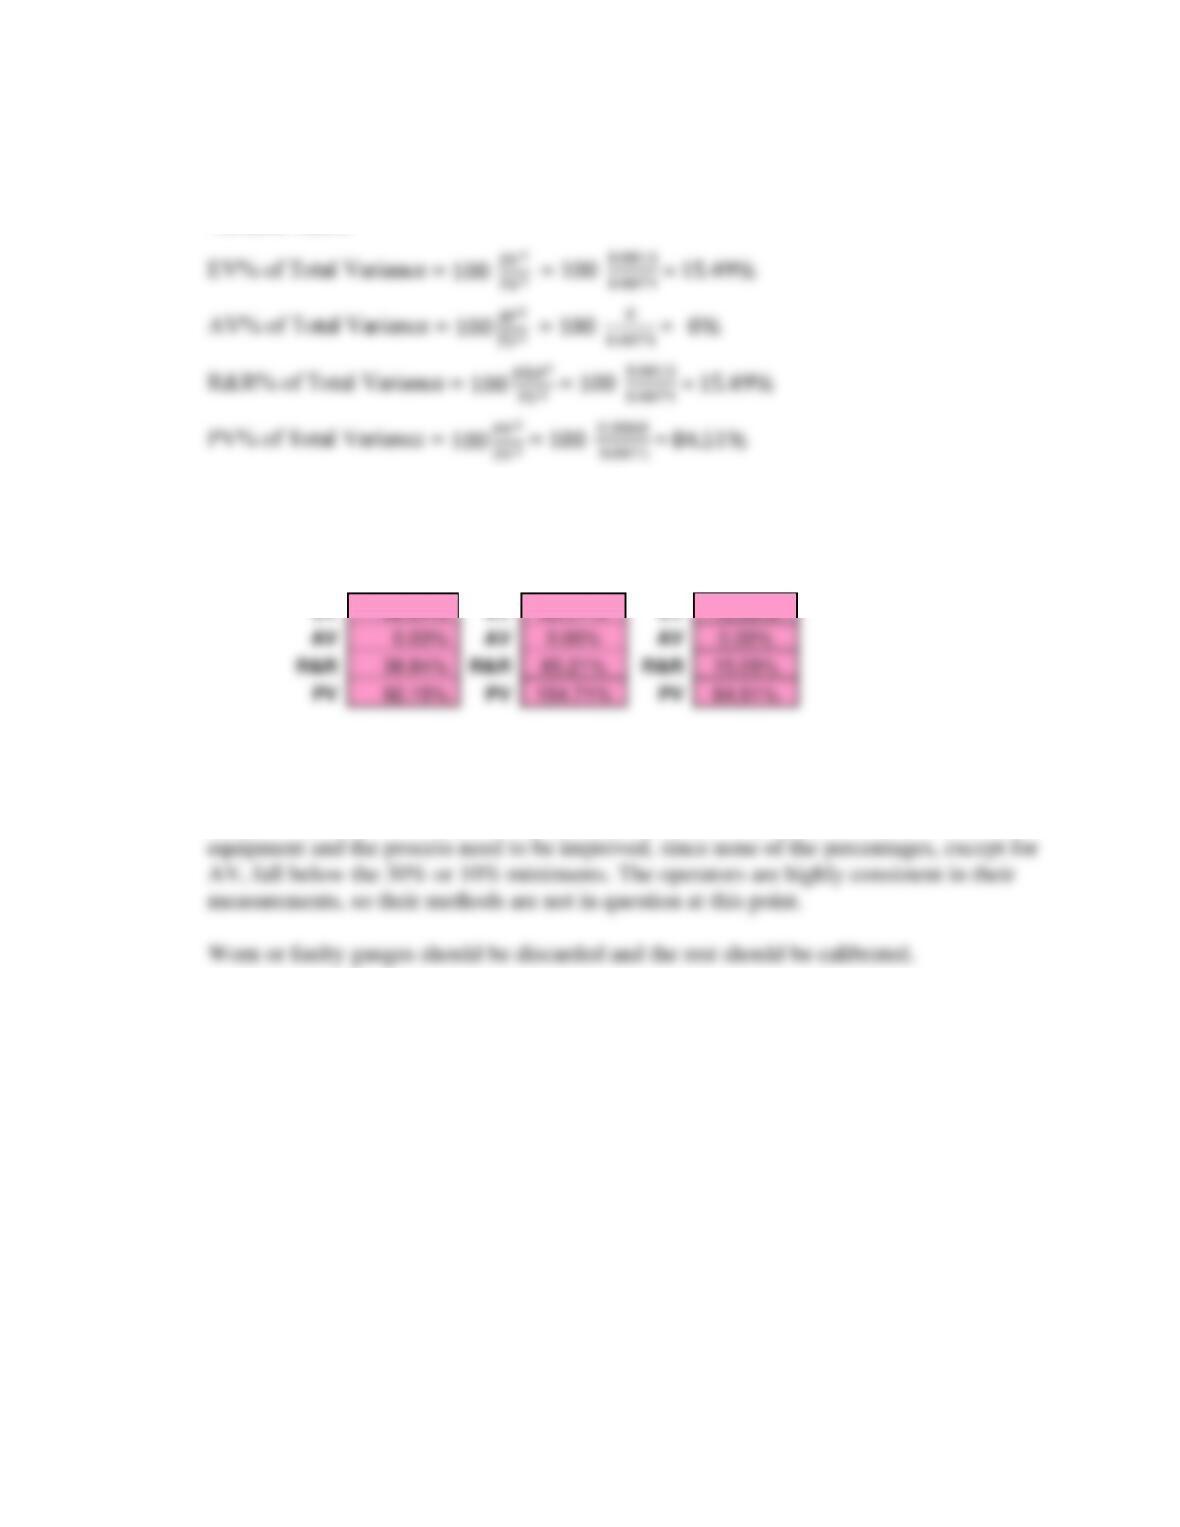
Variance Ratios
For detailed spreadsheet data, see Ch08BloomrrCase.xlsx in the Instructor materials.
Spreadsheet results confirm prior calculations, as follows:
% of Total
Variation
% of Tolerance
Variance Ratios
EV
38.84%
EV
65.21%
EV
15.09%
38.84%
65.21%
15.09%
PV
92.15%
PV
PV
84.91%
Concentrate on reducing equipment variation
Based on the “rules” for process capability given in the text, it can be assumed that the
Case – Hydraulic Lift Company
1. The key to the calculation of an estimated process capability for this case is to calculate an
estimated standard deviation for each condition. Using the simplifying assumption that the
sample standard deviation is a good approximation of the population standard deviation will
allow us to make a reasonable estimate, even though for the cases of the small sample sizes
of 30 or 35 that assumption would be open to argument by statisticians.
We will concentrate on the calculation of Cp for only case (a) and (e), since it is obvious that
the capability became drastically worse during the experimental stages from (b) to (d).
Reading the data from the histograms, we can use the calculation of the sample standard
deviation with grouped data from the chapter. The frequency histogram for condition (a)
shows:
Chapter 8 – Measuring and Controlling Quality 116
mp,
Group x Frequency fx fx2
_________________________________________________
1 45 3 135 6075
2 50 6 300 15000
fx 7310
x
= n = 100 = 73.1
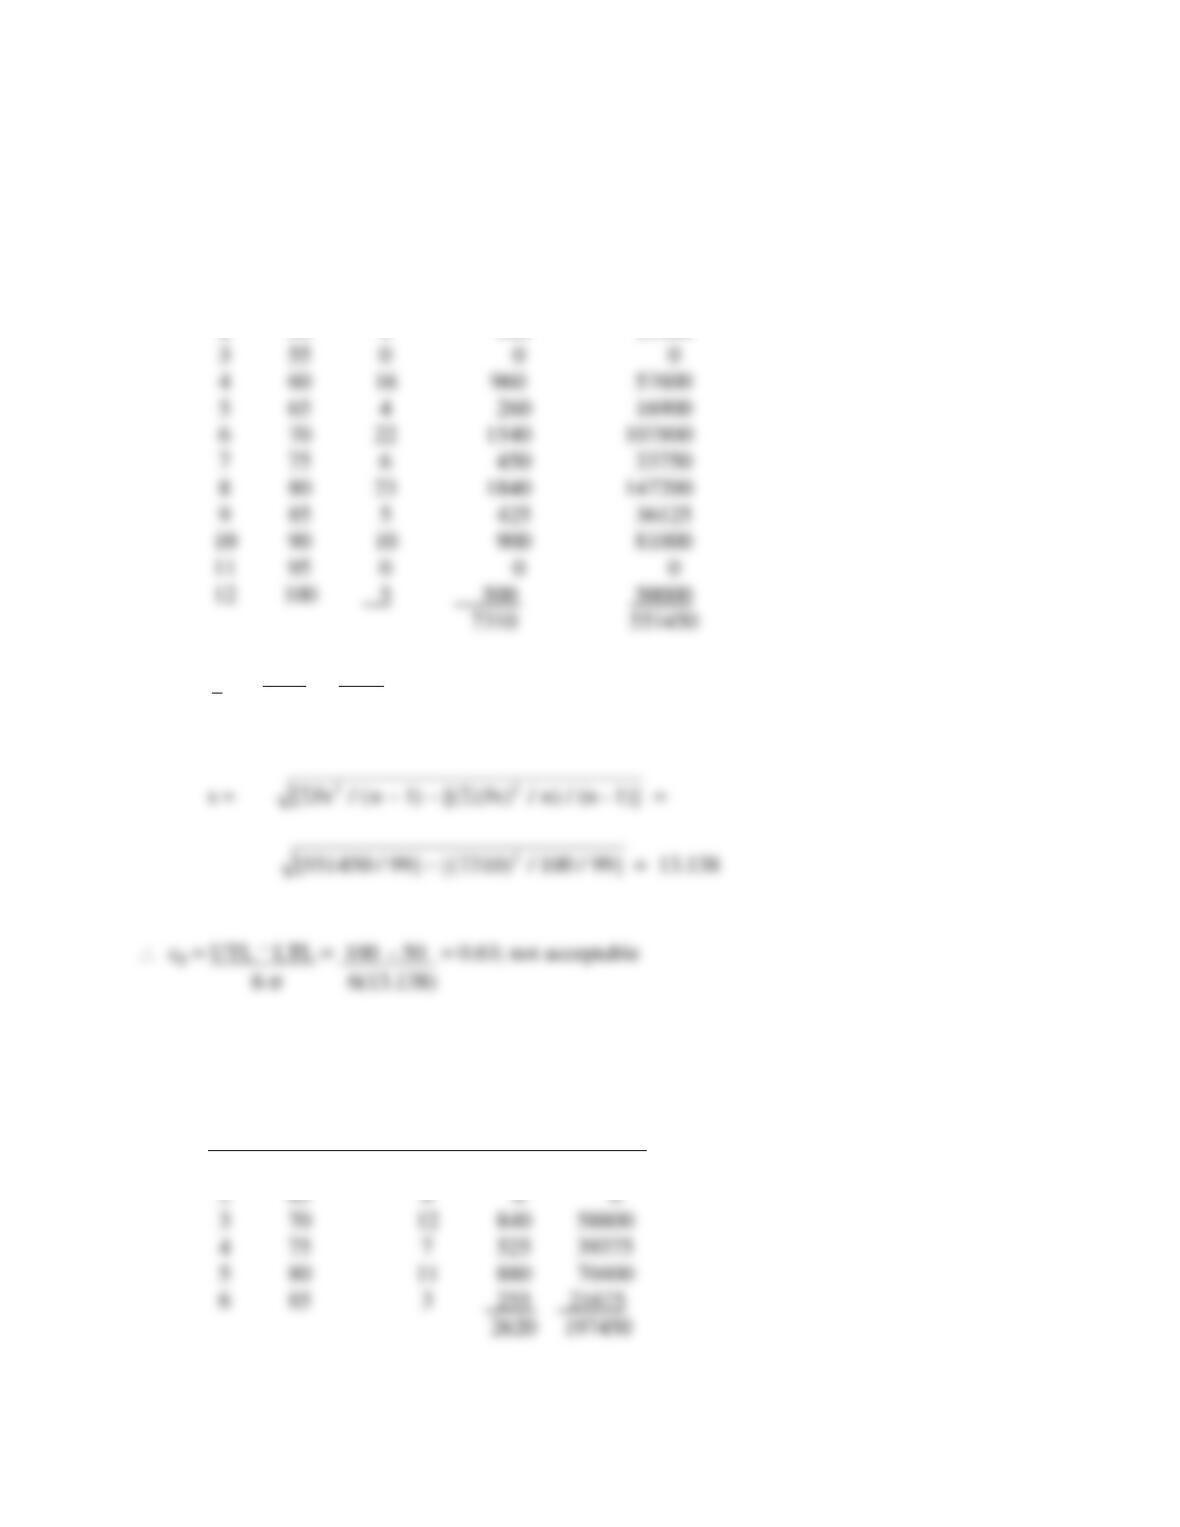
The frequency histogram for condition (e) shows:
mp,
Group x Frequency fx fx2
_______________________________________
1 60 2 120 7200
Chapter 8 – Measuring and Controlling Quality 117
fx 2620
x
= n = 35 = 74.857
2. The process used here was obviously a systematic process of problem solving similar to the
one suggested in this chapter. The first step was a) to understand the “mess.” A Pareto-like
approach found that 50% of the defective items were due to dimensional problems on one
Case – Knight Industries
Knight Industries’ data can be analyzed in three ways. The measures are interrelated, so they
may be looked at individually, in groups, and by control charts. (See spreadsheets labeled:
Chapter 8 – Measuring and Controlling Quality 118
On the surface, it seems that this variable would not need to be charted continuously. A reading
could be taken, at random and infrequently, to evaluate whether further testing should be done.
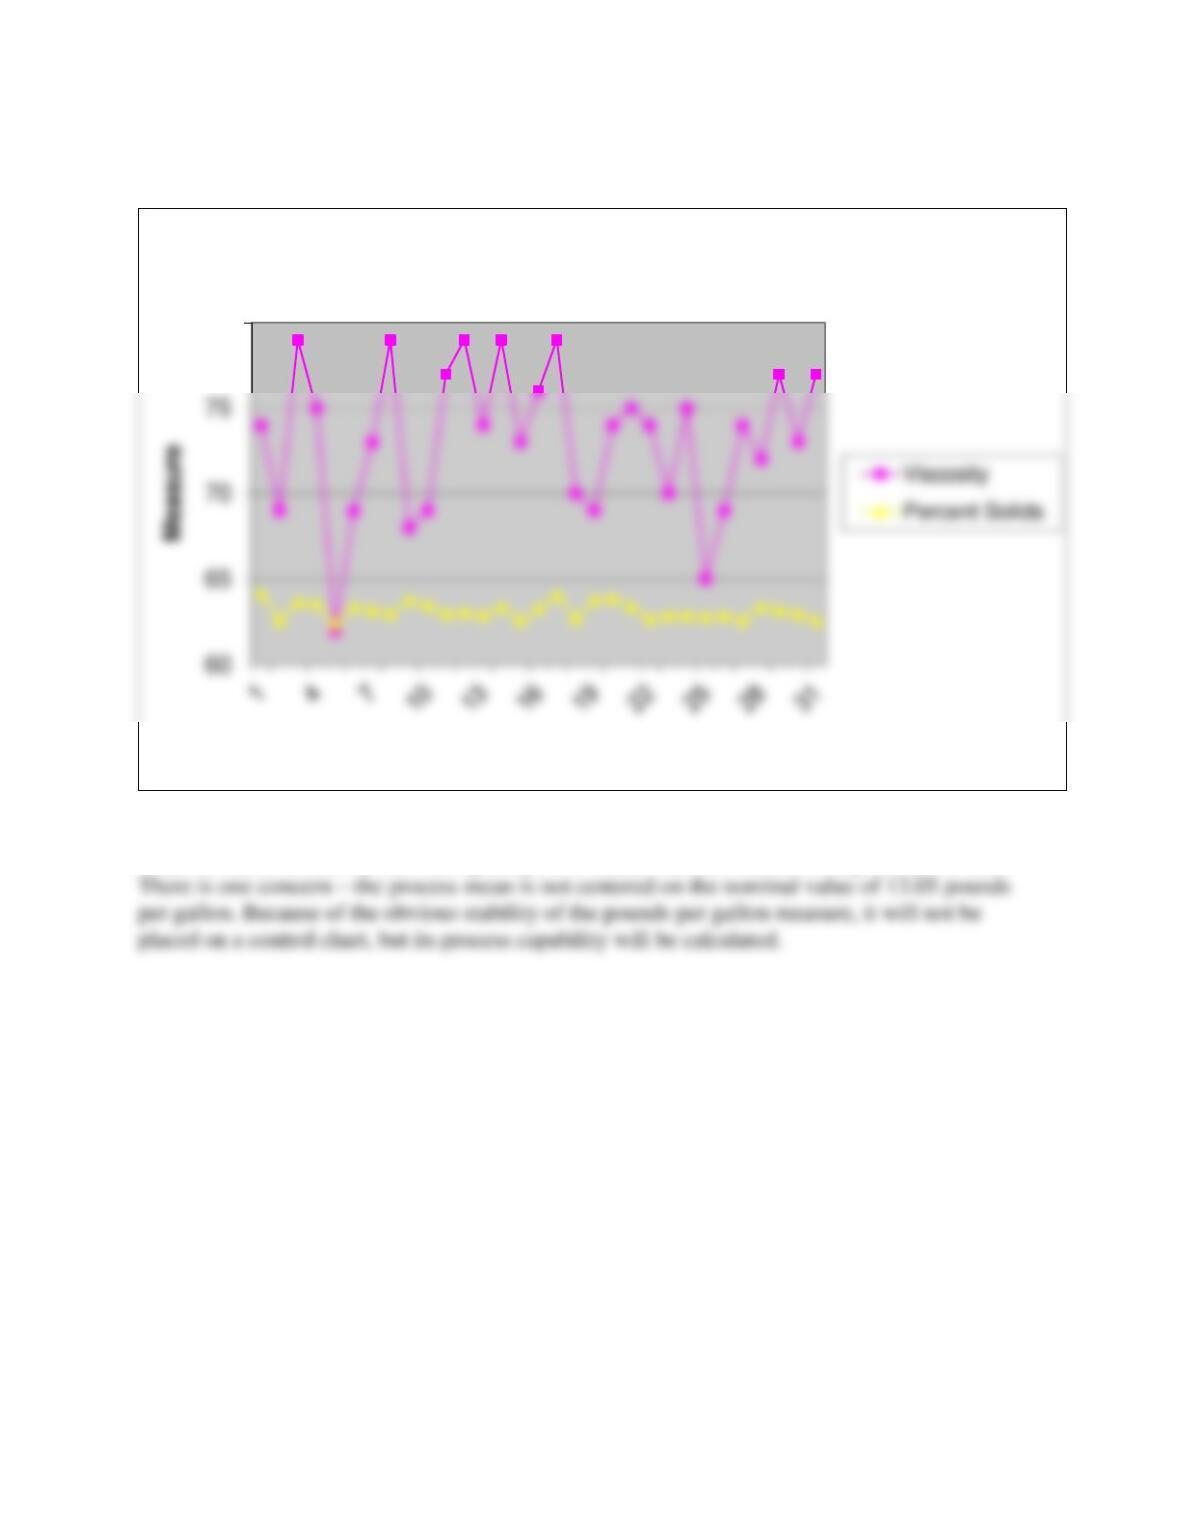
The other two variables, viscosity and solids, show much more variability than the pounds per gallon measure. (See
Scatter Diagram, above) They should be closely watched and carefully controlled. Values for the sample means and
standard deviations versus their specification limits are:
Viscosity
Percent
Solids
Lb./Gal.
Mean
74.146
63.056
13.261
Std. Dev.
4.569
0.511
0.080
Spec. Limits
60-80
60-65
12.6-13.5
80
Batches
Knight Industries – Scatter Diagram
Chapter 8 – Measuring and Controlling Quality 119
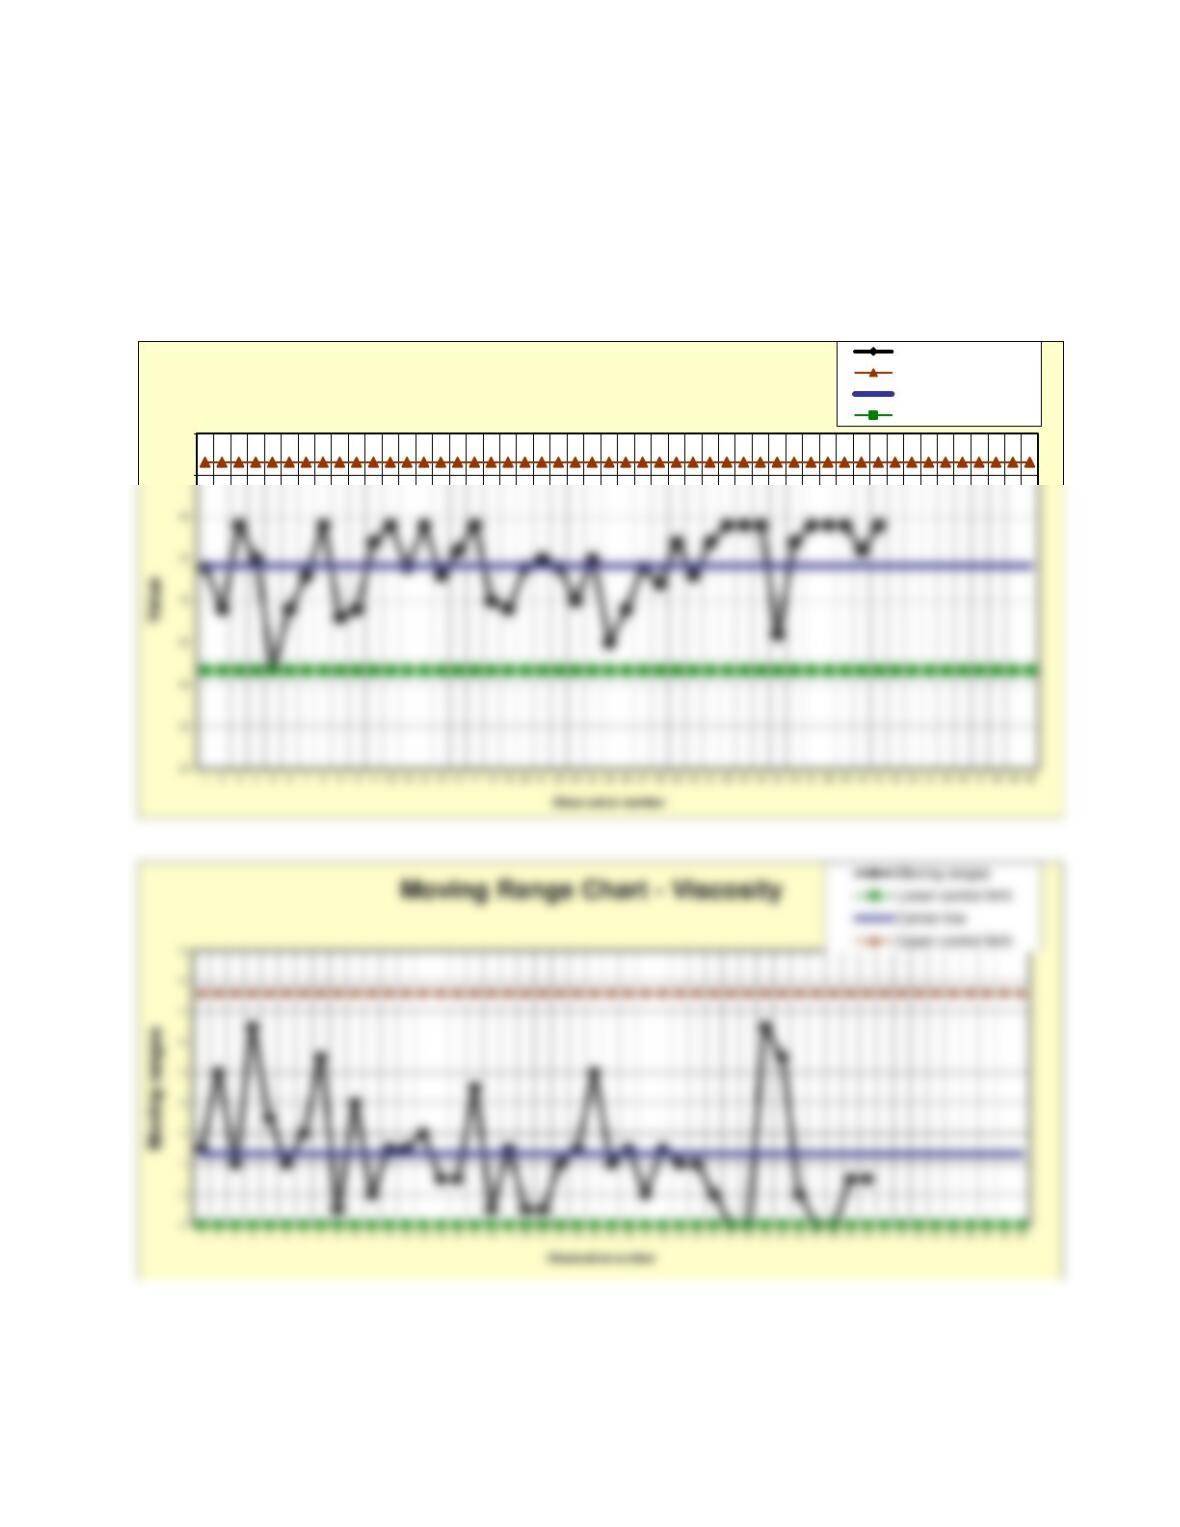
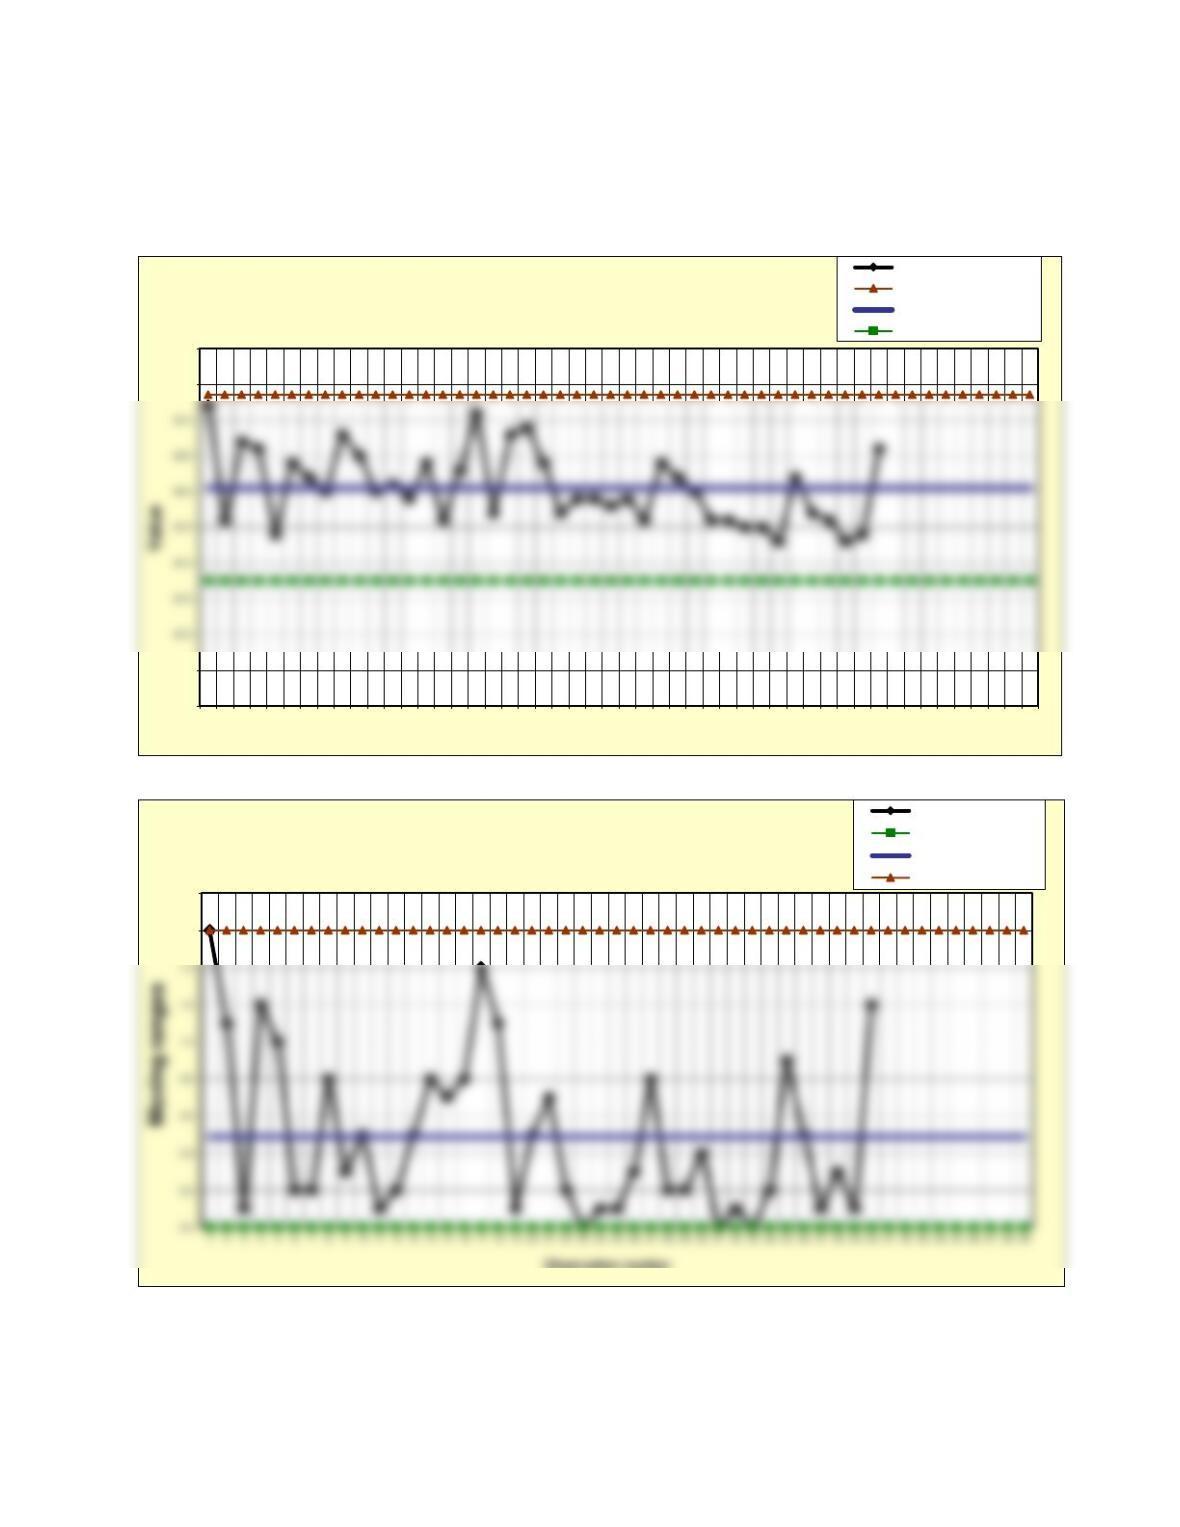
Statistical Control of Viscosity and Solids
Analysis of viscosity and solids required use of charts for individuals, since each of the measures
was from a chemical process, from which each sample was taken individually. Results show:
85
90
Individuals (X) Chart – Viscosity Individuals
Upper control limit
Center line
Lower control limit
Chapter 8 – Measuring and Controlling Quality 120
Solids
Although there was a sample on each of the charts that was just inside the control limits, the
measures for both variables appear to be stable and under control.
60.0
60.5
64.5
65.0
1 2 3 4 5 6 7 8 9 10 11 12 13 14 15 16 17 18 19 20 21 22 23 24 25 26 27 28 29 30 31 32 33 34 35 36 37 38 39 40 41 42 43 44 45 46 47 48 49 50
Observation number
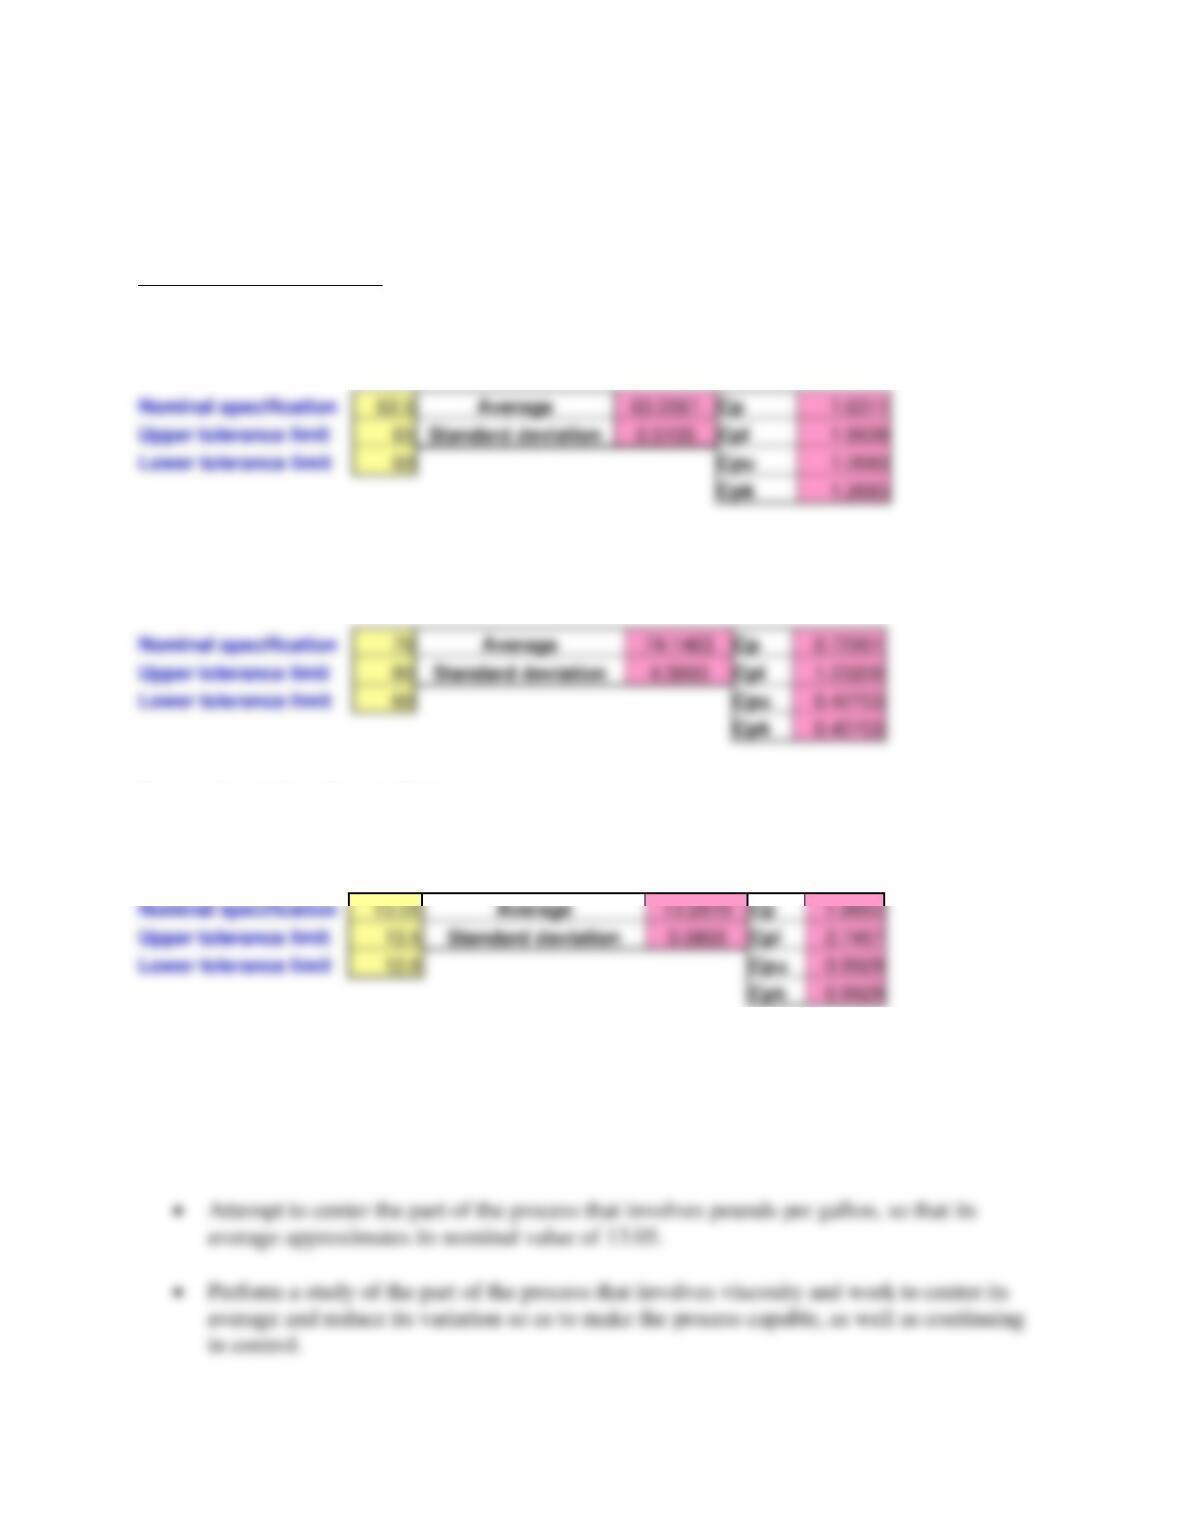
Individuals (X) Chart – Solids Individuals
Upper control limit
Center line
Lower control limit
1.6
1.8
Observation number
Moving Range Chart – Solids
Moving ranges
Lower control limit
Center line
Upper control limit
Chapter 8 – Measuring and Controlling Quality 121
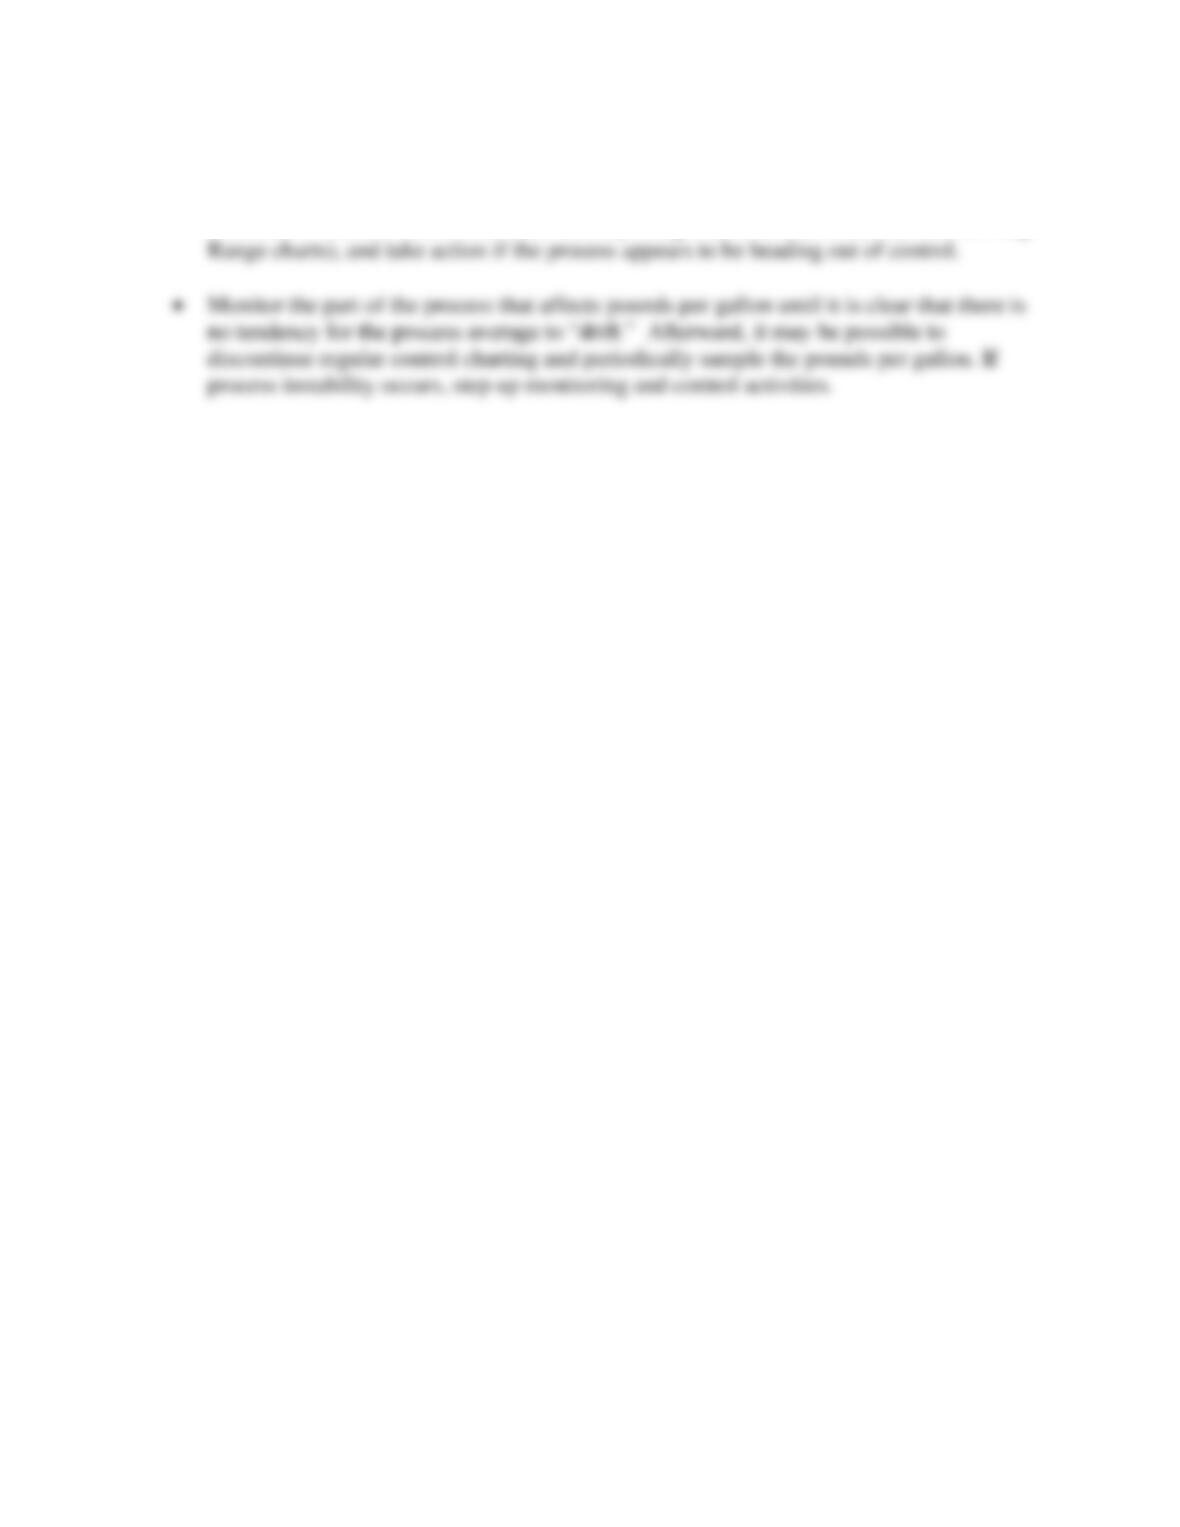
Process Capability- Solids
The process capability for solids is good, although not quite at the ideal level of 2.0 for all
measures as shown here:
Process Capability- Viscosity
The process capability for viscosity is not good, as shown here:
Process Capability- Pounds/Gallon
The process capability for pounds per gallon is not as good as it might be, as shown here:
The report to the plant manager would include the analysis presented above. It should also
include the recommendations that he/she:
• Work to center the part of the process that controls solids, so that the measure averages
its nominal value of 62.5.
Chapter 8 – Measuring and Controlling Quality 122
• Continue to monitor both solids and viscosity using charts for individuals (x and Moving