19
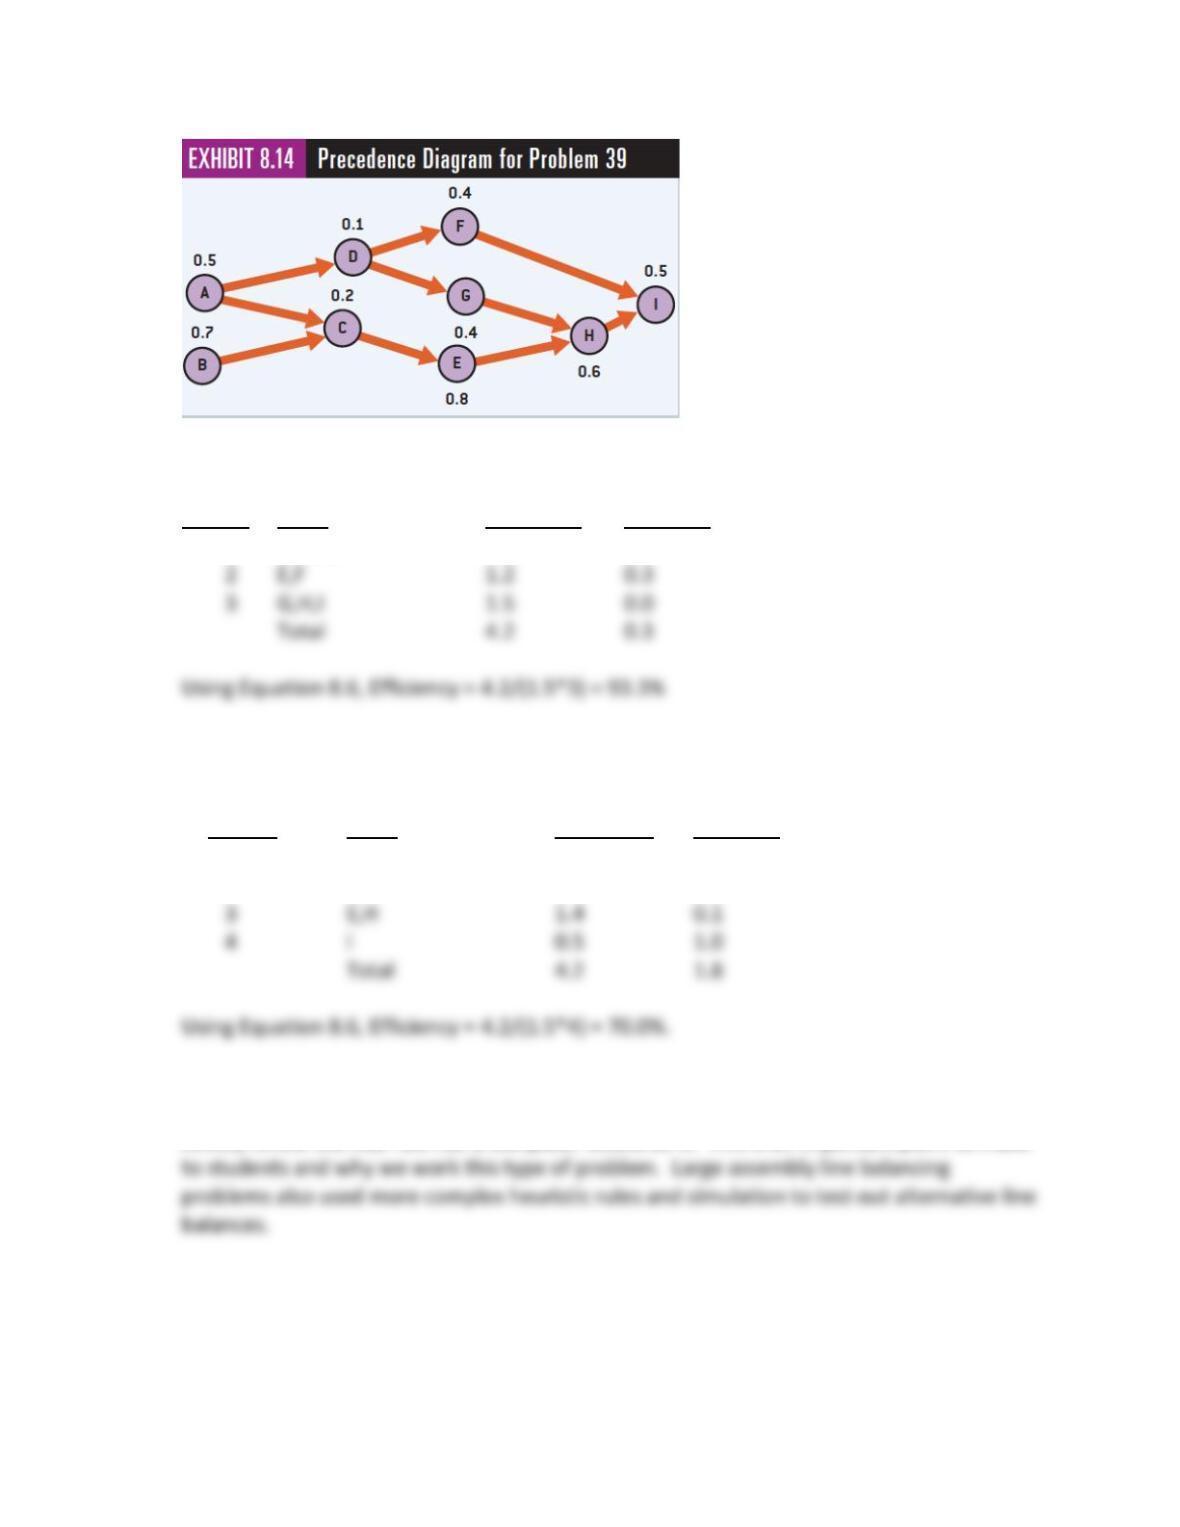
Longest task time first rule:
Station Tasks Total time Idle Time
1 B,A,C,D 1.5 0.0
40. For the assembly line described in problem 39, how would the line be balanced by
choosing the assignable task having the shortest task time first?
Station Tasks Total Time Idle Time
1 A,D,F,G 1.4 0.1
2 B,C 0.9 0.6
The conclusion is that the assembly line balancing rule does make a difference in line
balancing solutions and therefore, must be carefully chosen and monitored. The idea is to
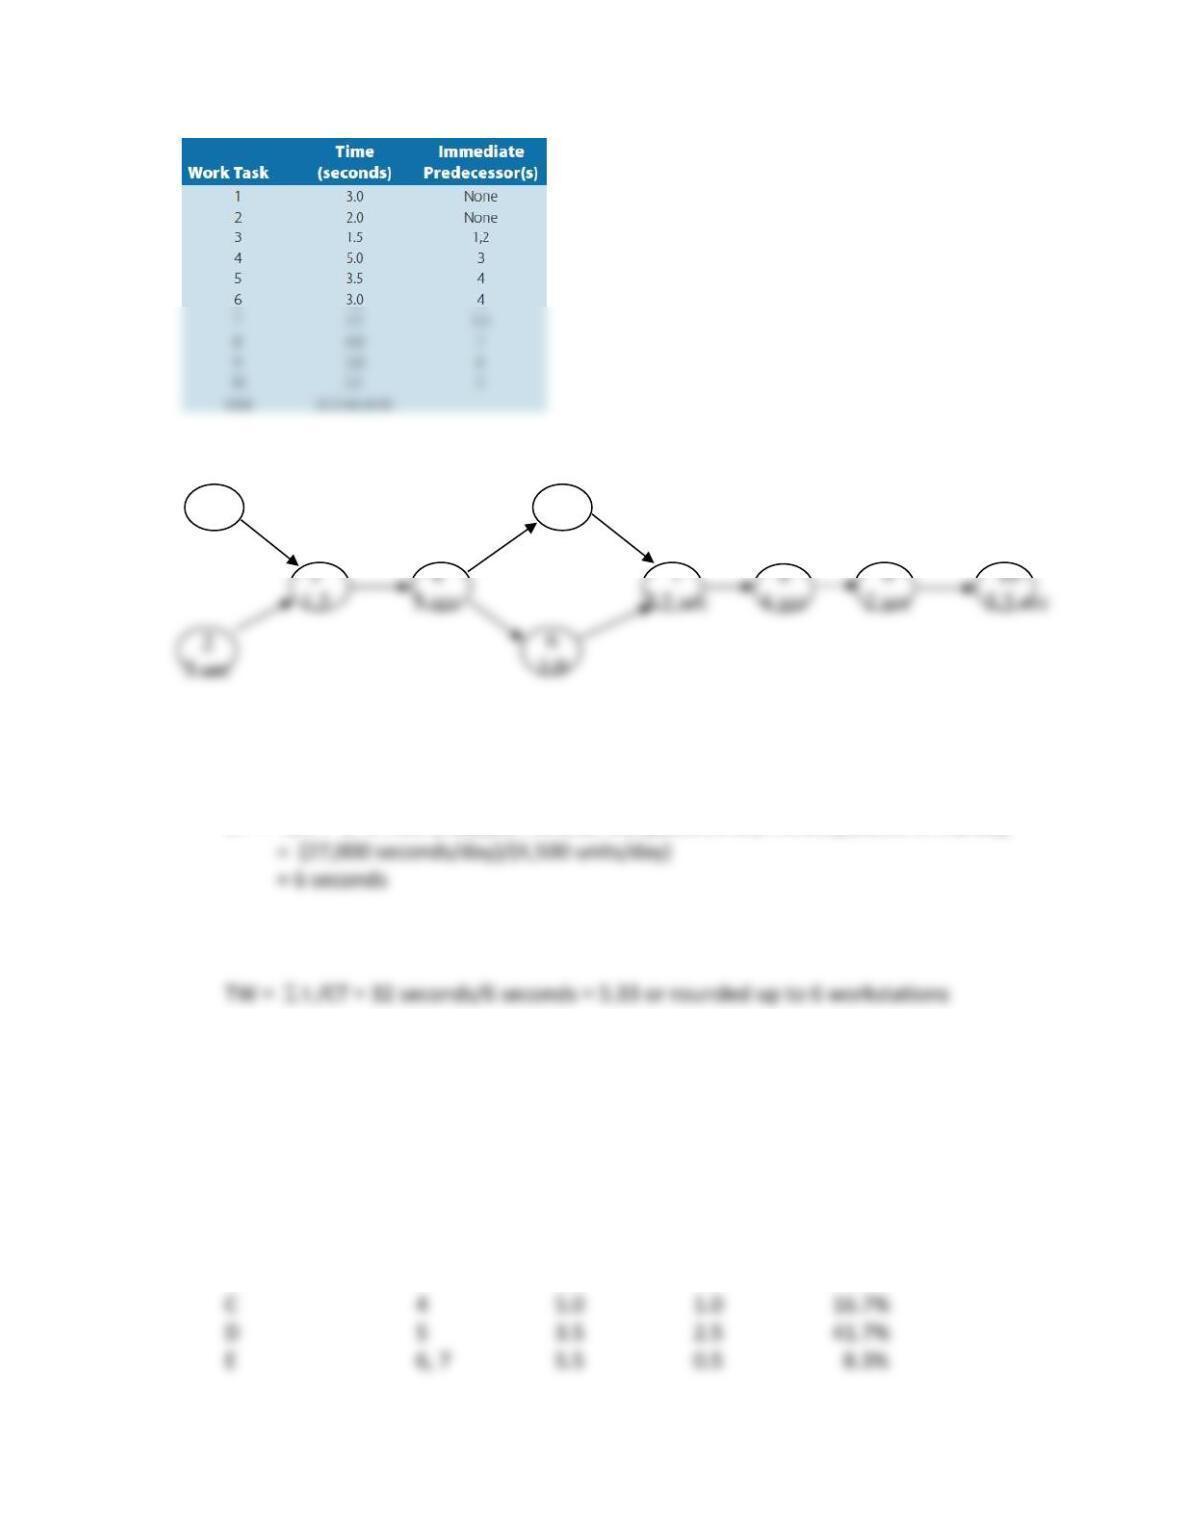
41. To make one particular model of a personal digital assistant (PDA) on an assembly line, the
work content is defined by the ten tasks below.
20
a. Draw the precedence diagram for this assembly line.
3
4
5 sec
8
4 sec
9
2 sec
5.5 sec
b. What is the cycle time if you want to produce 4,500 PDAs per workday assuming 7.5
hours per day?
CT = A/R = (7.5 hours/day)(60 minute/hour)(60seconds/minute)/(4,500 units/day)
c. What is the theoretical minimum number of workstations to balance this line?
d. Using the largest task time first decision rule with the shortest task time rule being used
for breaking ties, balance this assembly line. (Make sure you do not violate precedent
relationships and the total work per workstation must be less than or equal to 6
seconds.)
Workstation Tasks Total Time Idle Time Idleness %
A 1, 2 5.0 1.0 16.7%
B 3 1.5 4.5 75.0%
1
3 sec
5
3.5 sec

21
e. Compute process efficiency and evaluate the resulting balance in part d.
Total Time Available = Number work stations x Cycle Time = N*CT = 7*6 seconds
= 42 seconds
f. Comment on the results
The assembly line balance efficiency is rather low. Unit costs would also be high with this
balance because we need seven workstations instead of the ideal number of six, and we
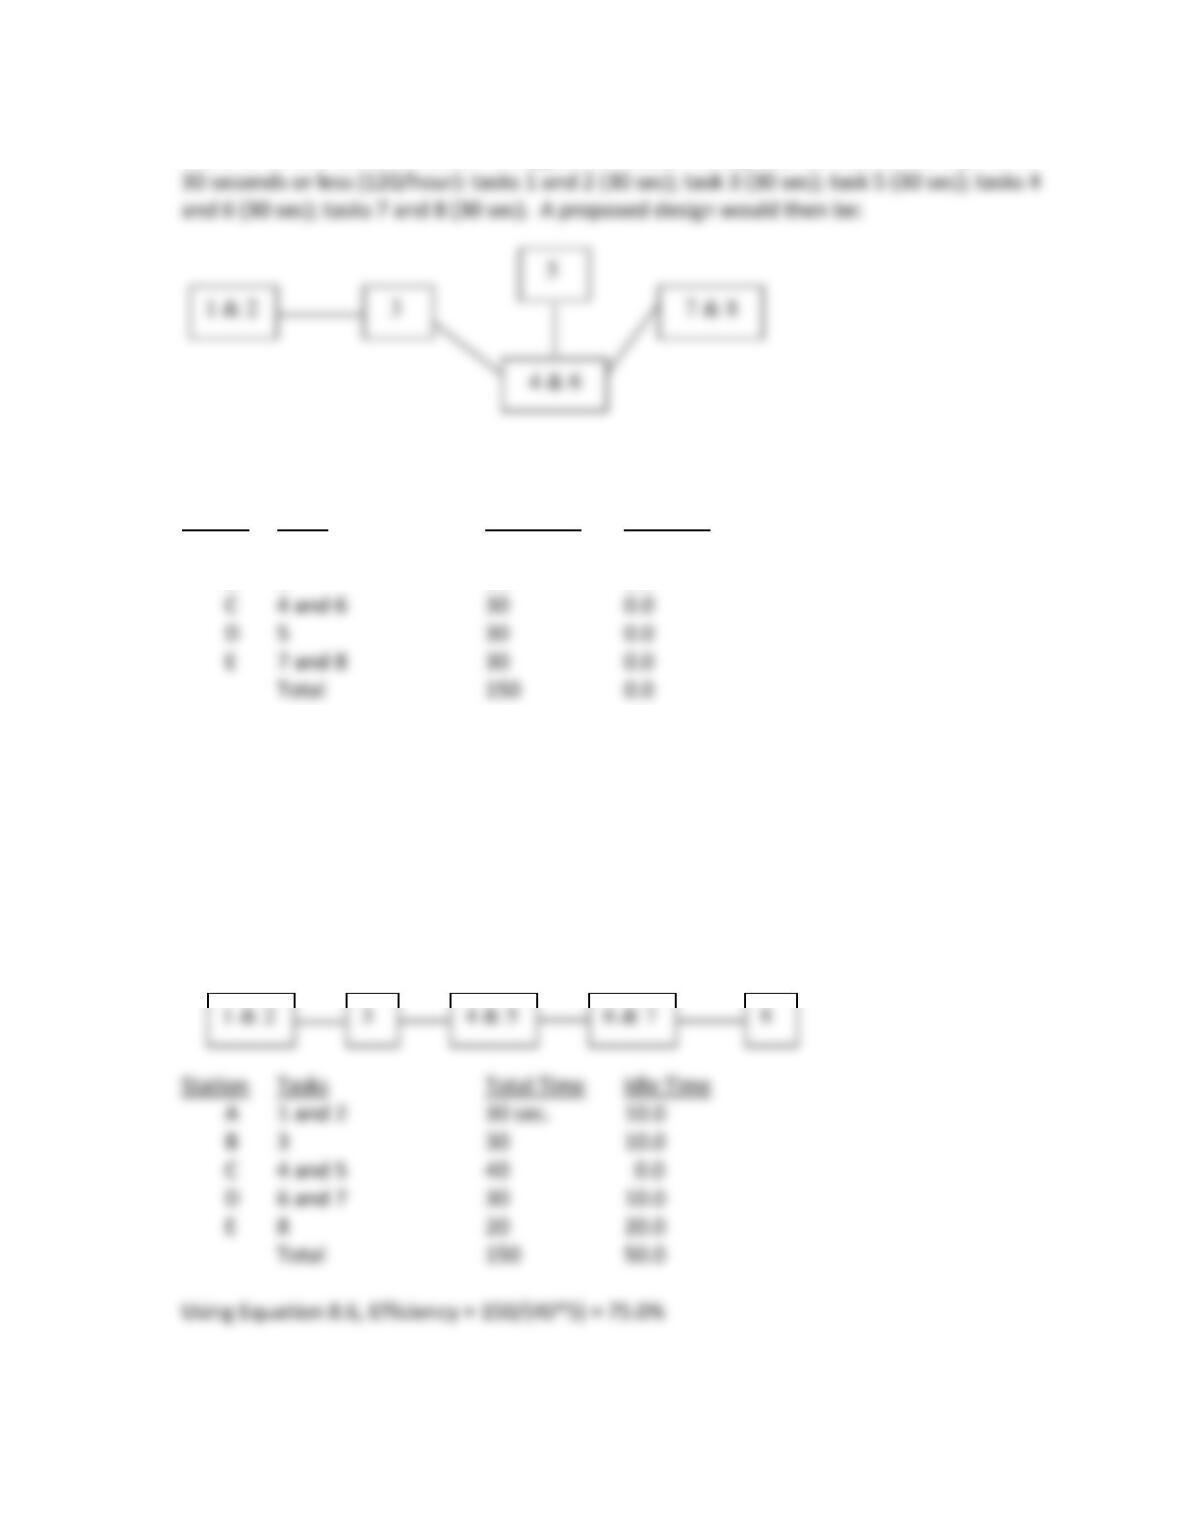
42. For the in-line skate assembly example in this chapter, suppose the times for the individual
operations are as follows:
22
There is no one correct answer. A suggested solution is to group operations having a CT of
The line would be perfectly balanced (100% efficient).
Station Tasks Total time Idle Time
A 1 and 2 30 sec. 0.0
B 3 30 0.0
Using Equation 8.6, Efficiency = 150/(30*5) = 100.0%
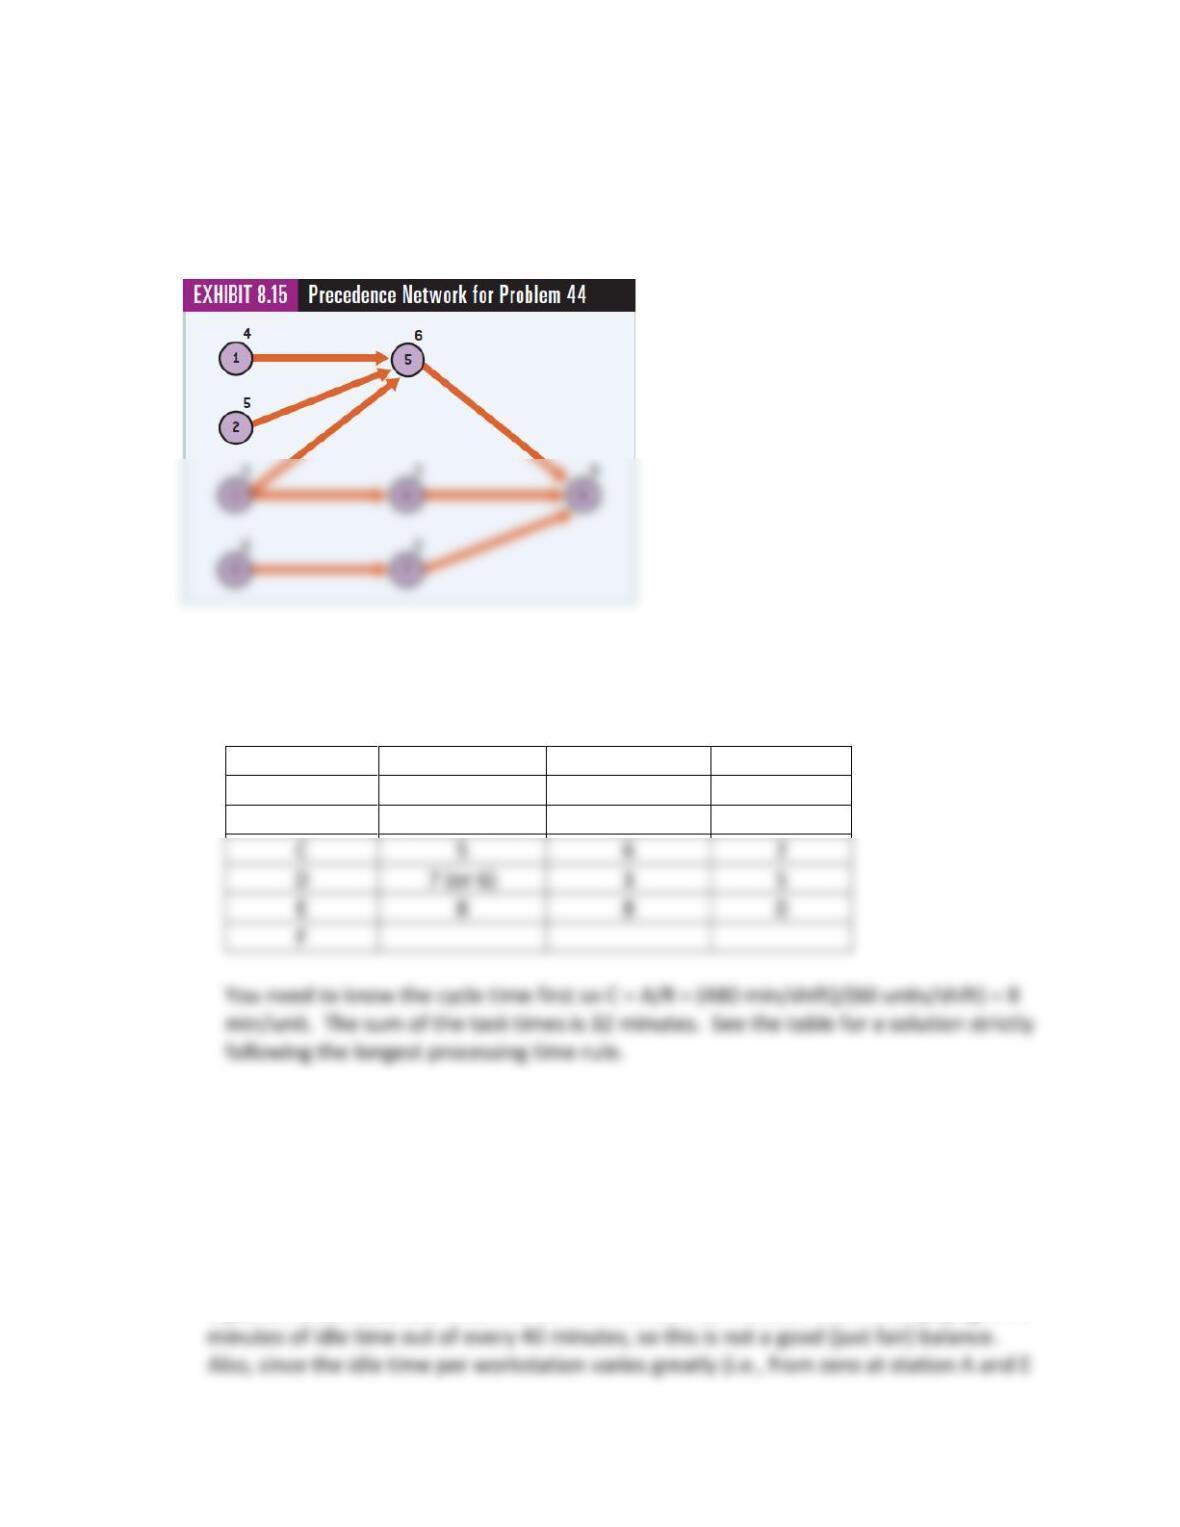
43. For the in-line skate example described in Problem 42, design a production line to achieve
an output rate of 90 per hour.
For 90 parts/hour, each station needs to have a work content of 40 sec. or less. A
configuration is shown below. There would be a lack of work delay before tasks 4 and 5, and
flow blocking delay before tasks 6 and 7, and before task 8.
23
44. You have been asked to set up an assembly line to assemble a computer mouse. The
precedence network is shown in Exhibit 8.15; task times in minutes are given in
parentheses. There are 480 minutes of assembly time per shift and the company operates
one shift each day. The required output rate is forecasted to be 60 units per shift.
a. Balance the assembly line using the longest processing time rule. State the tasks
associated with each workstation, total time, and idle time.
Work Station
Assigned Tasks
Total Time
Idle Time
A
2, 4, 3
8 minutes
0 minutes
B
1, 6 (or 7 tie)
7
1
C
6
2
D
3
5
E
8
0
b. What is the assembly-line efficiency?
Equation 8.6 is Assembly-Line Efficiency = t/ (N*CT) = 32 minutes/(5*8.0) = 80.0%
c. Is your assembly line balance solution good or bad? What criteria do you use to make
this assessment? Explain.
Equation 8.5 is Total Idle Time = N*CT – t = 5*8.0 – 32 = 8 min. The firm is paying for 8
24
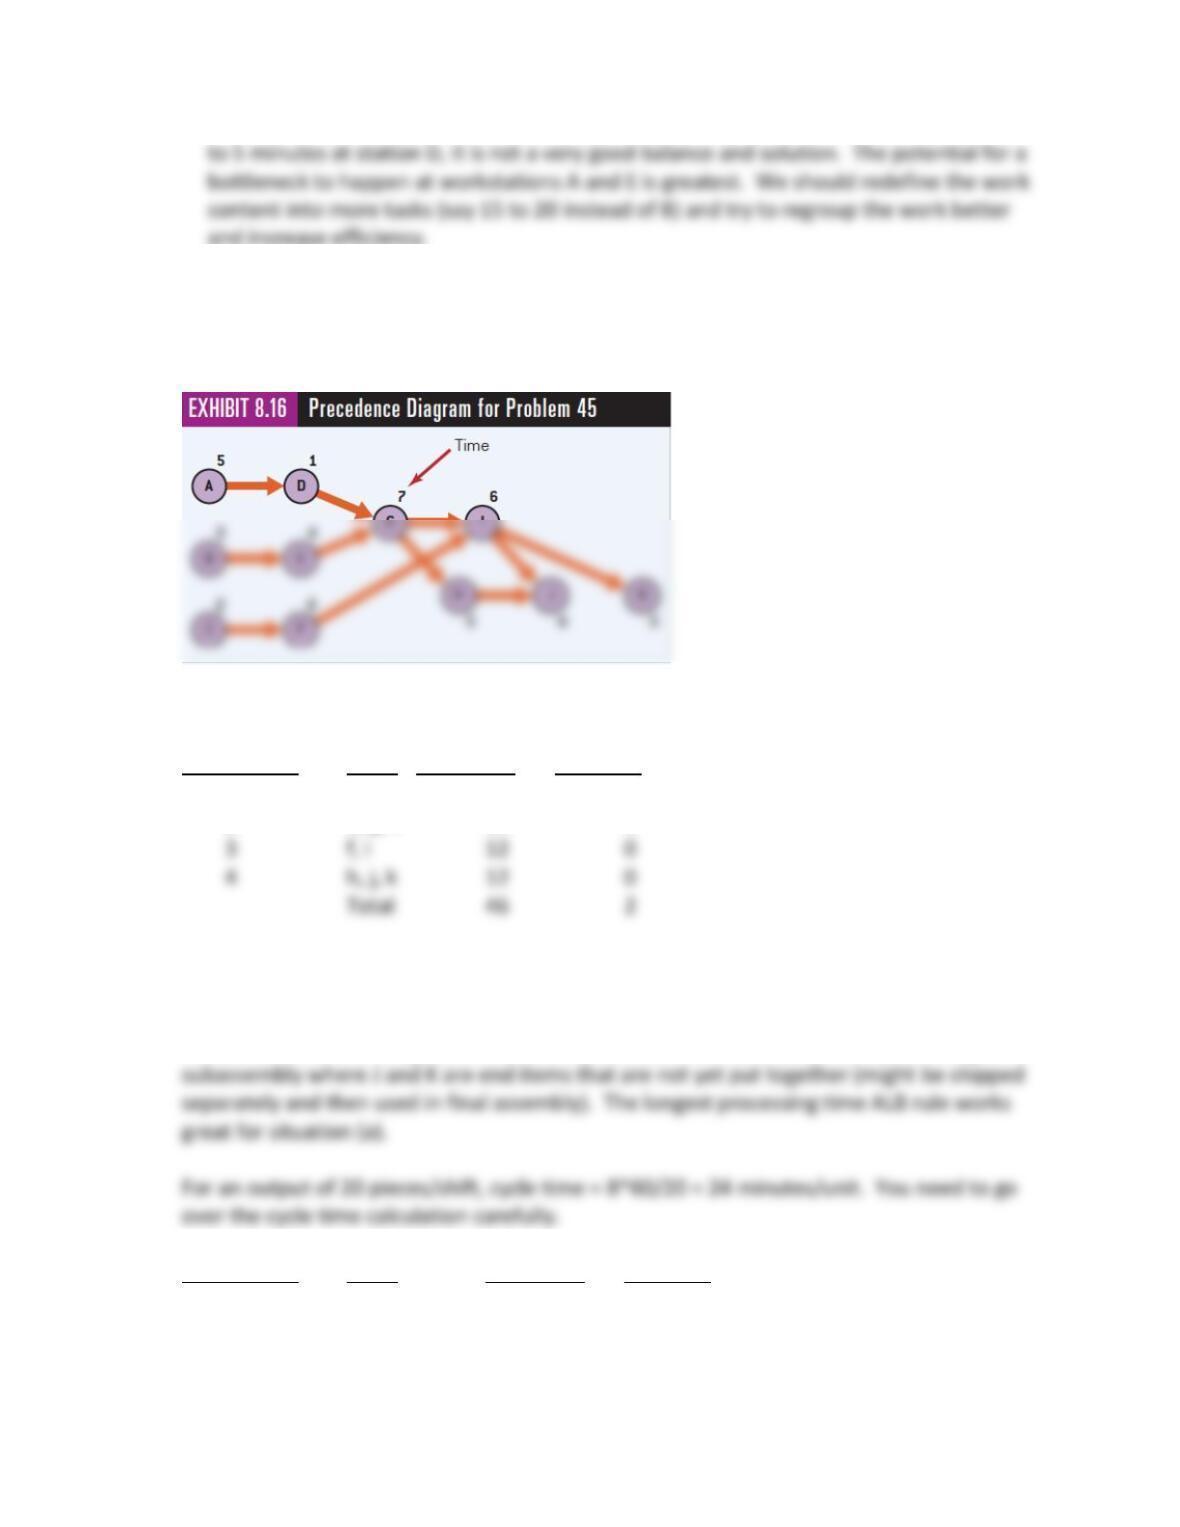
45. Balance the assembly line in Exhibit 8.16 for (a) a shift output of 40 pieces and (b) a shift
output of 20 pieces. Assume an 8-hour shift and use the rule: choose the assignable task
with the longest processing time. Compute the line efficiency for each case.
For a shift output of 40 pieces, cycle time (C) = 8(60)/40 = 12 minutes/unit
Workstation Tasks Total Time Idle Time
1 a, b, e 12 0
2 d, g, c 10 2
Using Equation 8.6, Efficiency = 46/(4*12) = 95.8%
The idea is to strictly follow the ALB rule like a computer would do it. Students may also
ask about the two ending tasks and one explanation is the assembly line is producing a
Workstation Tasks Total Time Idle Time
1 a, b, c, d, e, f 21 3
2 g, h, i, j 22 2
3 k 3 21
25
46. The Florida Appliance Company is installing an assembly line to produce vacuum cleaners,
and you, as an operations manager, are responsible for balancing the line. The tasks to be
performed are listed below, along with their task times in seconds and immediate
predecessors.
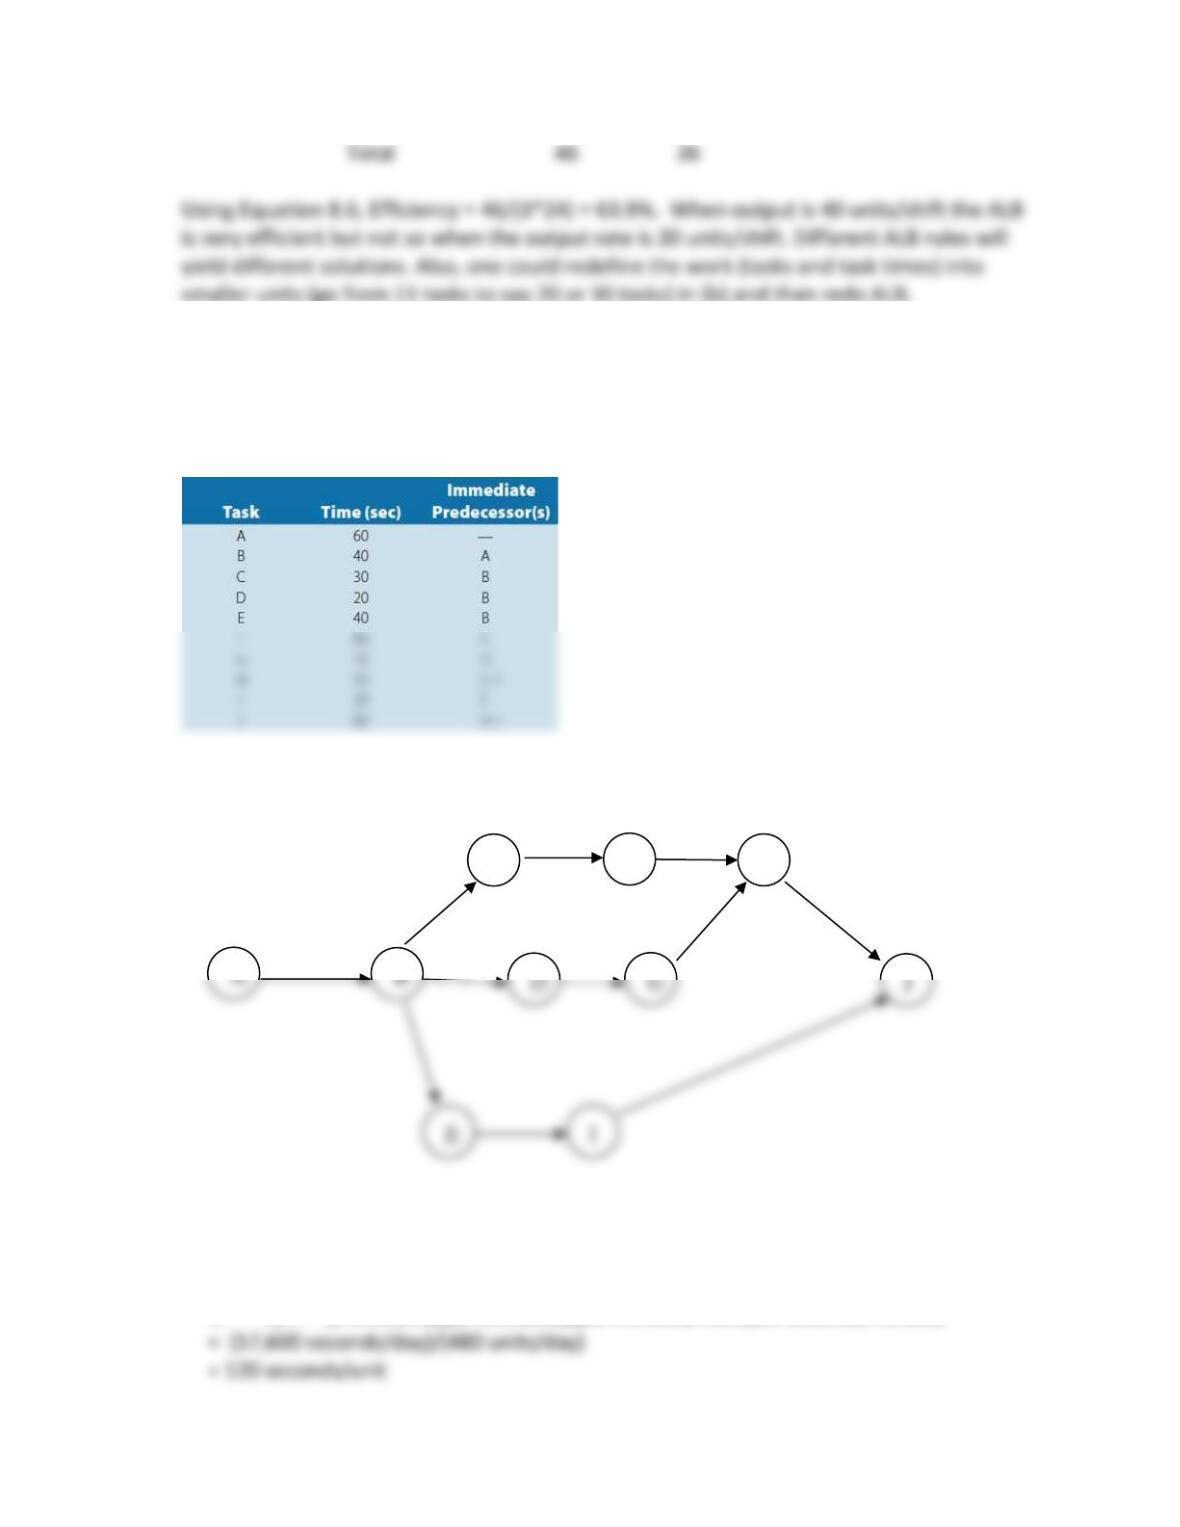
a. Draw the precedence diagram for this assembly line.
A
B
D
J
E
I
b. The company is planning to operate 2 shifts per day, 8 hours per shift. If the desired
output rate of the line is 480 units per day, what is the cycle time?
C
H
F

c. Balance the assembly line using the longest task time first processing rule.
Work Tasks Assigned Total Time Idle Time
Station
1 A,B, D 120 0
d. What is the efficiency of your balance?
Assembly Line Efficiency = t/ (N*CT) = 450/(4*120) = 0.937
47. Using a rating factor of 1.00, compute the normal time for drilling a hole in a steel plate if
these are the observed times (in minutes):
48. A part-time employee who rolls out dough balls at a pizza restaurant was observed over a
40-hour period for a work-sampling study. During that time, she prepared 550 pieces of pizza
dough. The analyst made 50 observations and found the employee not working four times.
The overall performance rating was 1.10. The allowance for the job is 15 percent. Based on
these data, what is the standard time in minutes for preparing pizza dough?
Effective number of hours worked = 40(46/50) = 36.8 hours
EXCEL-BASED PROBLEMS
For these problems, you may use Excel or the spreadsheet templates in MindTap to assist in
your analysis.
49. Nine observations from a work measurement study using continuous timing are shown
below. Allowances are determined as: personal five percent; fatigue five percent; delay
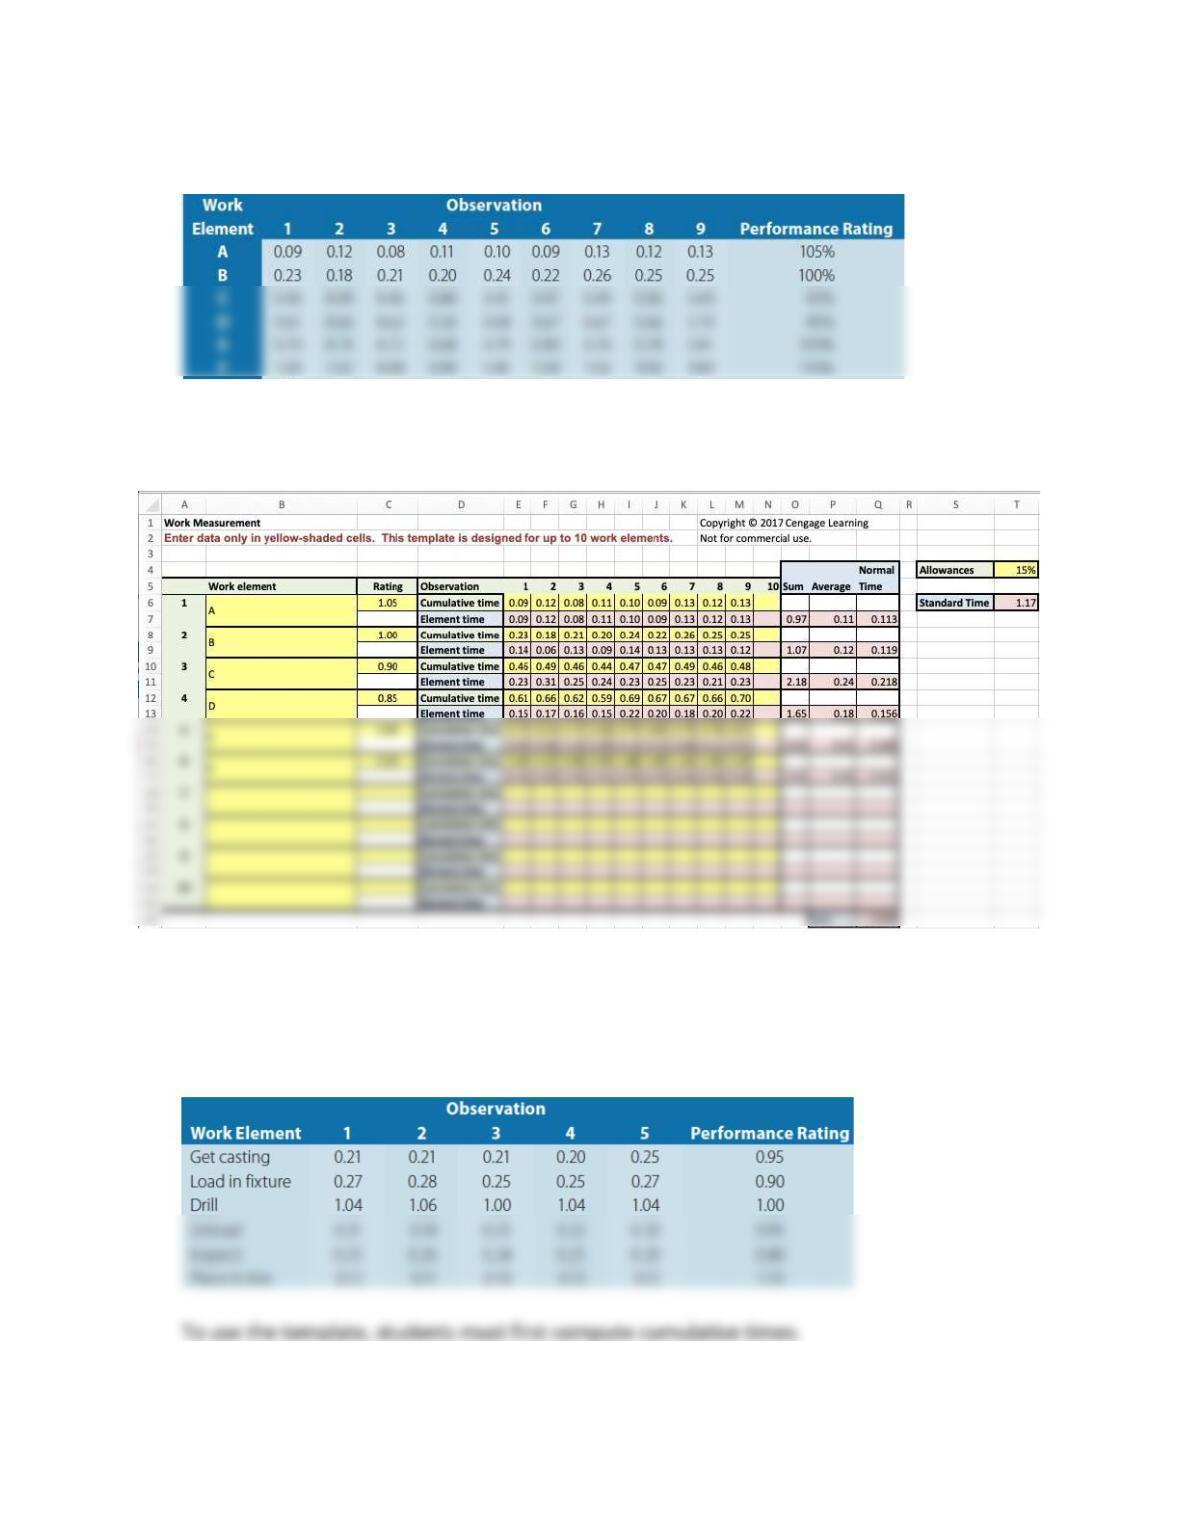
27
for this operation.
The standard time is 1.17. Attention: The Excel template assumes continuous timing and
cumulative times.
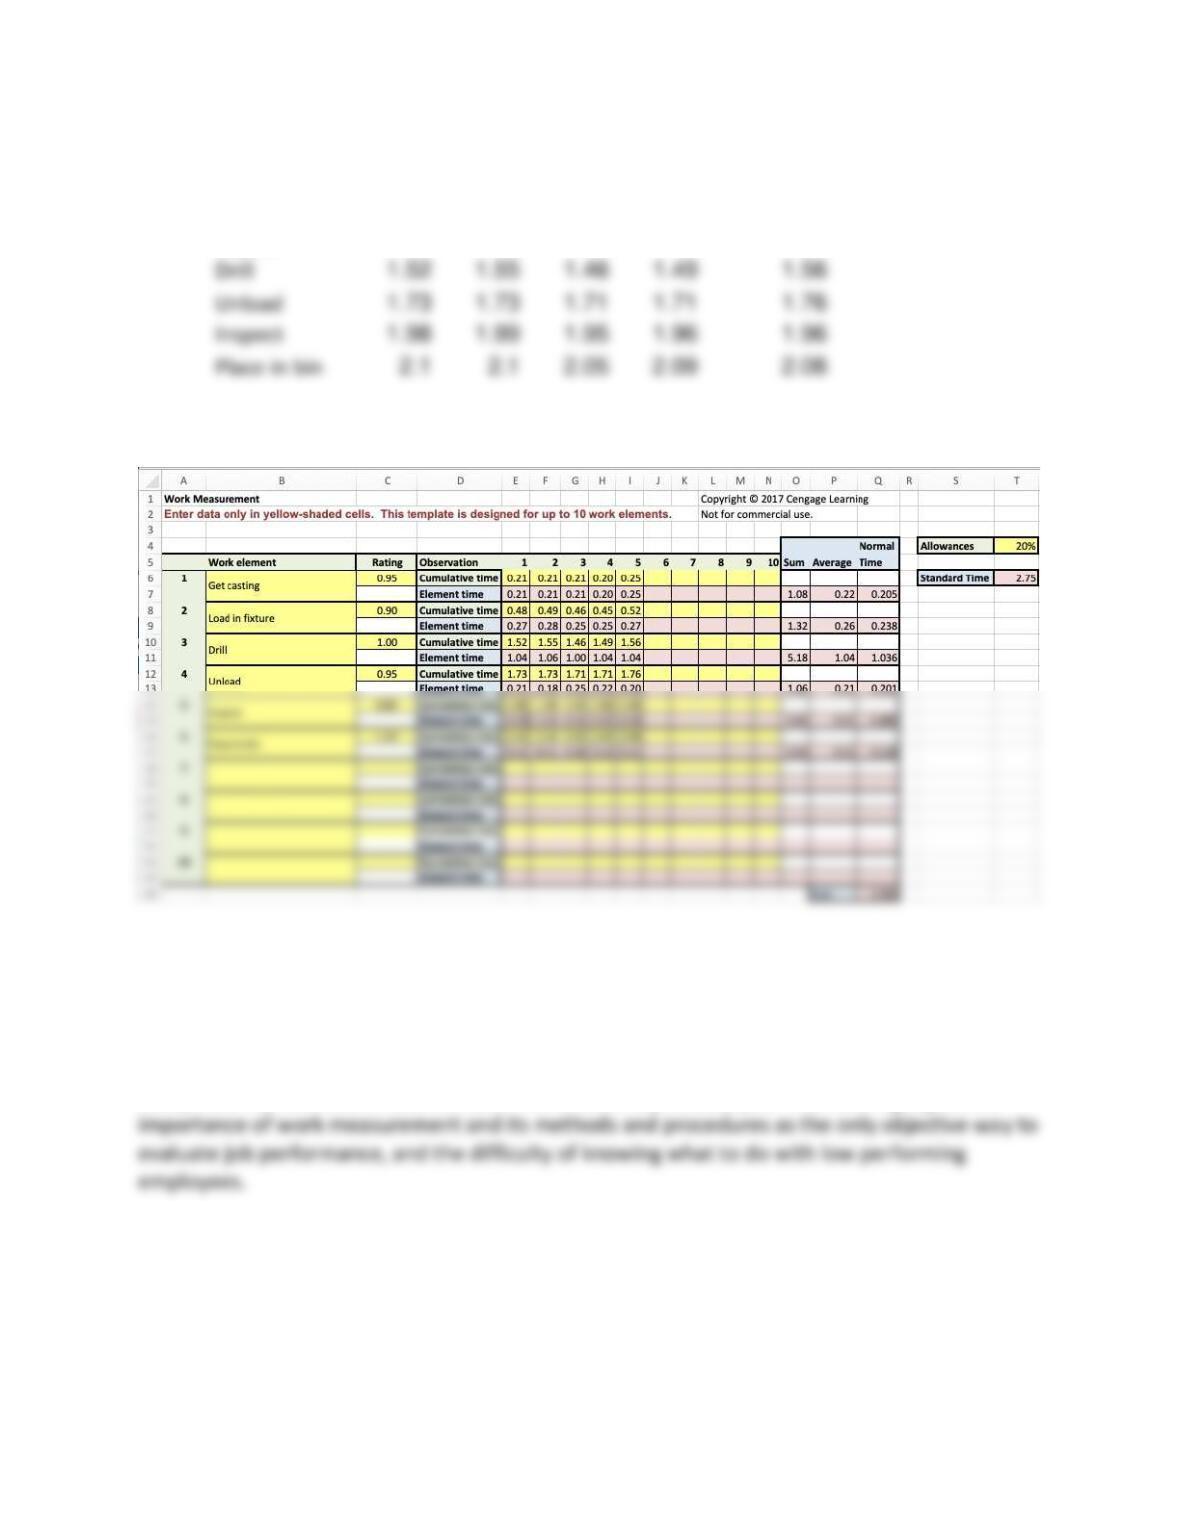
50. Five observations from a work measurement study are shown below. Continuous timing
was not used, but the times in minutes for each work element were recorded individually.
Assume a total allowance of 20 percent. Use the Work Measurement Excel template to
determine the standard time for this operation.
28
Work Element 1 2 3 4 5
Get casting
0.21
0.21
0.21
0.2
0.25
Load in
fixture
0.48
0.49
0.46
0.45
0.52
Drill
1.52
1.55
1.46
1.49
1.56
Inspect
1.98
1.99
1.95
1.96
1.96
The standard time is 2.75 minutes.
Teaching Note: Employee 842 versus The State
Overview
Are the revised daily production quotas for Employee 842 of 300 invoices/day valid? Work
study data is presented in case exhibits. The answer is probably yes. The case highlights the
Case Questions for Discussion:
1. After reviewing the work study, whose case is justified—the state or the employee?
Explain your reasoning.

29
The data Luke Davis had for justifying raising employee 842’s quota is shown in in the case
exhibits. Samples A to B represent four different employees doing the same job as 842 —
processing commission invoices. These data result in an average normal time per invoice of
2. What other issues should be considered?
The case has one troublesome comment, which is “842 is always late for work, plays games on
the computer, violates our dress code, and is generally disliked by his peer employees.”
3. Would you present these data in court? Why or why not?
The issue for the student is the integrity of the work measurement study. Was the study
conducted in an objective and equitable way? These are the questions 842’s attorney will ask?
What are the characteristics of a good work study? (you can ask in class)
• Adequate sample size (yes)

30
4. What are your final recommendations?
Most students will recommend maintaining the revised production quota for 842 of 300
Teaching Plan
1. After reviewing the work study, who’s case is justified—the state or the employee? Explain
and justify.
Teaching Notes: BankUSA: Cash Movement
Overview
The case describes a department in the investment and trust operations area of a major bank
that processes “information–intensive transactions (wires).” Notice the ALB problem is
described for a service industry. The wires are initiated by a paper-based process. The case
analysis requires a blend of numerical analysis as well as qualitative analysis. Some of the
The case study looks more difficult than it is. Instructors might want to go over how rework is
included in this ALB analysis. Also, the assembly line is in series with no parallel work tasks so
31
Case Questions for Discussion:
1. What is the best way to group the work represented by the 16 workgroups for an
average demand of 306 outgoing wires per day? What is your line balance if peak
demand is 450 wires per day? What is assembly-line efficiency for each line-balance
solution?
How to group work tasks most efficiently is best done with assembly line balancing methods.
Please note that this process is best described as having dominant line flows (i.e., a flow shop)
with considerable customization per transaction (widget). The high volumes and fair degree of
You may also want to explain to students that if demand is greater than 457 wires/day, you
have to redefine the work and break the 16 steps and times into more steps and smaller task
times; then do line balancing. The resulting line balance with C = 1.0 min/wire for a peak
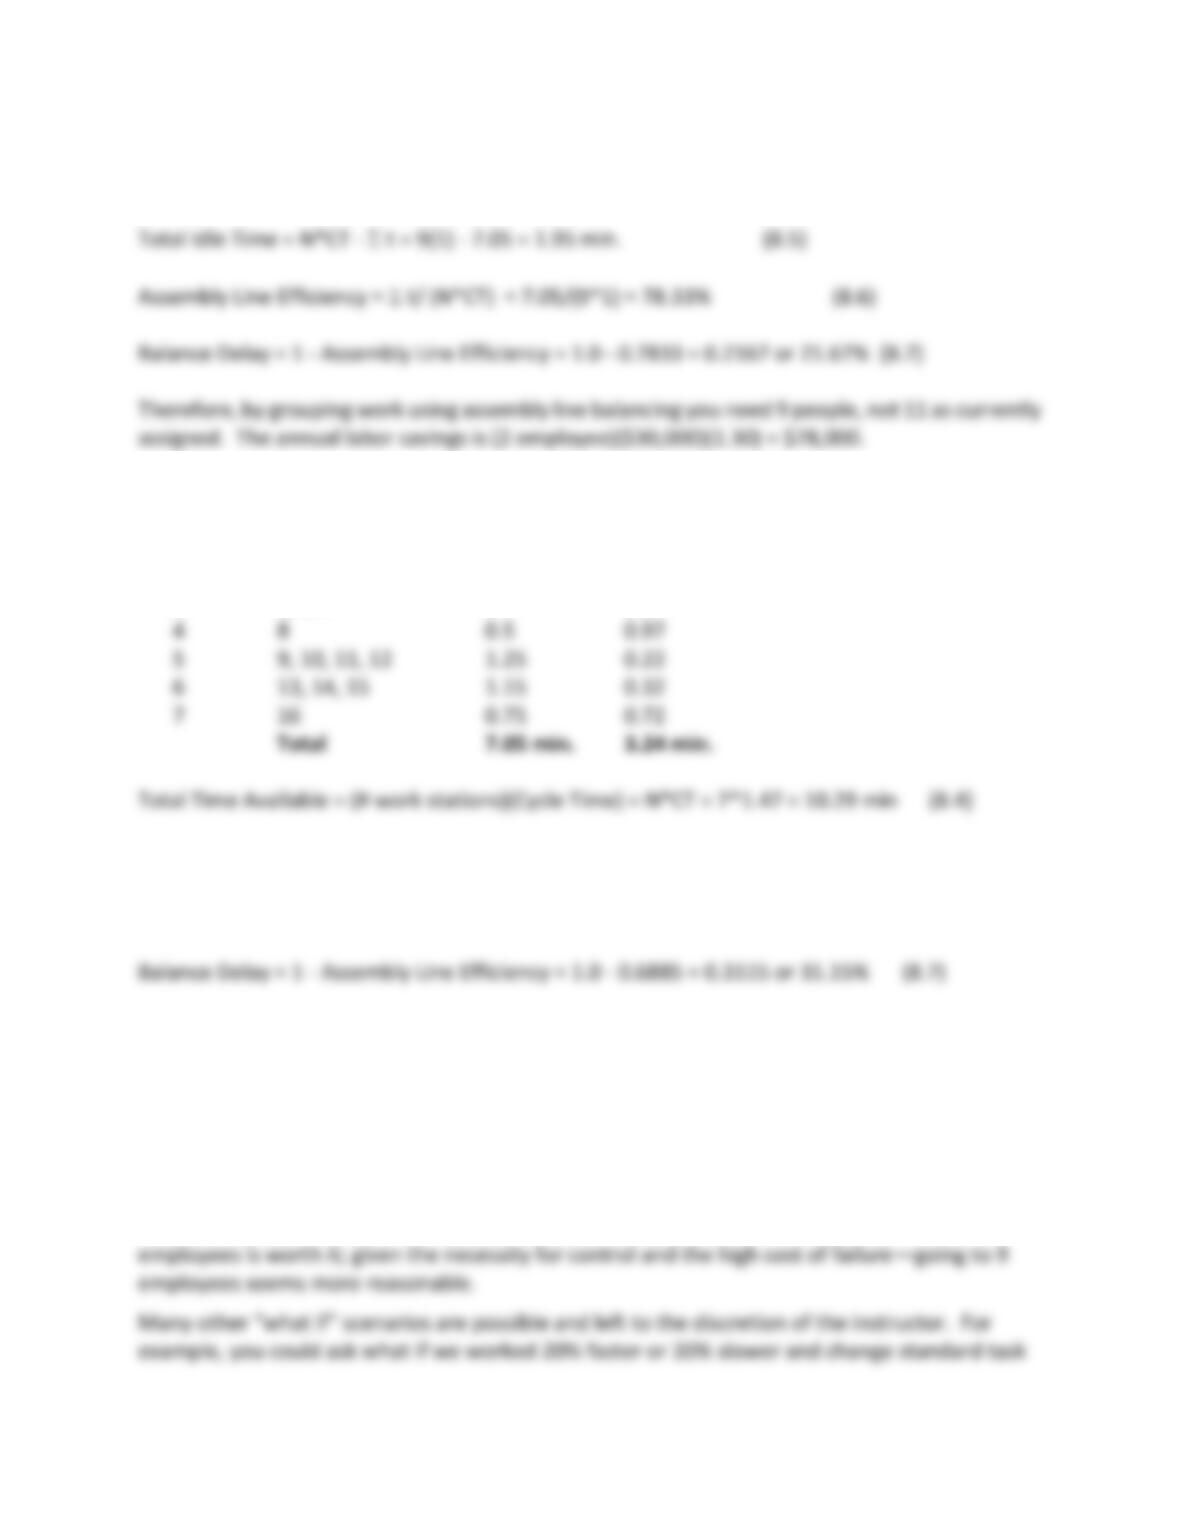
demand of 457 wires/day is as follows:
Work Station Tasks Total Time Idle Time
1 1 0.8 0.20
2 2 0.3* 0.70
3 3, 4 0.9 0.10
32
Total Time Available = Number work stations x Cycle Time = N*CT = 9(1) = 9.0 min (8.4)
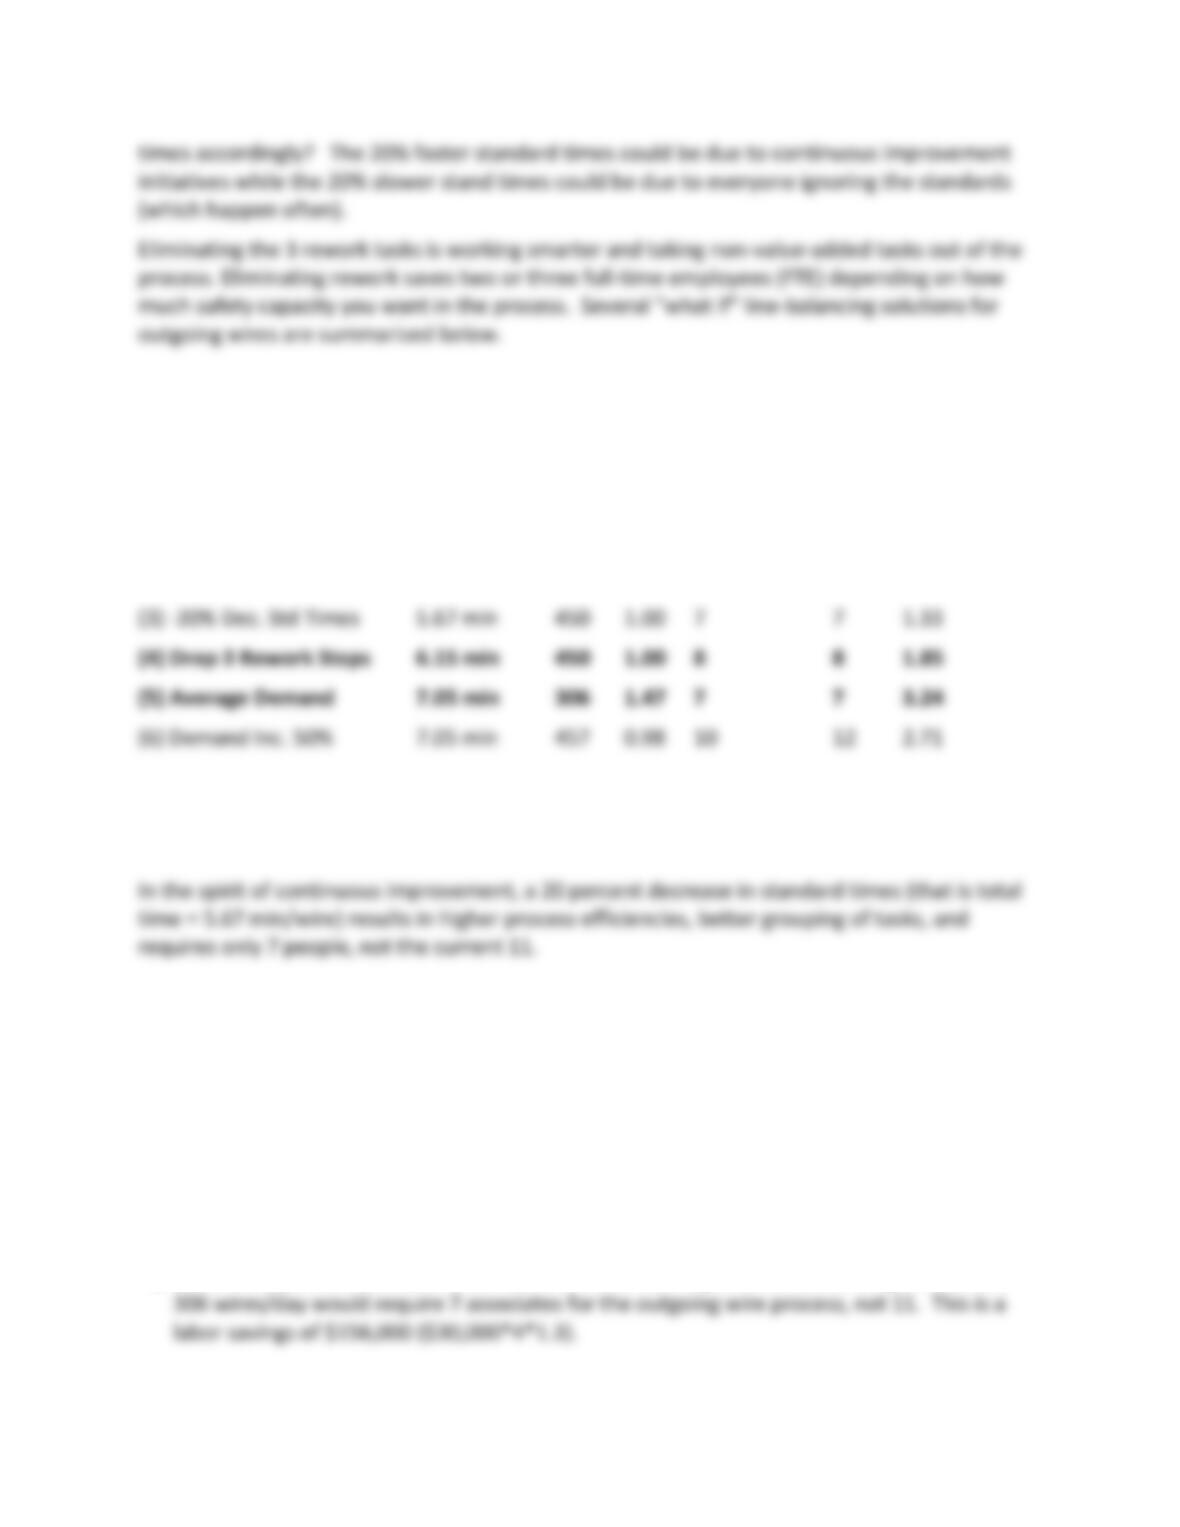
The resulting line balance for low demand with C = 1.47 min/wire (306 wires/day) is as follows:
Work Station Tasks Total Time Idle Time
1 1, 2 1.1 0.37
2 3, 4 0.9 0.57
3 5, 6, 7 1.4 0.07
Total Idle Time = N*CT – t = 7*1.47 – 7.05 = 3.24 min. (8.5)
Assembly Line Efficiency = t/ (N*CT) = 7.05/(7*1.47) = 68.85% (8.6)
2. How many people are needed for the outgoing wire process using assembly line
balancing methods versus the current staffing level of 11 full-time equivalent
employees?
By grouping work using assembly line balancing, you need 7 people, not 11 as currently
assigned if you plan for average demand of 306 wires/day. Here, the annual labor savings is (4
employee)($30,000)(1.30) = $156,000. The question is whether the risk of going to 7
33
Process Cycle No. No.
Standard Output Time Work- Direct Idle
Seven Scenarios Time/Wire Rate* (min) Stations People Time
(1) Peak Demand 7.05 min 450 1.00 9 9 1.95
(2) +20% Inc. Std Times 8.46 min 450 1.00 12 14 3.14
*An output rate of 450 wires per day assumes 7.5 hours/day times 60 minutes/hour. Hence,
the cycle time is 1.0 minute/wire (Cycle Time = 1/Output Rate).
3. How many staff members do you need for the outgoing wire process if you eliminate all
rework?
The next line balancing “what if” scenario assumes you eliminate the three rework areas. If this
can be done, you need only 8 people instead of the original 9 people in the base case. These
first four scenarios assume an output rate of 450 wires per day and a cycle time of one minute
per wire. A few of the conclusions from these analyses are as follows:
a) Either a 20 percent decrease in standard times or staffing to meet the average demand of

34
4. What are your final recommendations?
The student must decide on the best line balance given their assumptions. Please note that
students at times will make assumptions that place their solution beyond the bounds of the
actual case facts, and you must grade accordingly.
Another issue in the case is “how to handle high dollar wire customers?” The case provides no
data to help make this decision but does define the problem. At the time of the case, no real
data existed to help make this decision. Preliminary initiatives to help analyze this issue
include:
a) Do an ABC analysis on dollars per wire versus customer category. Who are the high-dollar
wire A customers? These data will also help set a high dollar wire cut-off dollar value.
Other questions you may or may not want to cover:
(1) Could you balance the assembly line using the 47 more detailed work tasks (mentioned but
not provided in the case)? What is the best level of detail for grouping work? 47 versus 16
tasks?
(2) How would you estimate the standard times? (work measurement)

35
Teaching Plan
1. What is the best way to group the work represented by the 16 work groups for an average
demand of 306 outgoing wires per day? What is your line balance if peak demand is 450
wires per day? What is assembly-line efficiency for each line balance solution?
Integrative Case: Hudson Jewelers
Chapter 8 Case Question for Discussion:
1. Design and draw the layout for your high-end jewelry store. Critique its strengths and
weaknesses. (Make use of concepts in Chapters 4, 5, 7 and 8.)
This question focuses more on Chapters 5 and somewhat on Chapters 5 and 8 (if you have
covered it). In Chapter 5 the student has the opportunity to use and apply the following
concepts in the design of their store:
• Service delivery System design includes
• Facility location and layout

36
• Principal elements
– Customer contact behavior and skills
• High and low contacts
LensCrafters is a good example for students to study before they design their own high-end
jewelry store. Students will sometimes describe Hudson Jewelers correctly as an “retail store
with an elaborate servicescape.”
In Chapter 8, the student may make use of product, process, celluar or fixed-position layout