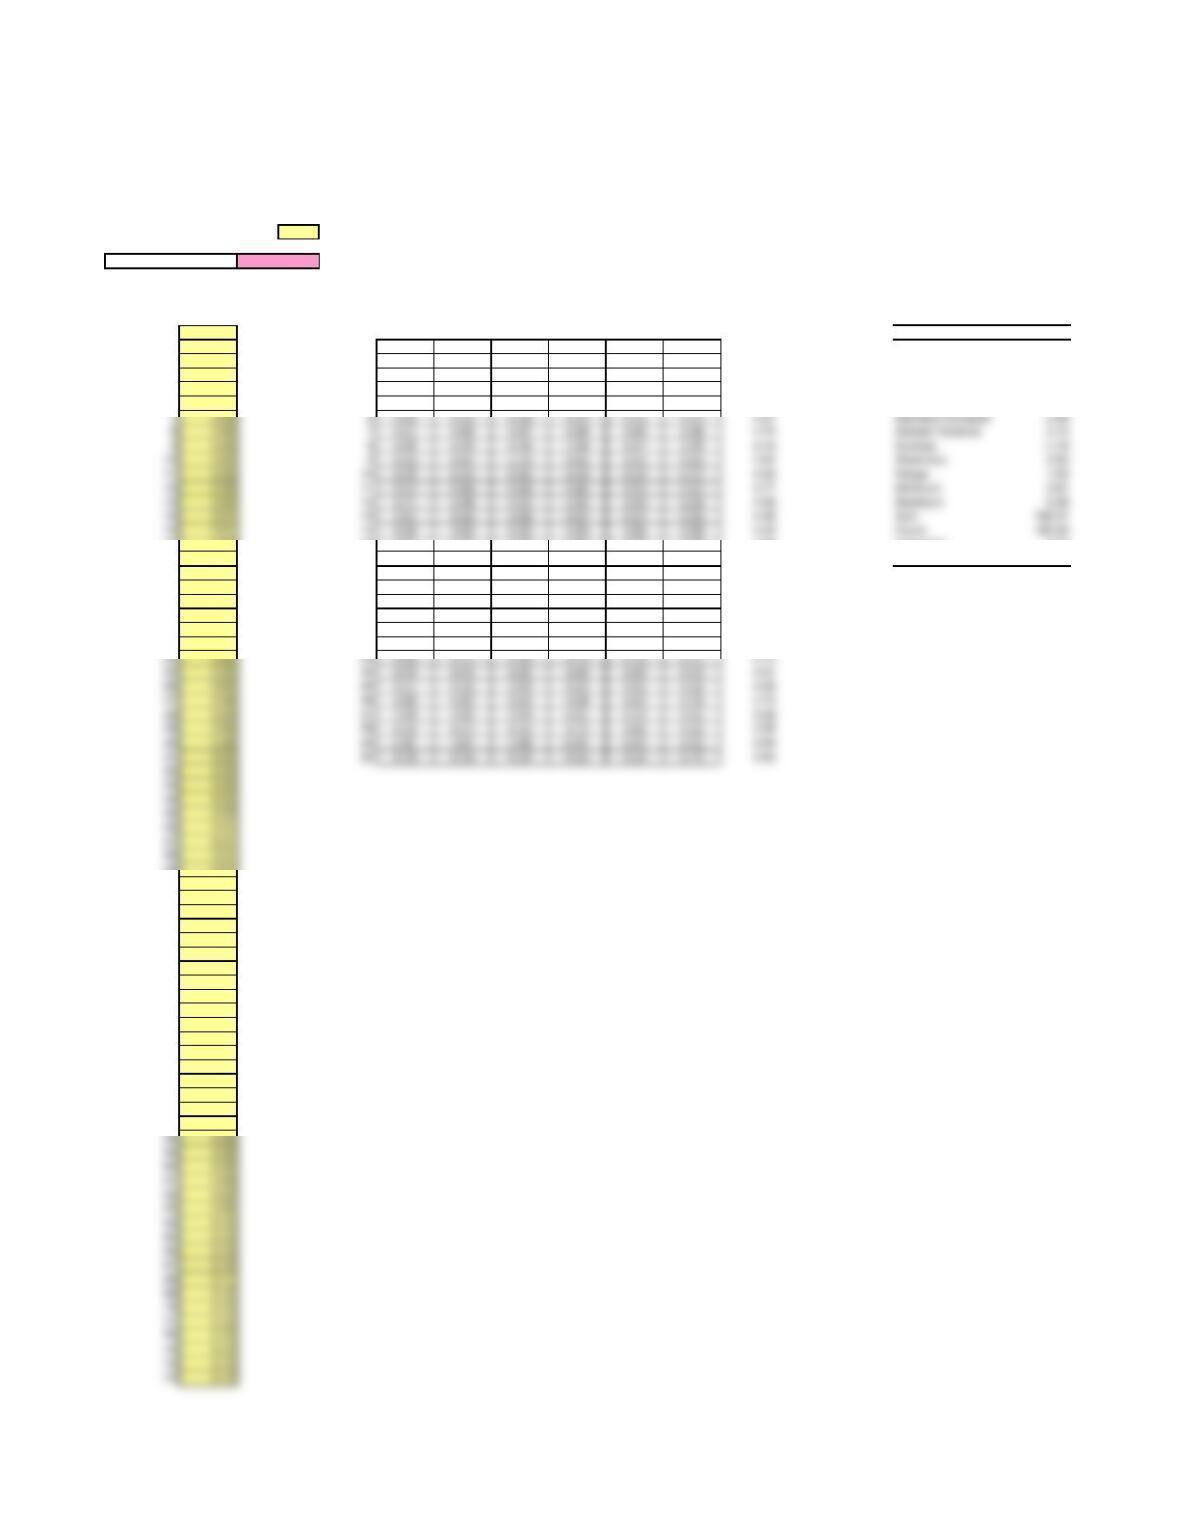
Problem 8-22
River Bottom Fire Department
Histogram and Run Charts
See Histogram and Run Chart Tabs for Results
Number of observations 180
Grand Average
Sorted DATA
Observation Values
1 3.81 Sample 1 2 3 4 5 6 Means Descriptive Statistics
2 3.82 1 3.81 3.93 3.89 3.91 4.08 4.01 3.94
3 3.85 2 4.08 3.82 3.98 4.21 4.00 4.06 4.03 Mean 4.35
4 3.86 3 4.19 4.30 4.17 4.23 4.12 4.15 4.19 Standard Error 0.03
5 3.87 4 3.88 4.16 4.12 4.24 4.17 4.17 4.12 Median 4.17
6 3.88 5 4.15 4.93 4.86 4.98 4.58 4.97 4.75 Mode 4.01
16 3.93 15 4.57 4.06 3.95 3.96 3.98 3.95 4.08 Largest(1) 5.33
17 3.93 16 4.19 4.19 4.03 4.06 3.88 4.00 4.06 Smallest(1) 3.81
18 3.93 17 4.08 4.08 4.21 4.22 4.18 4.10 4.15
19 3.94 18 4.00 4.04 4.06 4.10 4.01 4.13 4.06
20 3.94 19 4.16 4.14 4.19 4.17 4.02 4.31 4.17
21 3.94 20 5.03 4.89 4.88 4.92 4.85 5.13 4.95
22 3.95 21 4.16 4.14 4.19 4.06 4.18 4.31 4.17
23 3.95 22 4.92 4.90 4.91 4.84 4.98 5.09 4.94
24 3.95 23 4.09 4.12 4.10 4.14 4.14 4.27 4.14
25 3.95 24 4.95 4.93 4.82 4.89 4.85 5.03 4.91
26 3.96 25 4.11 4.16 3.93 4.03 4.01 4.14 4.06
27 3.98 26 4.80 4.90 4.63 4.68 4.63 4.76 4.73
28 3.98 27 3.95 3.90 3.93 4.01 4.10 4.01 3.98
29 3.98 28 4.59 4.57 4.59 4.72 4.80 4.65 4.65
30 3.98 29 3.90 3.87 3.88 4.00 4.01 4.02 3.95
31 4.00 30 4.58 4.58 4.64 4.66 4.66 4.75 4.65
32 4.00
33 4.00
34 4.00
35 4.00
36 4.01
37 4.01
38 4.01
39 4.01
40 4.01
41 4.01
42 4.01
43 4.02
44 4.02
45 4.03
46 4.03
47 4.04
48 4.04
49 4.05
50 4.06
51 4.06
52 4.06
53 4.06
54 4.06
55 4.07
56 4.07
57 4.08
58 4.08
59 4.08
60 4.08
61 4.08
62 4.08
63 4.09
64 4.10
65 4.10
66 4.10
67 4.10
68 4.11
69 4.12
70 4.12
71 4.12
72 4.12
73 4.12
74 4.13
75 4.13
4.35
7 3.88 6 4.95 4.12 4.08 4.23 4.12 4.13 4.27 Standard Deviation 0.39
8 3.88 7 4.01 4.89 4.87 4.98 4.89 4.88 4.75 Sample Variance 0.15
9 3.88 8 4.85 4.05 4.08 3.98 4.07 3.95 4.16 Kurtosis -1.18
10 3.89 9 4.24 4.87 5.33 4.83 4.93 4.83 4.84 Skewness 0.55
11 3.90 10 4.99 4.16 4.16 4.18 4.29 4.37 4.36 Range 1.52
12 3.90 11 4.07 4.88 4.89 4.86 4.93 4.97 4.77 Minimum 3.81
13 3.90 12 4.71 3.98 4.04 3.94 3.94 3.90 4.09 Maximum 5.33
14 3.91 13 3.91 4.64 4.68 4.57 4.57 4.52 4.48 Sum 782.47
15 3.91 14 4.60 3.94 4.00 3.85 3.86 3.88 4.02 Count 180.00
76 4.14
77 4.14
78 4.14
79 4.14
94 4.18
95 4.18
96 4.19
97 4.19
98 4.19
99 4.19
100 4.19
101 4.21
102 4.21
103 4.22
104 4.23
105 4.23
106 4.24
107 4.24
108 4.27
109 4.29
110 4.30
111 4.31
112 4.31
113 4.37
114 4.52
115 4.57
116 4.57
117 4.57
118 4.57
119 4.58
120 4.58
121 4.58
122 4.59
123 4.59
124 4.60
125 4.63
126 4.63
127 4.64
128 4.64
129 4.65
130 4.66
131 4.66
132 4.68
133 4.68
134 4.71
135 4.72
136 4.75
137 4.76
138 4.80
139 4.80
140 4.82
141 4.83
142 4.83
143 4.84
144 4.85
145 4.85
146 4.85
147 4.86
148 4.86
149 4.87
150 4.87
151 4.88
152 4.88
153 4.88
154 4.89
155 4.89
156 4.89
157 4.89
158 4.89
159 4.90
160 4.90
161 4.91
162 4.92
163 4.92
80 4.14
81 4.15
82 4.15
83 4.16
84 4.16
85 4.16
86 4.16
87 4.16
88 4.16
89 4.17
90 4.17
91 4.17
92 4.17
93 4.18
164 4.93
165 4.93
166 4.93
167 4.93
168 4.95
169 4.95
170 4.97
171 4.97
172 4.98
173 4.98
174 4.98
175 4.99
176 5.03
177 5.03
178 5.09
179 5.13
180 5.33
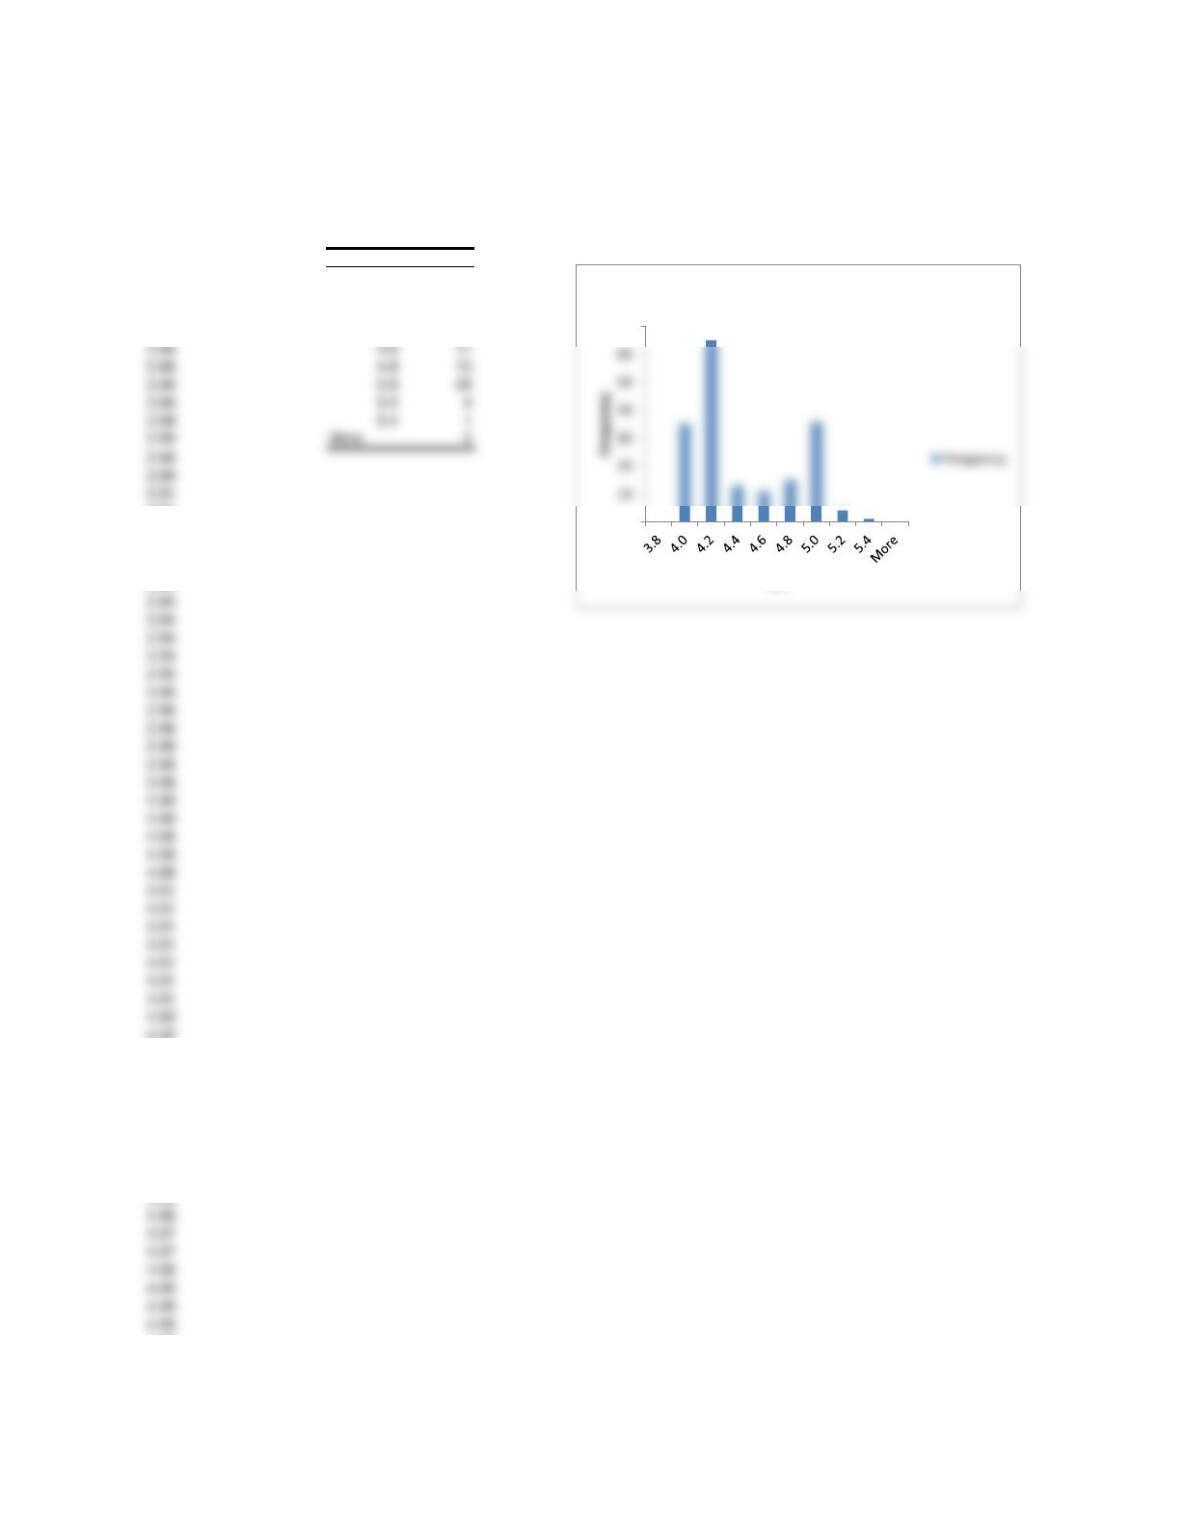
Problem 8-22
River Bottom Fire Department
Sorted
Values
3.81 Bin Frequency
3.82 3.8 0
3.85 4.0 35
3.86 4.2 65
3.87 4.4 13
3.91
3.93
3.93
3.93
3.94
4.02
4.03
4.03
4.04
4.04
4.05
4.06
4.06
4.06
4.08
4.08
4.09
0
70
Bin
Histogram
4.1
4.1
4.1
4.1
4.11
4.12
4.12
4.12
4.12
4.17
4.17
4.18
4.18
4.18
4.19
4.19
4.19
4.19
4.19
4.21
4.21
4.57
4.57
4.57
4.57
4.58
4.58
4.58
4.59
4.59
4.6
4.63
4.63
4.64
4.64
4.65
4.66
4.66
4.68
4.68
4.71
4.72
4.75
4.76
4.8
4.8
4.89
4.89
4.89
4.9
4.9
4.91
4.92
4.92
4.93
4.93
4.93
5.09
5.13
5.33
4.60
4.80
5.00
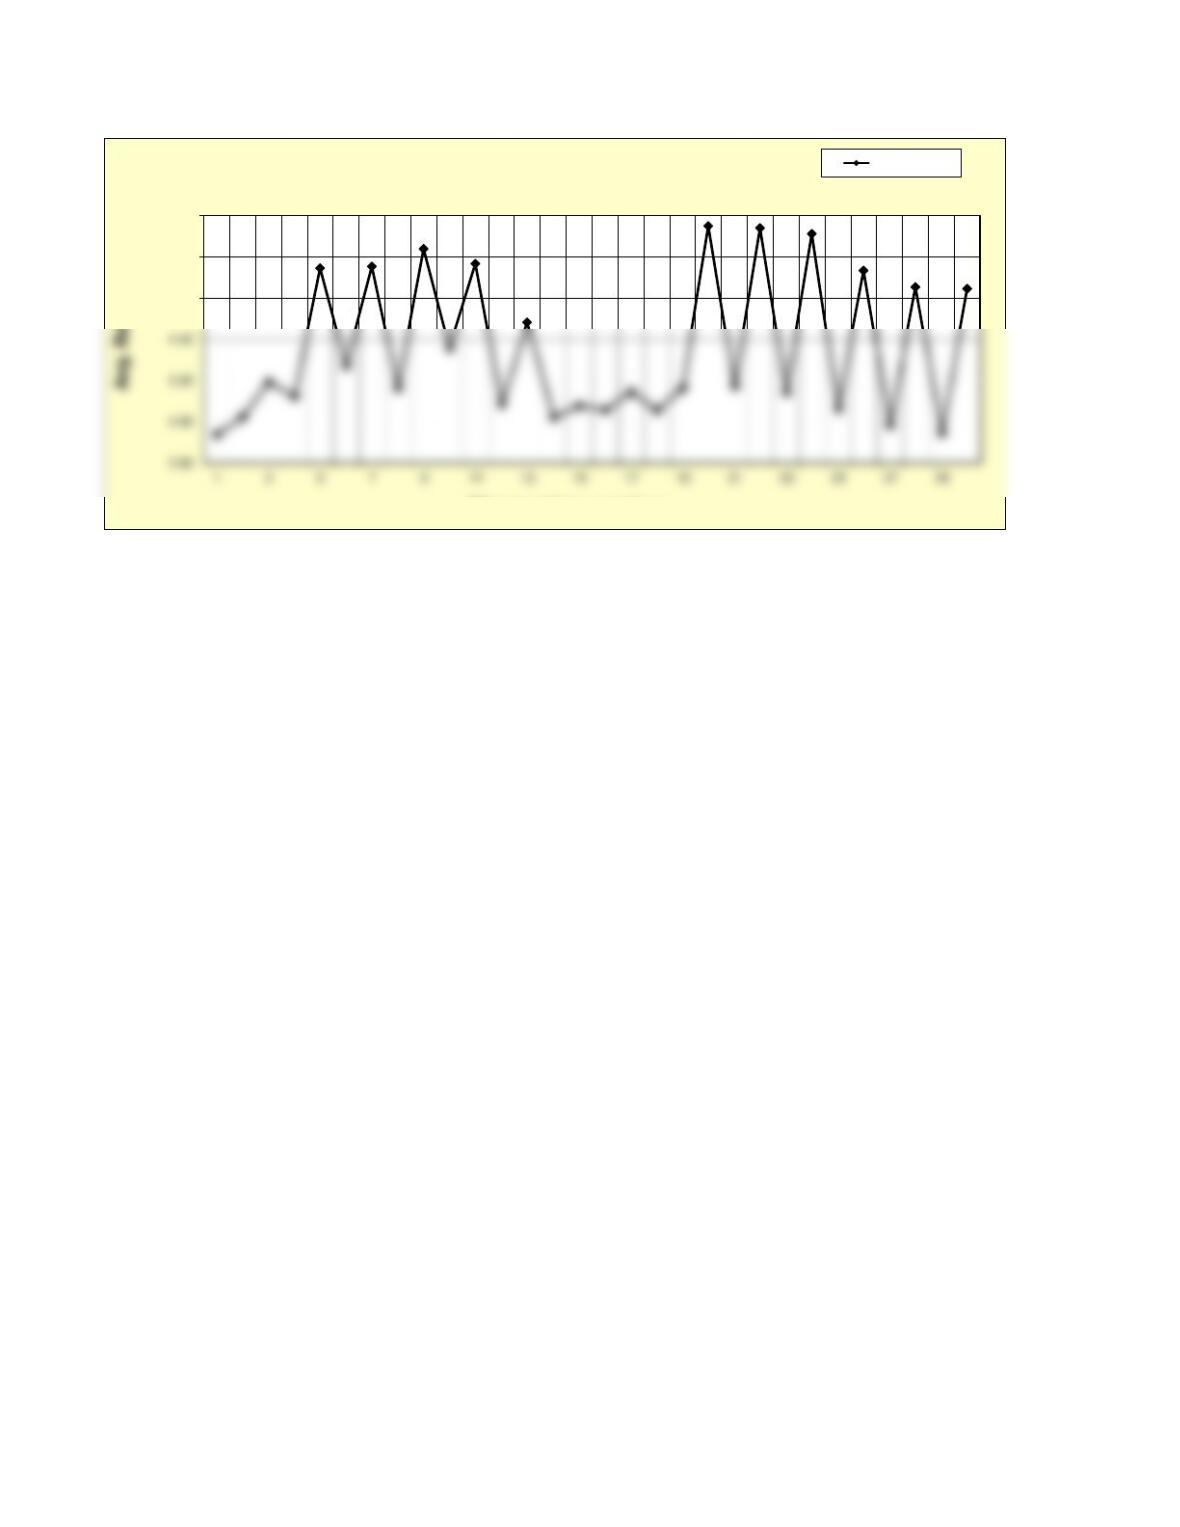
Observation number
Prob. 8-22 Run Chart of Sample Means Response Time