Problem 8-30A
Rapid Check Kiters
Calculation of control limits with 20 samples.
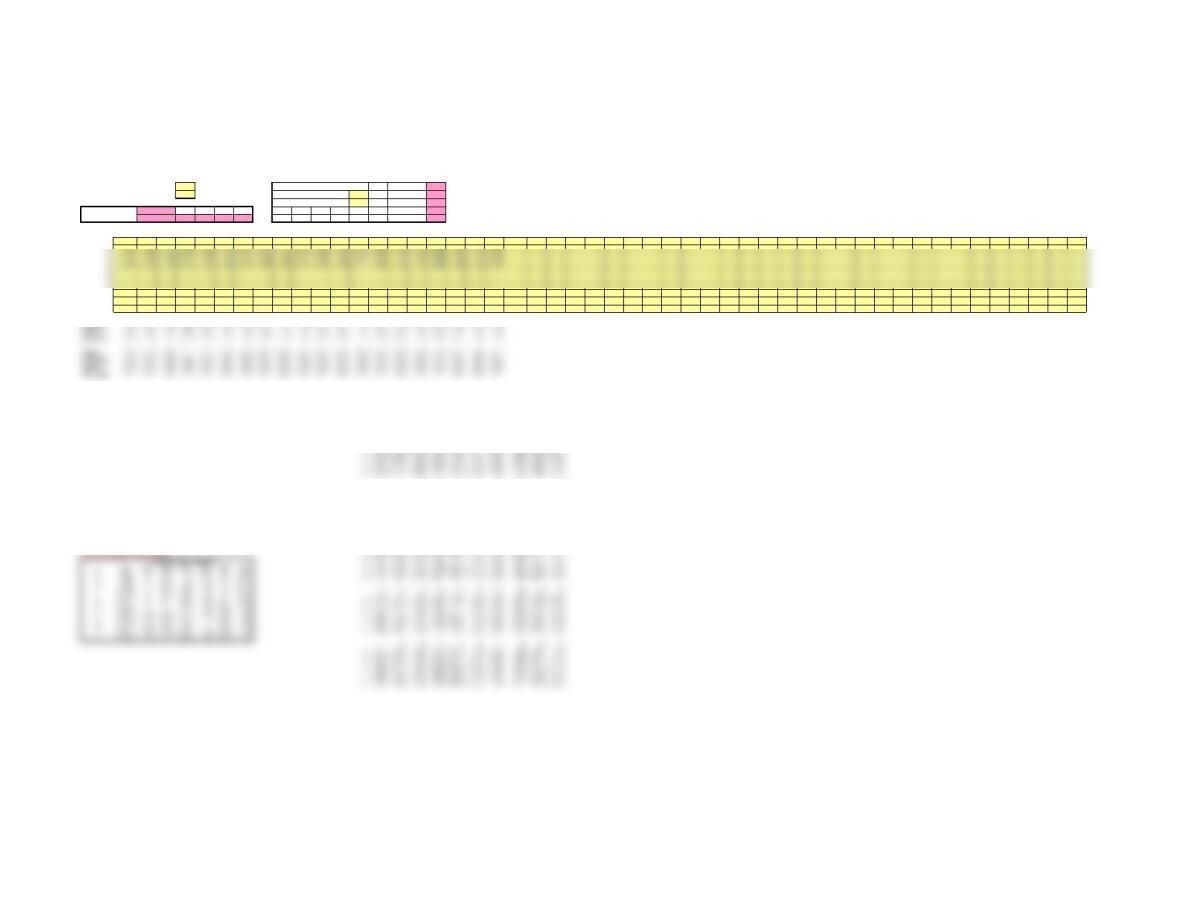
This spreadsheet is designed for up to 50 samples, each of a constant sample size from 2 to 10. Enter data ONLY in yellow-shaded cells.
Enter the number of samples in cell E6 and the sample size in cell E7. Then enter your data in the grid below.
Click on sheet tabs for a display of the control charts. Specification limits may be entered in cells N7 and N8 for process capability.
Std. Dev. = 0.045
Number of samples (<= 50) 20 Process Capability Calculations Six sigma 0.27
4Upper specification 1.21 1.03
Lower specification 0.93 0.99
Grand Average A2 D3 D4 d2 1.06
Average Range 0.73 0 2.28 2.06 0.99
DATA 12345678910 11 12 13 14 15 16 17 18 19 20 21 22 23 24 25 26 27 28 29 30 31 32 33 34 35 36 37 38 39 40 41 42 43 44 45 46 47 48 49 50
11.01 1.15 1.08 0.98 1.13 1.06 1.03 1.08 1.13 1.16 1.08 1.11 1.09 1.05 1.07 1.05 1.03 1.01 1.08 1.09
7
8
9
10
Average 1.05 1.07 1.10 1.02 1.08 1.09 1.06 1.10 1.09 1.08 1.03 1.07 1.11 1.06 1.07 1.06 1.06 1.05 1.08 1.09
LCLx-bar 1.00 1.00 1.00 1.00 1.00 1.00 1.00 1.00 1.00 1.00 1.00 1.00 1.00 1.00 1.00 1.00 1.00 1.00 1.00 1.00
Sample Number
DATA 1234567 8910
1 7.95 6.34 8.15 10.12 8.42 9.79 8.47 8.68 10.64 8.99
2 11.20 7.97 10.60 7.46 7.04 11.62 9.38 8.56 9.38 9.97
3 8.16 10.68 8.66 10.07 9.83 7.73 6.91 8.28 9.92 10.04
4 10.04 8.88 9.99 8.07 11.00 11.45 9.00 8.72 9.08 9.77
5 9.10 11.18 8.86 7.31 8.70 11.56 7.84 7.42 8.88 8.11
11 12 13 14 15 16 17 18 19 20
1 9.22 8.07 10.69 10.80 9.94 9.52 10.09 8.23 8.86 9.00
2 9.41 9.34 9.75 7.99 10.63 8.53 7.80 8.42 8.67 9.21
3 9.19 10.03 10.55 9.06 9.34 9.68 9.28 8.47 10.76 9.04
4 7.58 8.63 8.36 11.27 9.74 8.13 9.01 9.61 9.33 7.33
5 7.73 10.27 10.94 8.37 10.27 9.47 11.23 8.76 8.58 9.67
21 22 23 24 25 26 27 28 29 30
1 9.73 6.91 9.05 8.41 8.71 10.17 9.91 9.82 9.18 7.08
3 10.72 9.44 7.06 10.64 7.72 9.76 10.20 10.97 9.42 8.05
41 42 43 44 45 46 47 48 49 50
1 9.74 9.80 8.85 9.21 10.14 7.32 8.46 7.96 8.60 7.71
2 8.04 10.35 8.76 9.19 9.19 8.60 10.08 10.00 8.71 8.27
3 9.52 8.10 8.80 8.59 10.00 10.81 10.32 9.75 8.73 11.11
4 8.80 9.73 7.72 8.58 9.69 7.77 6.97 8.70 9.09 7.97
5 9.55 9.22 8.66 9.54 10.84 10.08 7.49 9.41 8.76 10.54
X-bar and R-Chart
Sample size (2 – 10)
1.069
0.094
Cp
Cpu
Cpl
Cpk
21.03 1.05 1.14 1.08 1.05 1.10 1.04 1.11 1.11 1.06 1.00 1.07 1.13 0.95 1.04 1.07 1.08 1.08 1.07 1.08
31.07 1.08 1.06 0.97 1.14 1.16 1.13 1.14 1.06 1.07 0.99 1.05 1.09 1.15 1.10 1.06 1.04 1.05 1.11 1.02
41.10 1.01 1.10 1.04 1.01 1.02 1.05 1.07 1.05 1.02 1.03 1.05 1.14 1.08 1.06 1.04 1.08 1.04 1.06 1.15
5
6
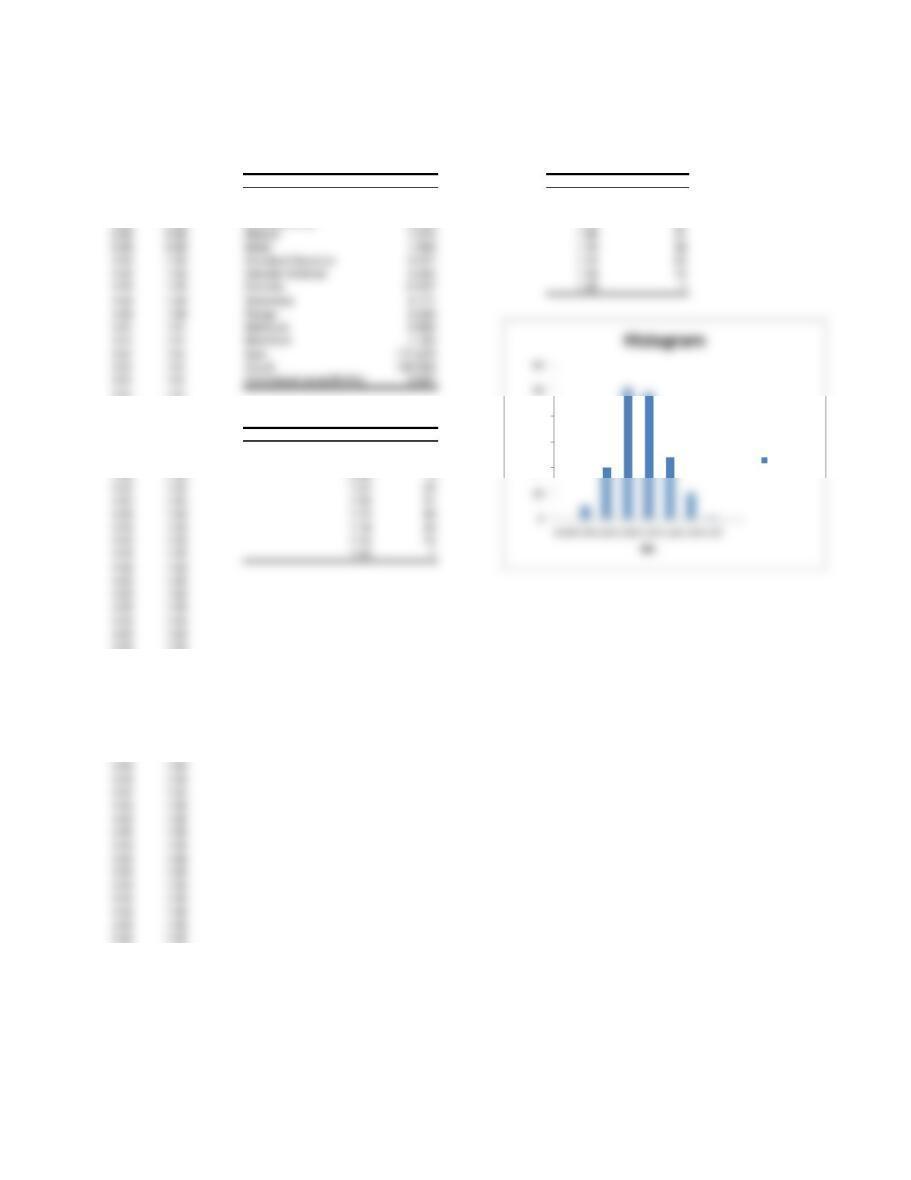
Problem 8-30A Descriptive Statistics
Rapid Check Kiters
Note: The descriptive statistics were based on all 40 samples, not just the 20 on which the control limits were calculated.
0.95 0.95 Column1 Bin Frequency
0.95 0.95 0.94 0
0.97 0.97 Mean 1.070 0.98 5
0.98 0.98 Standard Error 0.004 1.02 20
1.01 1.01
1.01 1.01
1.02 1.02
1.03 1.03 1.22 1
1.02 1.02 Bin Frequency
1.02 1.02 0.90 0
1.02 1.02 0.94 0
1.04 1.04
1.04 1.04
1.04 1.04
1.04 1.04
1.04 1.04
1.04 1.04
1.04 1.04
1.04 1.04
1.04 1.04
1.05 1.05
1.05 1.05
1.05 1.05
1.05 1.05
1.05 1.05
1.05 1.05
1.05 1.05
1.06 1.06
1.06 1.06
20
30
40
Frequency
Frequency
1.00 1.00 Kurtosis -0.037 1.22 1

1.06 1.06
1.06 1.06
1.06 1.06
1.06 1.06
1.06 1.06
1.06 1.06
1.06 1.06
1.06 1.06
1.06 1.06
1.07 1.07
1.07 1.07
1.07 1.07
1.08 1.08
1.08 1.08
1.08 1.08
1.08 1.08
1.08 1.08
1.08 1.08
1.08 1.08
1.08 1.08
1.08 1.08
1.08 1.08
1.09 1.09
1.09 1.09
1.09 1.09
1.09 1.09
1.09 1.09
1.09 1.09
1.09 1.09
1.09 1.09
1.09 1.09
1.09 1.09
1.09 1.09
1.11 1.11
1.11 1.11
1.11 1.11
1.11 1.11
1.12 1.12
1.12 1.12
1.12 1.12
1.12 1.12
1.12 1.12
1.12 1.12
1.13 1.13

1.13 1.13
1.13 1.13
1.13 1.13
1.13 1.13
1.13 1.13
1.17 1.17
1.18 1.18
1.18 1.18
1.19 1.19
1.12
1.14
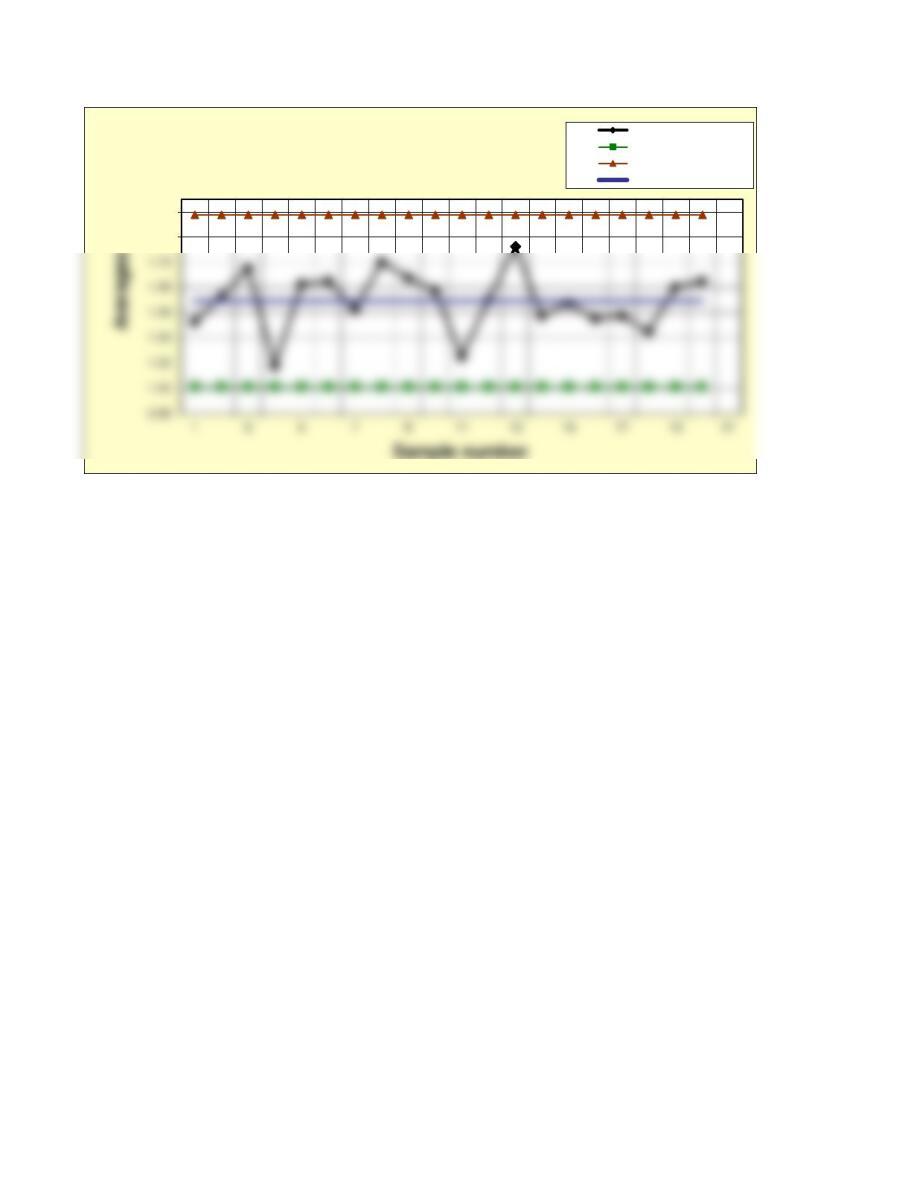
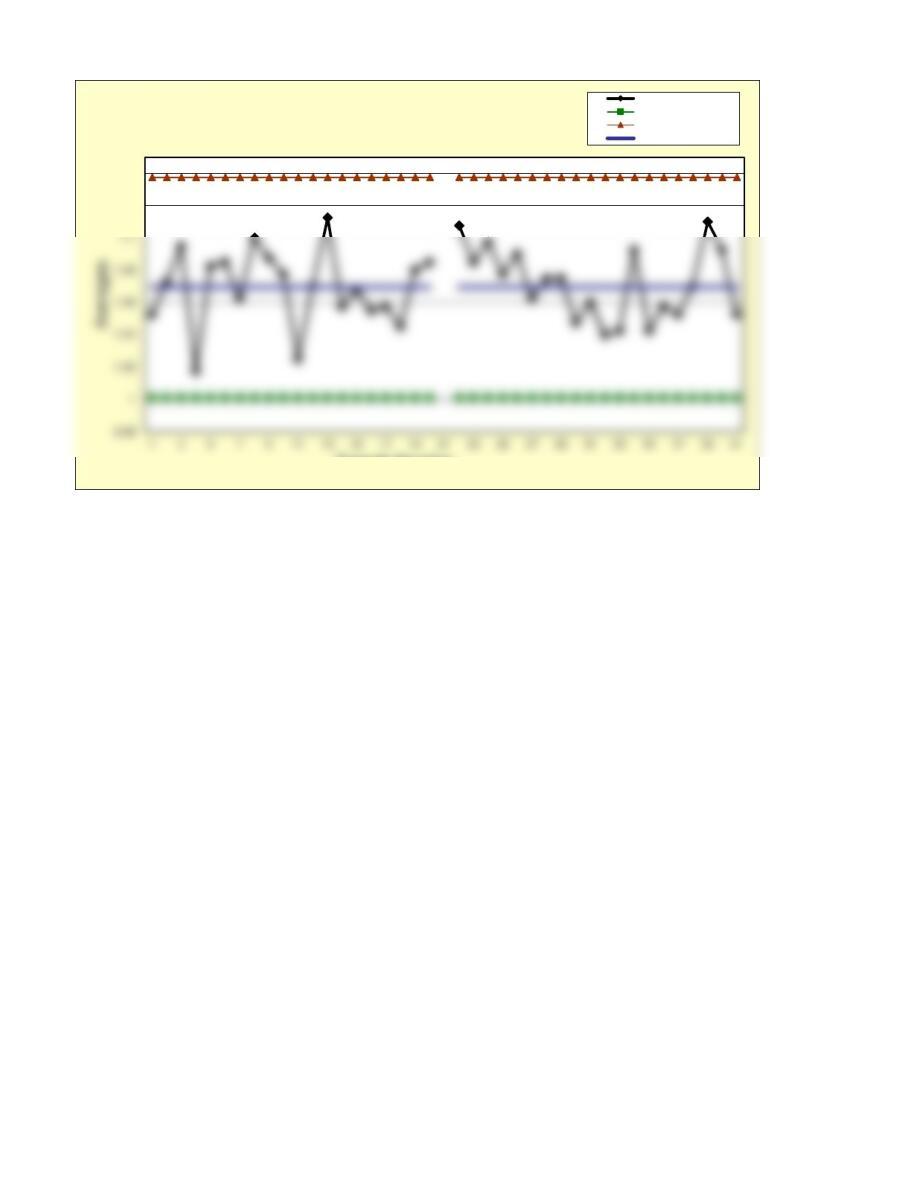
Prob. 8-30A X-bar Chart
Averages
Lower control limit
Upper control limit
Center line
0.20
0.25
Sample number
Prob. 8-30 A R-Chart
Ranges
Lower control limit
Upper control limit
Center line
Problem 8-30B
Check Kiters, Inc.
Note: Formulas were altered to allow calculation of control limits based on the first 20 samples and plotting of 40 samples. Process capability was also calculated using the first 20 samples.
This spreadsheet is designed for up to 50 samples, each of a constant sample size from 2 to 10. Enter data ONLY in yellow-shaded cells.
Enter the number of samples in cell E6 and the sample size in cell E7. Then enter your data in the grid below.
Click on sheet tabs for a display of the control charts. Specification limits may be entered in cells N7 and N8 for process capability.
Number of samples (<= 50) 20 Process Capability Calculations Six sigma 0.273
4Upper specification 1.205 1.026
Lower specification 0.925 0.994
Grand Average A2 D3 D4 1.058
Average Range 0.729 0 2.282 0.994
DATA 12345678910 11 12 13 14 15 16 17 18 19 20 21 22 23 24 25 26 27 28 29 30 31 32 33 34 35 36 37 38 39
11.01 1.15 1.08 0.98 1.13 1.06 1.03 1.08 1.13 1.16 1.08 1.11 1.09 1.05 1.07 1.05 1.03 1.01 1.08 1.09 1.11 1.17 1.11 1.12 1.09 1.09 1.09 1.08 1.19 1.05 1.05 1.10 1.08 1.03 1.09 1.12 1.07 1.04 1.01
21.03 1.05 1.14 1.08 1.05 1.10 1.04 1.11 1.11 1.06 1.00 1.07 1.13 0.95 1.04 1.07 1.08 1.08 1.07 1.08 1.06 1.08 1.13 1.07 1.12 1.06 1.09 1.12 1.03 1.05 1.04 1.00 1.12 1.05 1.03 1.01 1.13 1.18 1.05
31.07 1.08 1.06 0.97 1.14 1.16 1.13 1.14 1.06 1.07 0.99 1.05 1.09 1.15 1.10 1.06 1.04 1.05 1.11 1.02 1.17 1.09 1.12 1.03 1.10 1.00 1.04 1.08 1.02 1.06 1.07 1.05 1.08 0.98 1.01 1.03 1.04 1.18 1.14
41.10 1.01 1.10 1.04 1.01 1.02 1.05 1.07 1.05 1.02 1.03 1.05 1.14 1.08 1.06 1.04 1.08 1.04 1.06 1.15 1.09 1.00 1.03 1.09 1.05 1.10 1.08 1.02 0.95 1.08 1.00 1.02 1.09 1.11 1.10 1.05 1.04 1.04 1.17
5
Sample Number
DATA 12345678
1 1.01 1.15 1.08 0.98 1.13 1.06 1.03 1.08
2 1.03 1.05 1.14 1.08 1.05 1.10 1.04 1.11
3 1.07 1.08 1.06 0.97 1.14 1.16 1.13 1.14
4 1.10 1.01 1.10 1.04 1.01 1.02 1.05 1.07
910 11 12 13 14 15 16
1 1.13 1.16 1.08 1.11 1.09 1.05 1.07 1.05
2 1.11 1.06 1.00 1.07 1.13 0.95 1.04 1.07
3 1.06 1.07 0.99 1.05 1.09 1.15 1.10 1.06
4 1.05 1.02 1.03 1.05 1.14 1.08 1.06 1.04
1 1.03 1.01 1.08 1.09
3 1.04 1.05 1.11 1.02
1 1.19 1.05 1.05 1.10 1.08 1.03 1.09 1.12
2 1.03 1.05 1.04 1.00 1.12 1.05 1.03 1.01
3 1.02 1.06 1.07 1.05 1.08 0.98 1.01 1.03
4 0.95 1.08 1.00 1.02 1.09 1.11 1.10 1.05
1 1.07 1.04 1.01 1.05
2 1.13 1.18 1.05 1.02
3 1.04 1.18 1.14 1.08
4 1.04 1.04 1.17 1.06
0.094
Cpk
X-bar and R-Chart
Sample size (2 – 10)
Cp
Cpu
1.069
Cpl
6
7
8
9
1.12
1.14
Sample Number
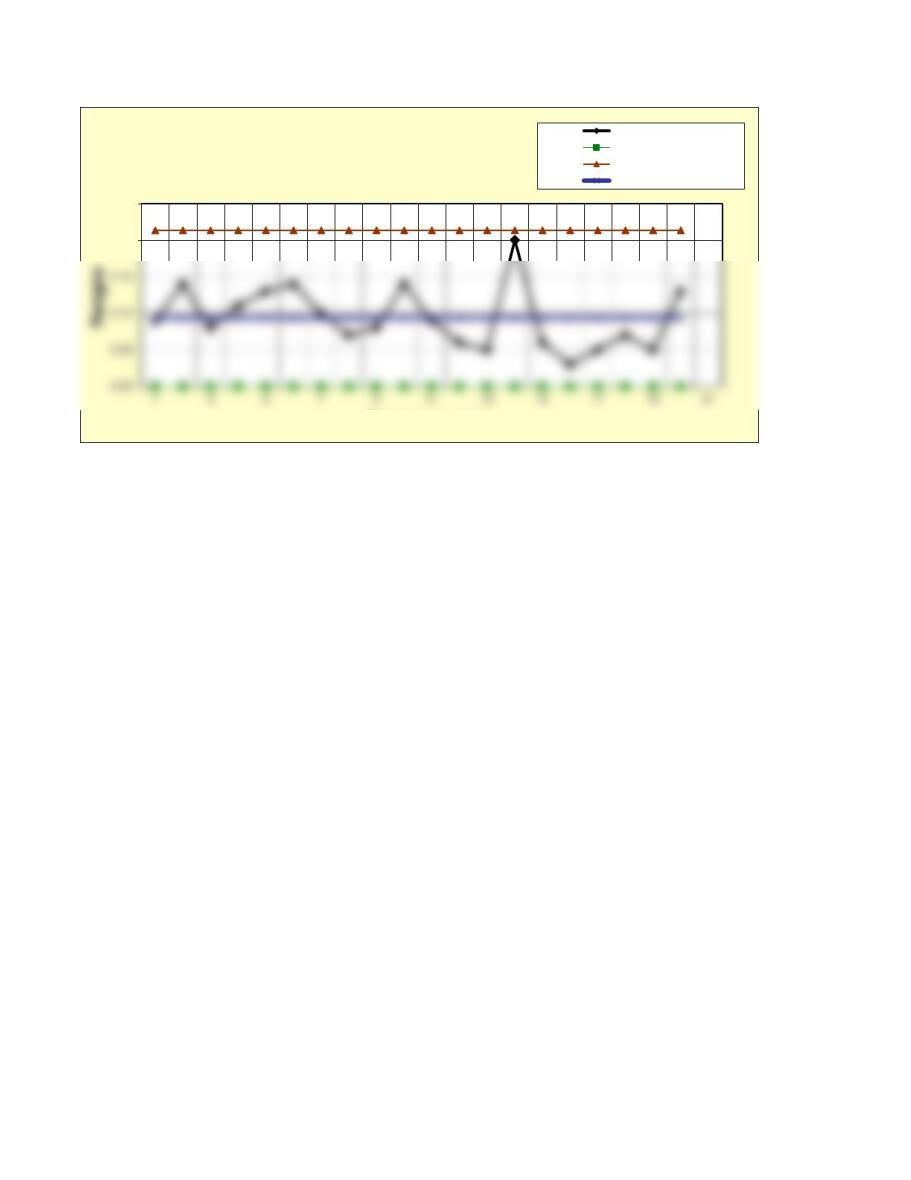
Prob. 8-30B X-bar Chart
Averages
Lower control limit
Upper control limit
Center line
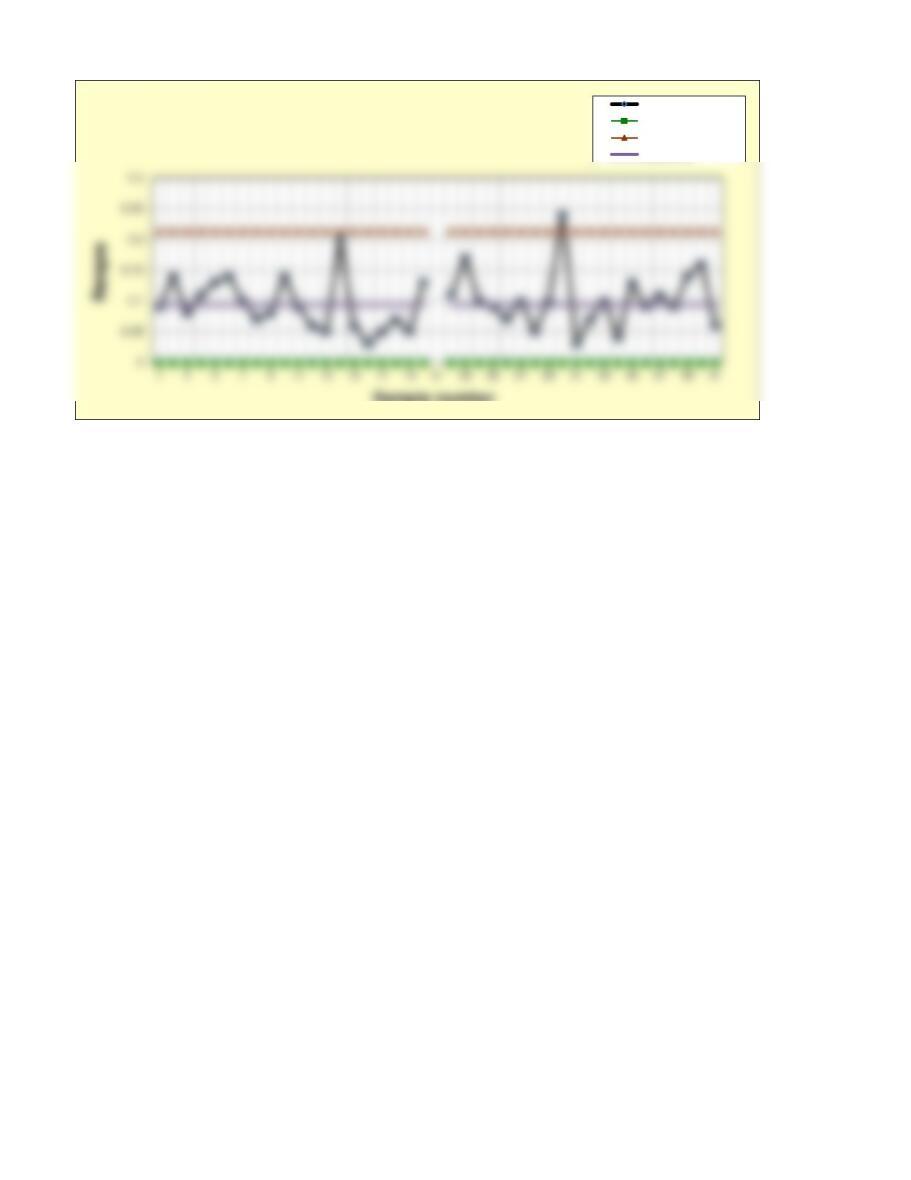
Sample number
Prob. 8-30B R-Chart
Ranges
Lower control limit
Upper control limit
Center line