Problem 8-36
Moby Molding Company
This spreadsheet is designed for up to 50 samples, each of a constant sample size from 2 to 10. Enter data ONLY in yellow-shaded cells.
Enter the number of samples in cell E6 and the sample size in cell E7. Then enter your data in the grid below.
Click on sheet tabs for a display of the control charts (some rescaling may be needed). Specification limits may be entered in cells N7 and N8 for process capability.
Number of samples (<= 50) 30 Process Capability Calculations Six sigma 0.279
4Upper specification 0.12 0.789
Lower specification -0.10 0.795
Grand Average A3 B3 B4 d2 0.784
Avg. std. dev. 1.628 0 2.266 2.06 0.784
8
9
10
Average 0.0425 -0 0.028 0.01 -0.01 0.015 0.008 0.028 -0.02 0 0.003 -0.01 -0.03 0.013 0.003 0.015 0.013 -0.01 0.028 -0.01 0.015 0.03 0.018 0.01 0.023 0.018 -0.01 0.028 0.043 -0.03 #N/A #N/A #N/A #N/A #N/A #N/A #N/A #N/A #N/A #N/A #N/A #N/A #N/A #N/A #N/A #N/A #N/A #N/A #N/A #N/A
LCLx-bar -0.067 -0.07 –0.07 -0.07 -0.07 -0.07 -0.07 –0.07 -0.07 -0.07 -0.07 -0.07 -0.07 -0.07 -0.07 -0.07 -0.07 -0.07 -0.07 -0.07 -0.07 -0.07 -0.07 -0.07 –0.07 -0.07 -0.07 -0.07 -0.07 -0.07 –0.07 -0.07 -0.07 -0.07 -0.07 -0.07 -0.07 -0.07 -0.07 -0.07 -0.07 -0.07 -0.07 -0.07 -0.07 -0.07 -0.07 –0.07 -0.07 -0.07
Center 0.0093 0.009 0.009 0.009 0.009 0.009 0.009 0.009 0.009 0.009 0.009 0.009 0.009 0.009 0.009 0.009 0.009 0.009 0.009 0.009 0.009 0.009 0.009 0.009 0.009 0.009 0.009 0.009 0.009 0.009 0.009 0.009 0.009 0.009 0.009 0.009 0.009 0.009 0.009 0.009 0.009 0.009 0.009 0.009 0.009 0.009 0.009 0.009 0.009 0.009
DO NOT MODIFY THIS TABLE
nA2 D3 D4 d2 A3 B3 B4
2 1.880 0.000 3.267 1.128 2.659 0.000 3.267
3 1.023 0.000 2.574 1.693 1.954 0.000 2.568
4 0.729 0.000 2.282 2.059 1.628 0.000 2.266
5 0.577 0.000 2.114 2.326 1.427 0.000 2.089
6 0.483 0.000 2.004 2.534 1.287 0.030 1.970
7 0.419 0.076 1.924 2.704 1.182 0.118 1.882
8 0.373 0.136 1.864 2.847 1.099 0.185 1.815
9 0.337 0.184 1.816 2.970 1.032 0.239 1.761
Control Chart Factors
X-bar and s-Chart
Sample size (2 – 10)
0.0093
0.0466
Cp
Cpu
Cpl
Cpk
5
6
7
0.06
0.08
0.1
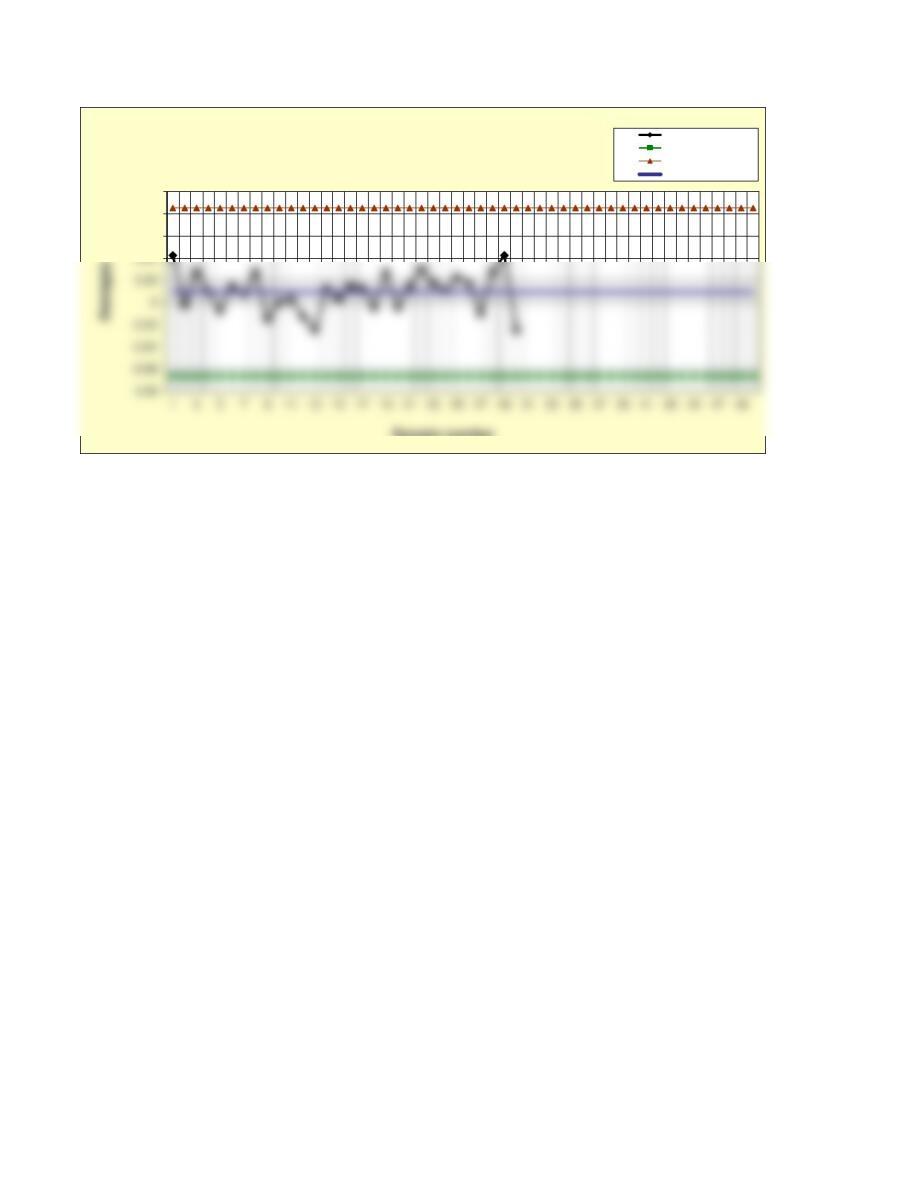
Sample number
Prob. 8-36 X-bar Chart
Averages
Lower control limit
Upper control limit
Center line
0
0.1
0.12
1357911 13 15 17 19 21 23 25 27 29 31 33 35 37 39 41 43 45 47 49
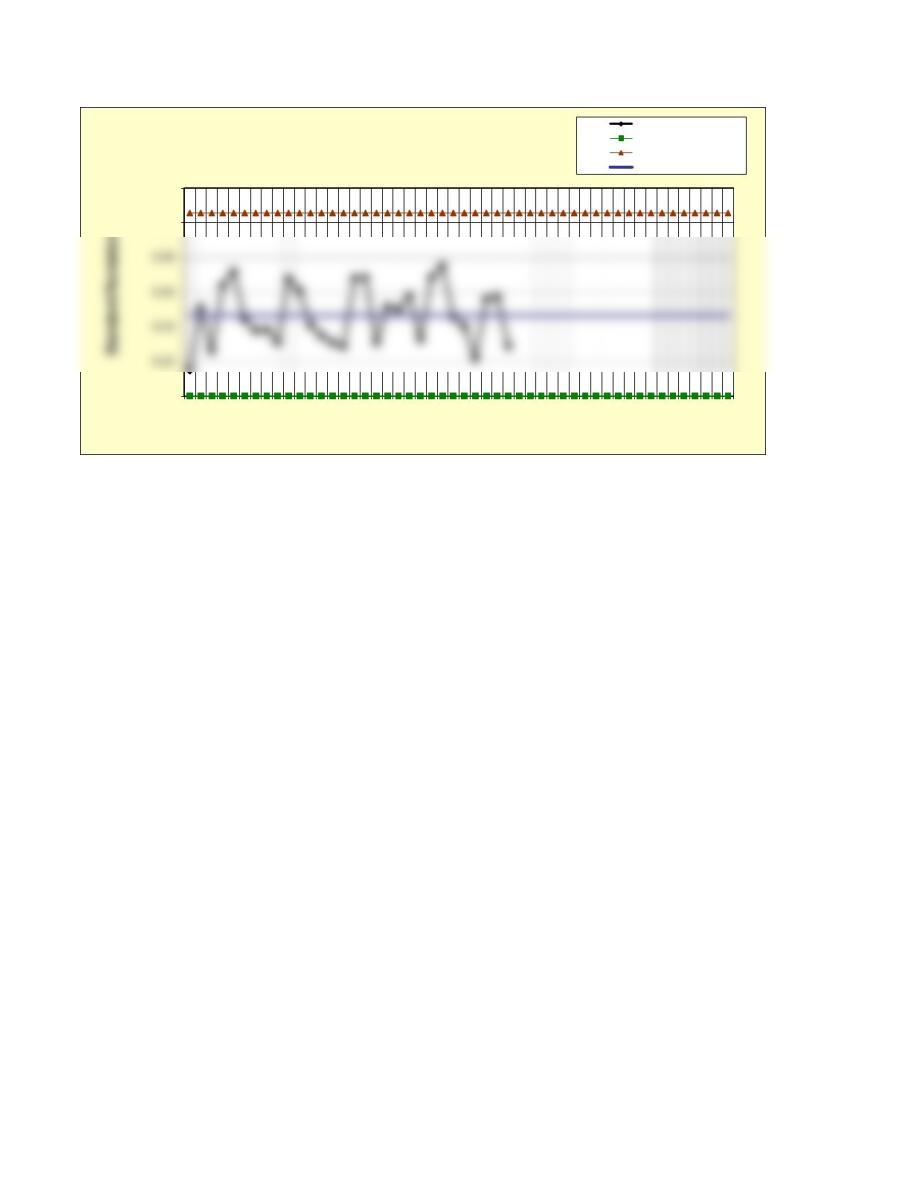
Sample number
Prob. 8-36 s-Chart
Standard Deviations
Lower control limit
Upper control limit
Center line