Chapter 8 – Measuring and Controlling Quality 81
37. Calculate the process capability statistics for the outside diameters of the bottles made on
the injection molding machine at the Moby Molding Co. (from Prob. 8-36). Use 0.12 as
the upper tolerance limit and – 0.10 as the lower tolerance limit for this important
measure of process performance. What recommendation would you make to management
concerning the process, based on these findings?
Answer
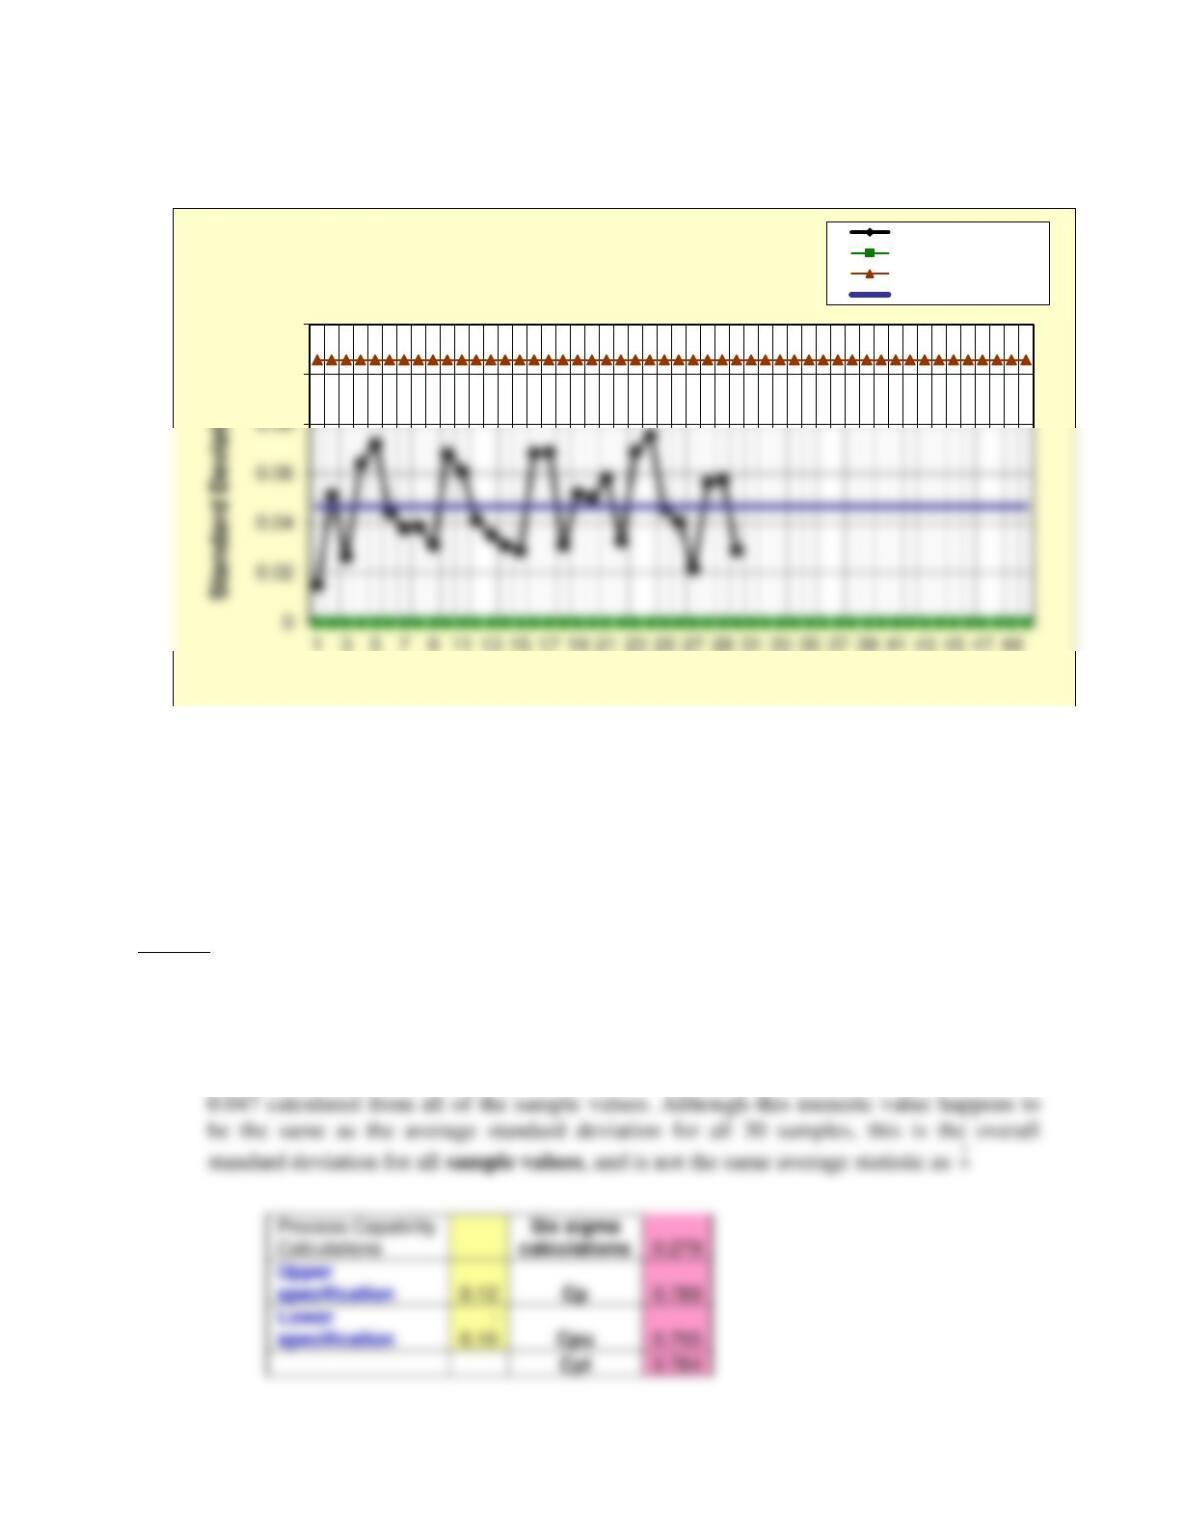
37. The process is not capable at this point. None of the values of Cp, Cpu, Cpl, Cpk are greater
than 1.0
Note that the spreadsheet from problem 8-36 uses an actual standard deviation of =
0.1
0.12
1357911 13 15 17 19 21 23 25 27 29 31 33 35 37 39 41 43 45 47 49
Sample number
Prob. 8-36 s-Chart
Standard Deviations
Lower control limit
Upper control limit
Center line
Chapter 8 – Measuring and Controlling Quality 82
38. Chief Henry Batter of the Gotham City Police Department is trying to reduce the time
required to answer the phone at police headquarters (in fractions of a minute). The data in
the worksheet for Prob. 8-38 in the C08Data.xlsx file on the Student Companion Site for
this chapter represent time in fractions of minutes for three individual readings taken at
random for 25 days.
a. Compute control limits for an x-chart (chart for individuals) using the statistic R/d2,
with a 3-period moving range, as an estimate of the standard deviation.
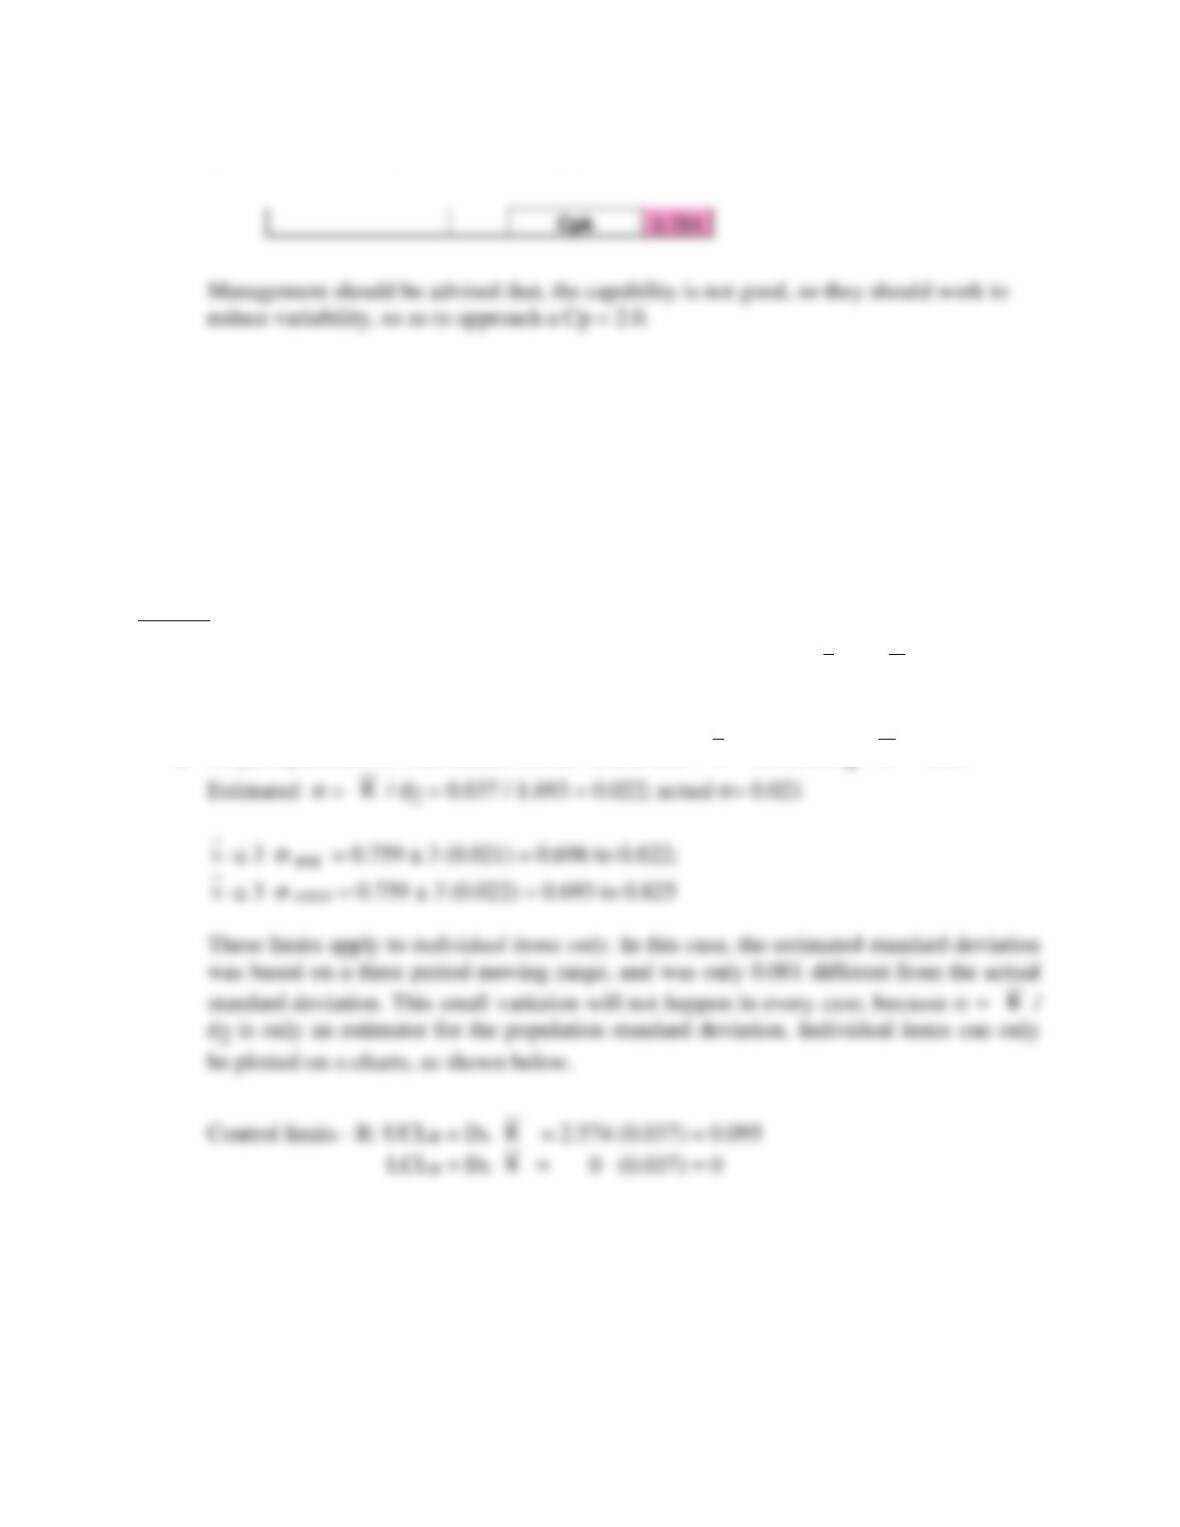
b. Construct an x-chart for individuals, using the data. Interpret the results.
Answer
38. See spreadsheet Prob.08-38IVxlsx for details. Values, below, for
x
and
R
were obtained
from the spreadsheet calculations.
a) Preparing a chart for individuals: Center Lines, CLx :
x
= 0.759; CLR :
R
= 0.037
R
x
Chapter 8 – Measuring and Controlling Quality 83
0.65
0.67
0.85
1 4 7 10 13 16 19 22 25 28 31 34 37 40 43 46 49 52 55 58 61 64 67 70 73
Observation number
Prob. 8-38 – Individuals (X) Chart
Individuals
Upper control limit
Center line
Lower control limit
0.09
0.1
Prob. 8-38 Moving Range Chart
Moving ranges
Lower control limit
Center line
Upper control limit
Chapter 8 – Measuring and Controlling Quality 84
39. Charlie Plato owns Charlie’s China Emporium, which sells inexpensive cups, dishes, and
bric-a-brack in a seaside resort. She has three checkout stations, which she would like to
test to see if they are under control and capable. She considers sales of $36.50 per hour,
per station, to be a representative average. Consider the data for 75 individual results of
sales dollars per hour, per unit, shown in the worksheet Prob. 8-39 in the C08Data.xlsx
file.
a. Compute control limits for an x-chart (chart for individuals) using the statistic
R
/d2 as
an estimate of the standard deviation with a 3-period moving range.
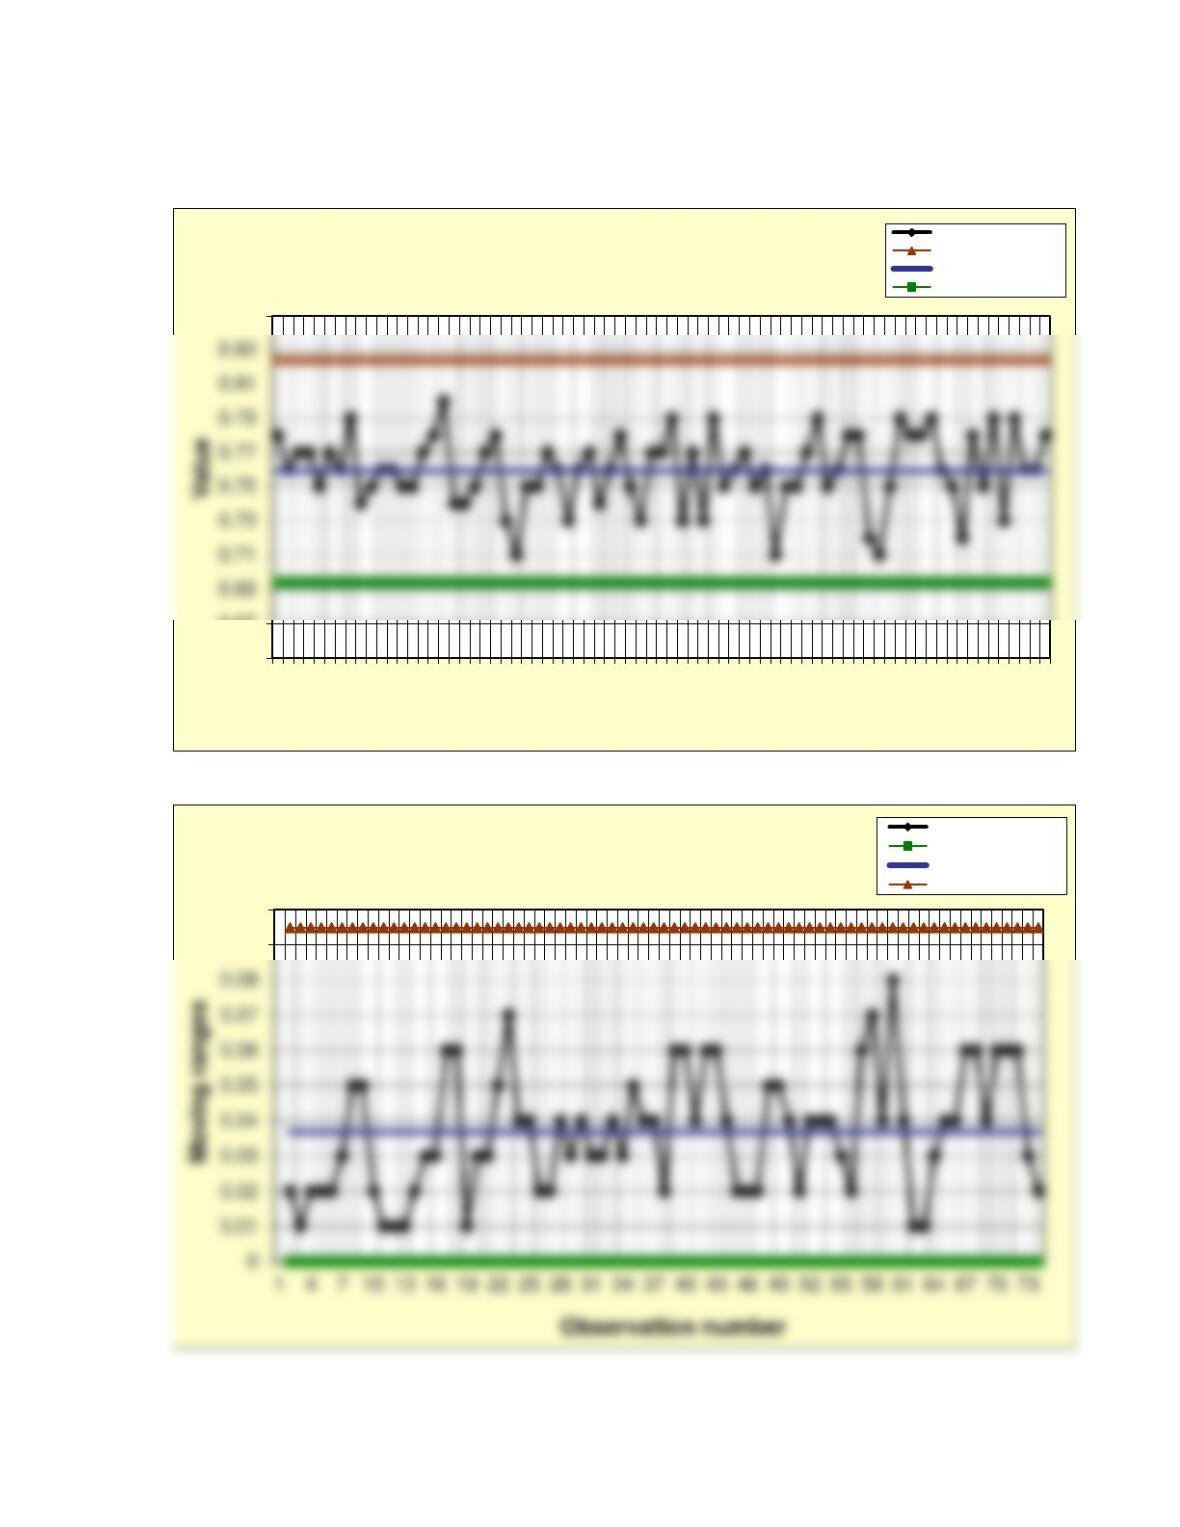
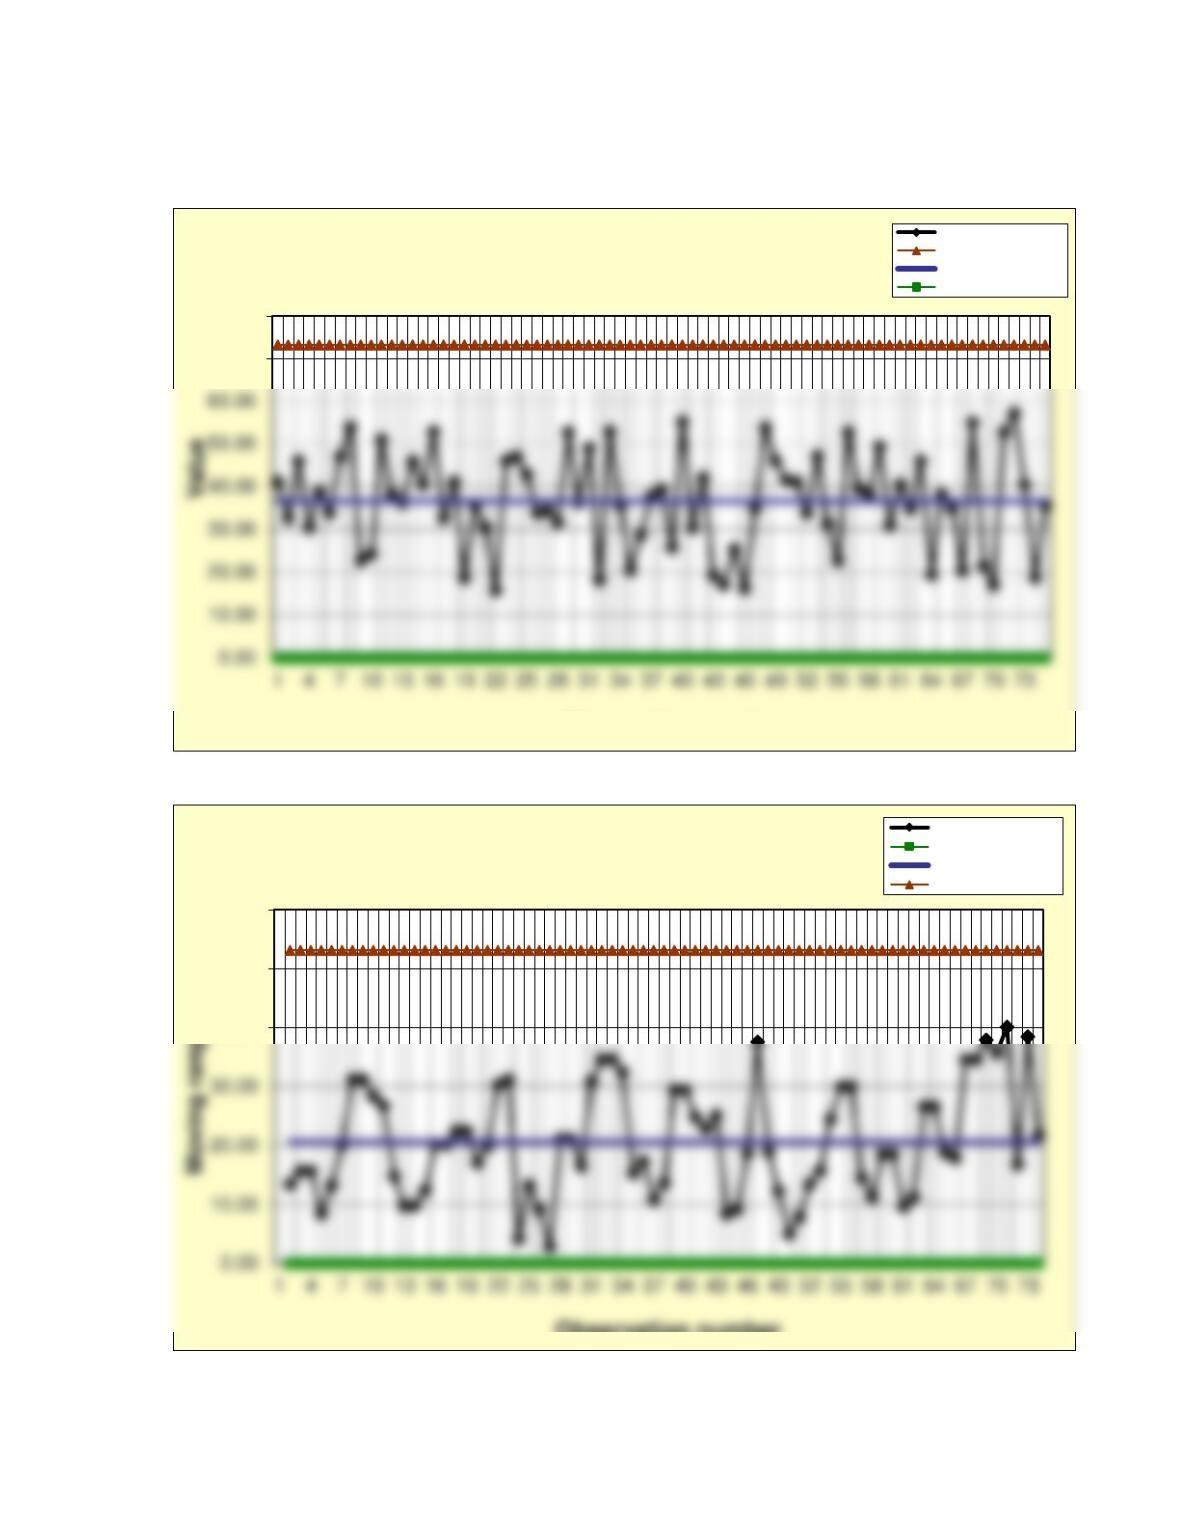
b. Construct an x-chart for individuals, using the data. Interpret the results.
Answer
39. See spreadsheet Prob08-39IV.xlsx in the Instructor materials for details. Values, below,
for
x
and
R
were obtained from the spreadsheet calculations.
R
x
Chapter 8 – Measuring and Controlling Quality 85
70.00
80.00
Observation number
Prob. 8-39 – Individuals (X) Chart
Individuals
Upper control limit
Center line
Lower control limit
40.00
50.00
60.00
Observation number
Prob. 8-39 Moving Range Chart
Moving ranges
Lower control limit
Center line
Upper control limit
Chapter 8 – Measuring and Controlling Quality 86
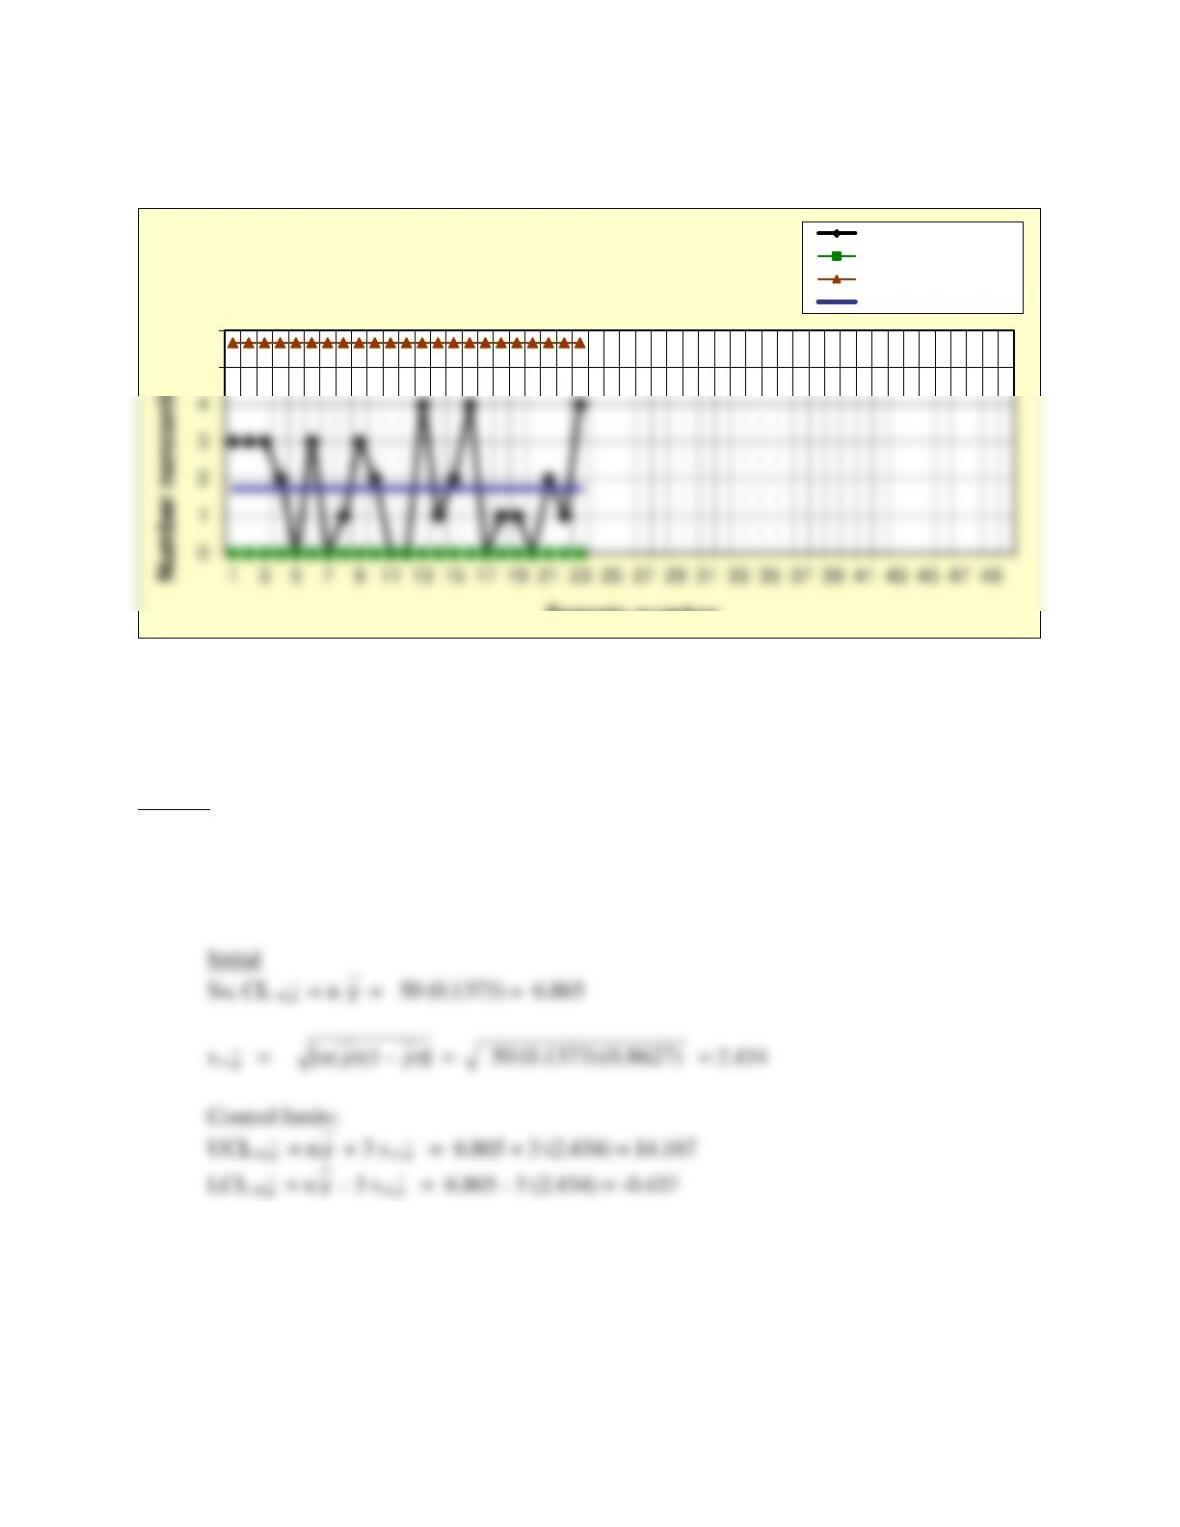
40. Thirty samples of 75 items each were inspected at the Yummy Candy Company and 75
items were found to be defective. Compute control limits for a p-chart for this process.
Answer
40. Control limits for Yummy Candy Company are as follows:
CL
p
= 75/2250 = 0.0333
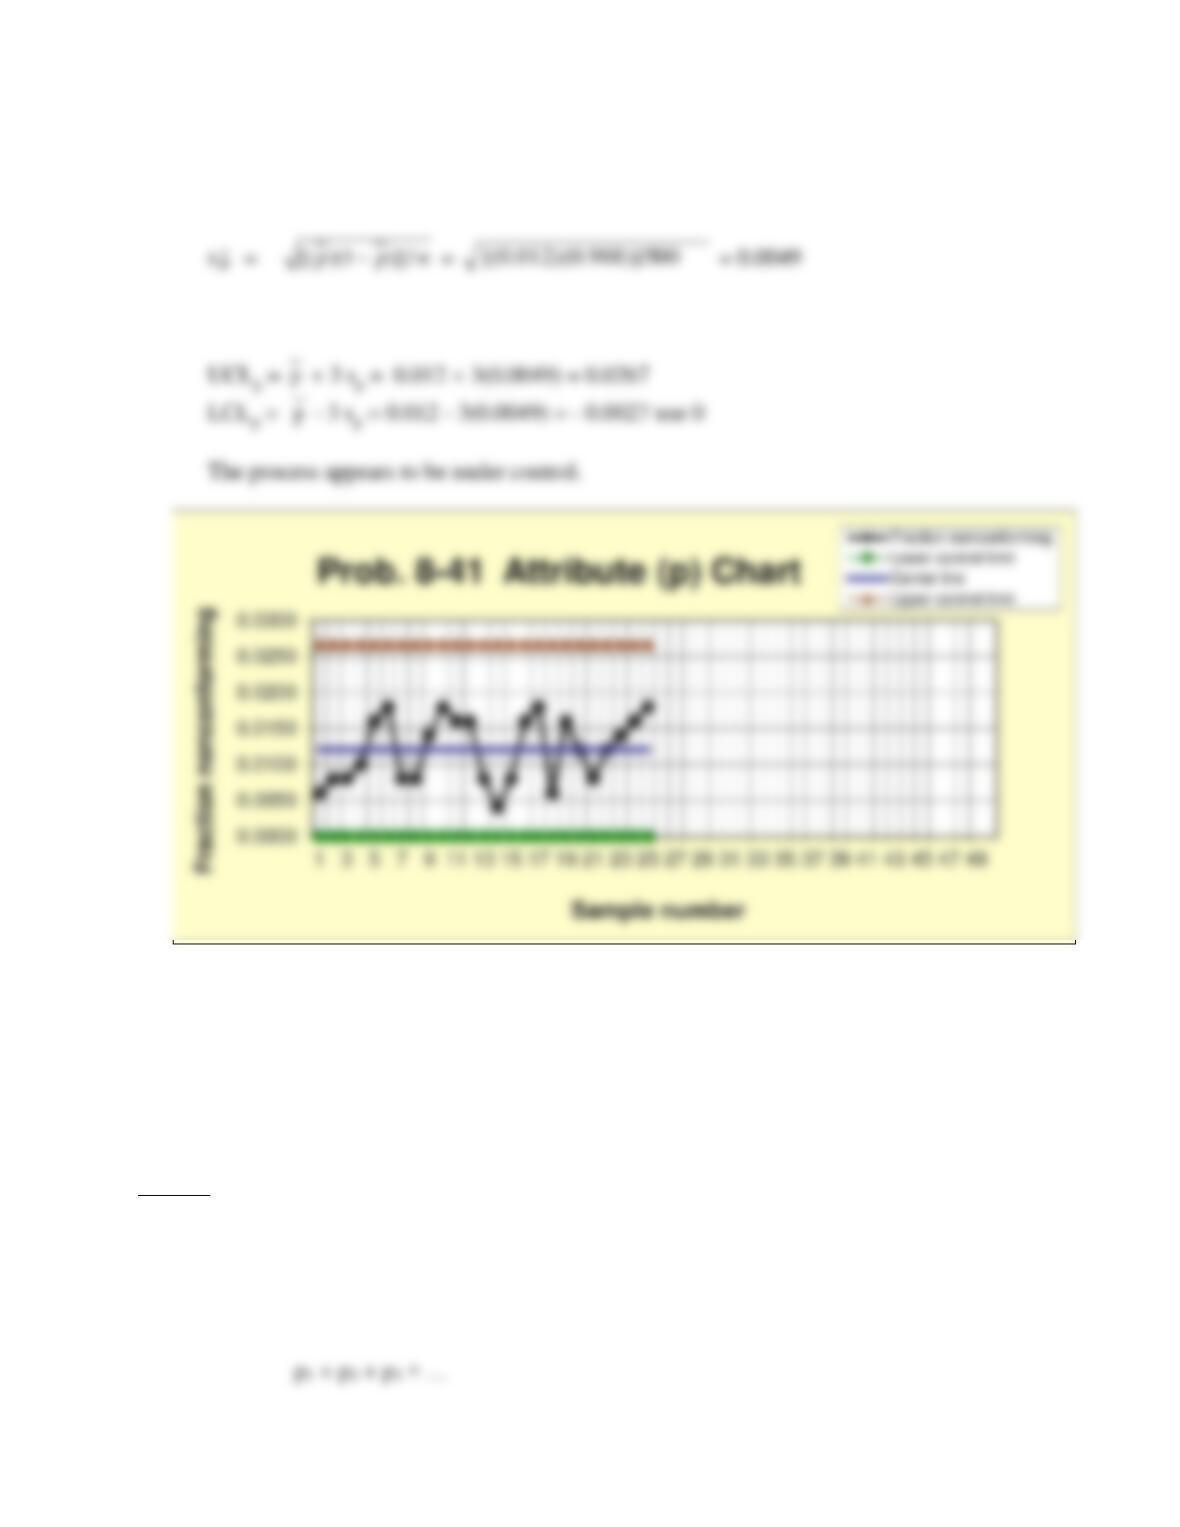
41. Samples of packages orders were taken at the R.A. Treinta Package Co. to determine if
the orders were prepared correctly. The percent defectives for each sample are given in
the worksheet Prob. 8-41 in the C08Data.xlsx file on the Student Companion Site for this
chapter for 25 samples. Five hundred orders are inspected each day for each sample.
Construct a p-chart and interpret the results.
Answer
41. See spreadsheet Prob08-41P.xlsx in the Instructor materials for details. Control limits for
the R.A. Treinta Package Co. orders can be calculated using:
CL
p
= 0.012
Chapter 8 – Measuring and Controlling Quality 87
Control limits:
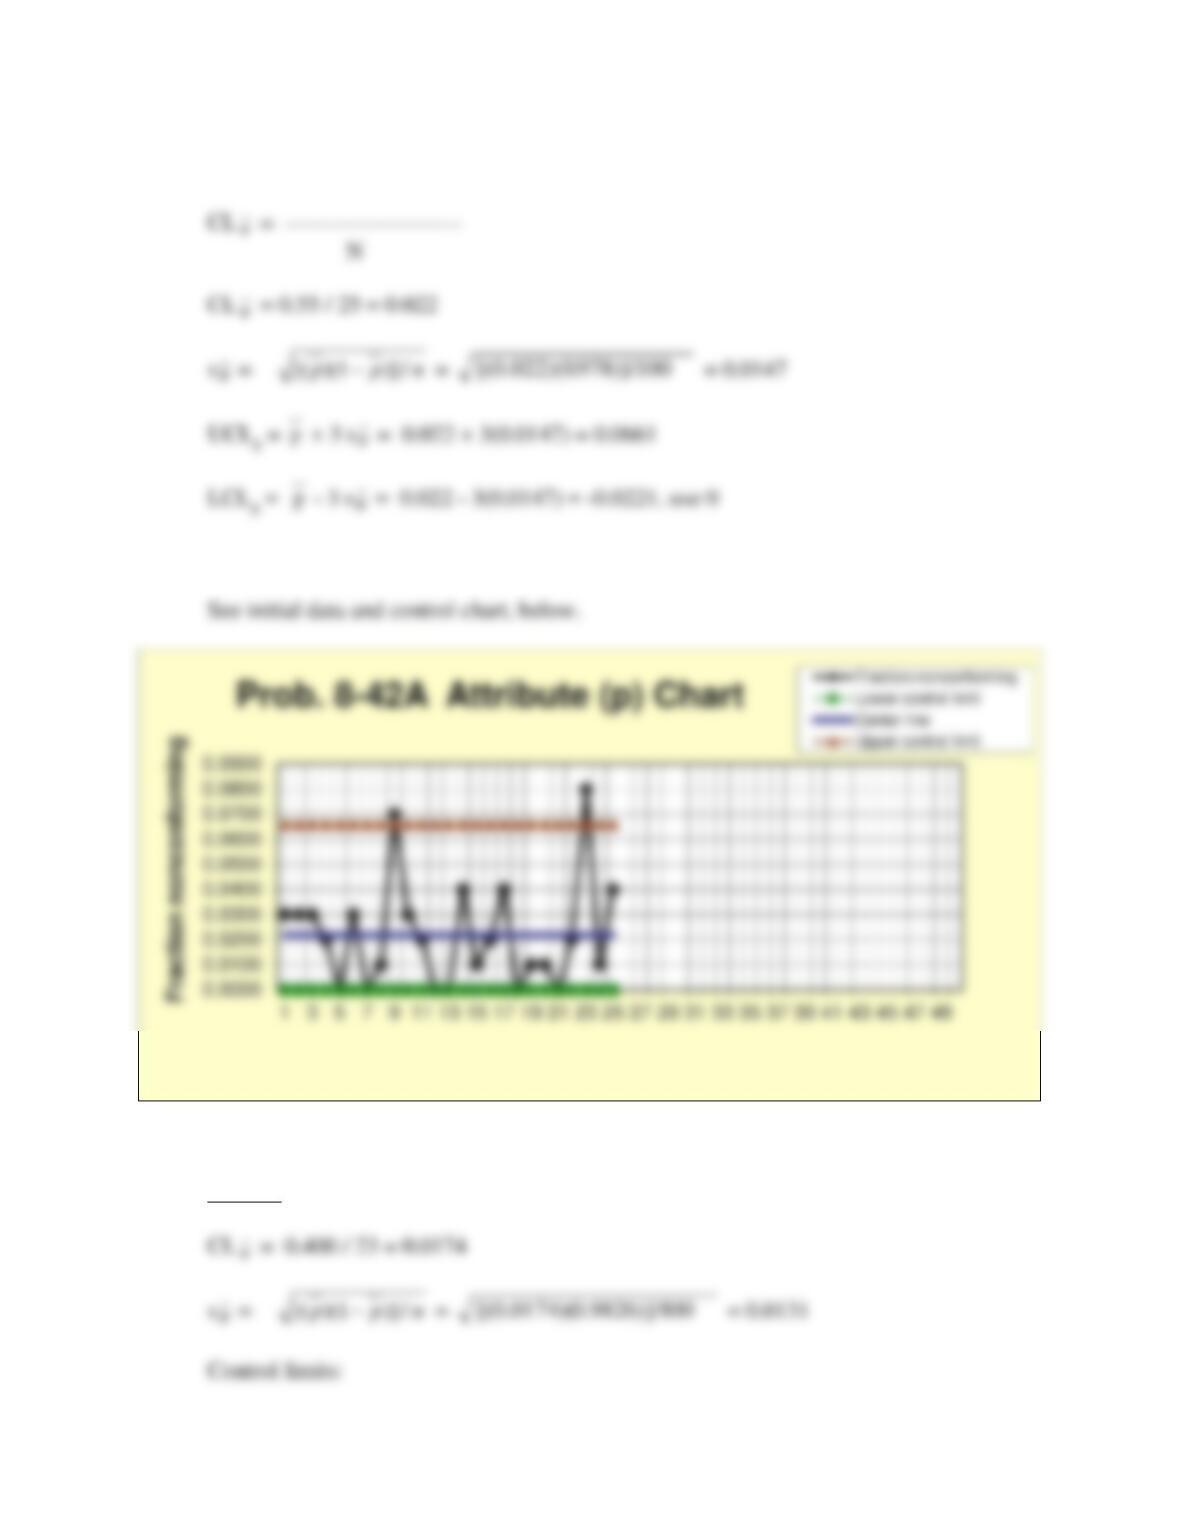
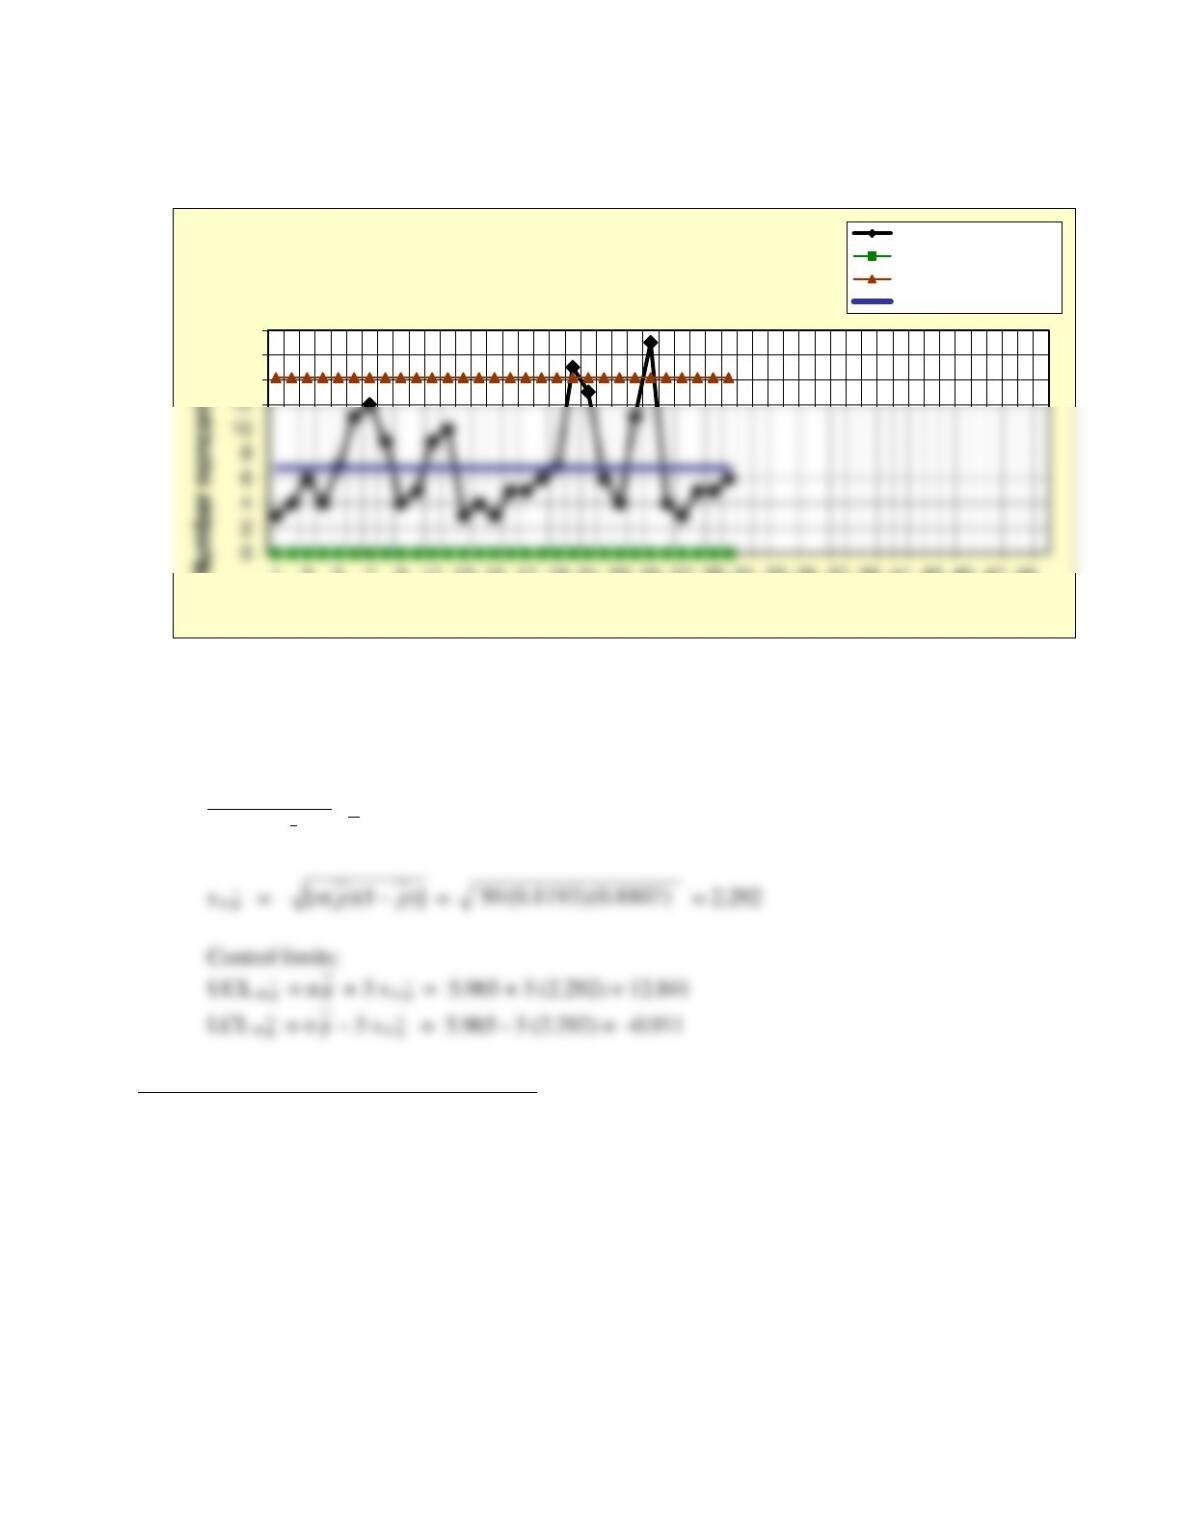
42. One hundred insurance claim forms are inspected daily at Full Life Insurance Co. over 25
working days, and the number of forms with errors have been recorded in the worksheet
Prob. 8-42 in the C08Data.xlsx file. Construct a p-chart. If any points occur outside the
control limits, assume that assignable causes have been determined. Then construct a
revised chart.
Answer
42. See spreadsheets for Full Life Insurance Co. in file Prob08-42P.xlsx in the Instructor
materials for details.
a) Initially, based on the sum of the p values for the 25 samples,
Chapter 8 – Measuring and Controlling Quality 88
Throw out #9 and #23, out-of-control values, revise.
35. b) Revised
Sample number
Chapter 8 – Measuring and Controlling Quality 89
The conclusion is that the process is now in control.
Problem 35-b Final Revised Control Chart
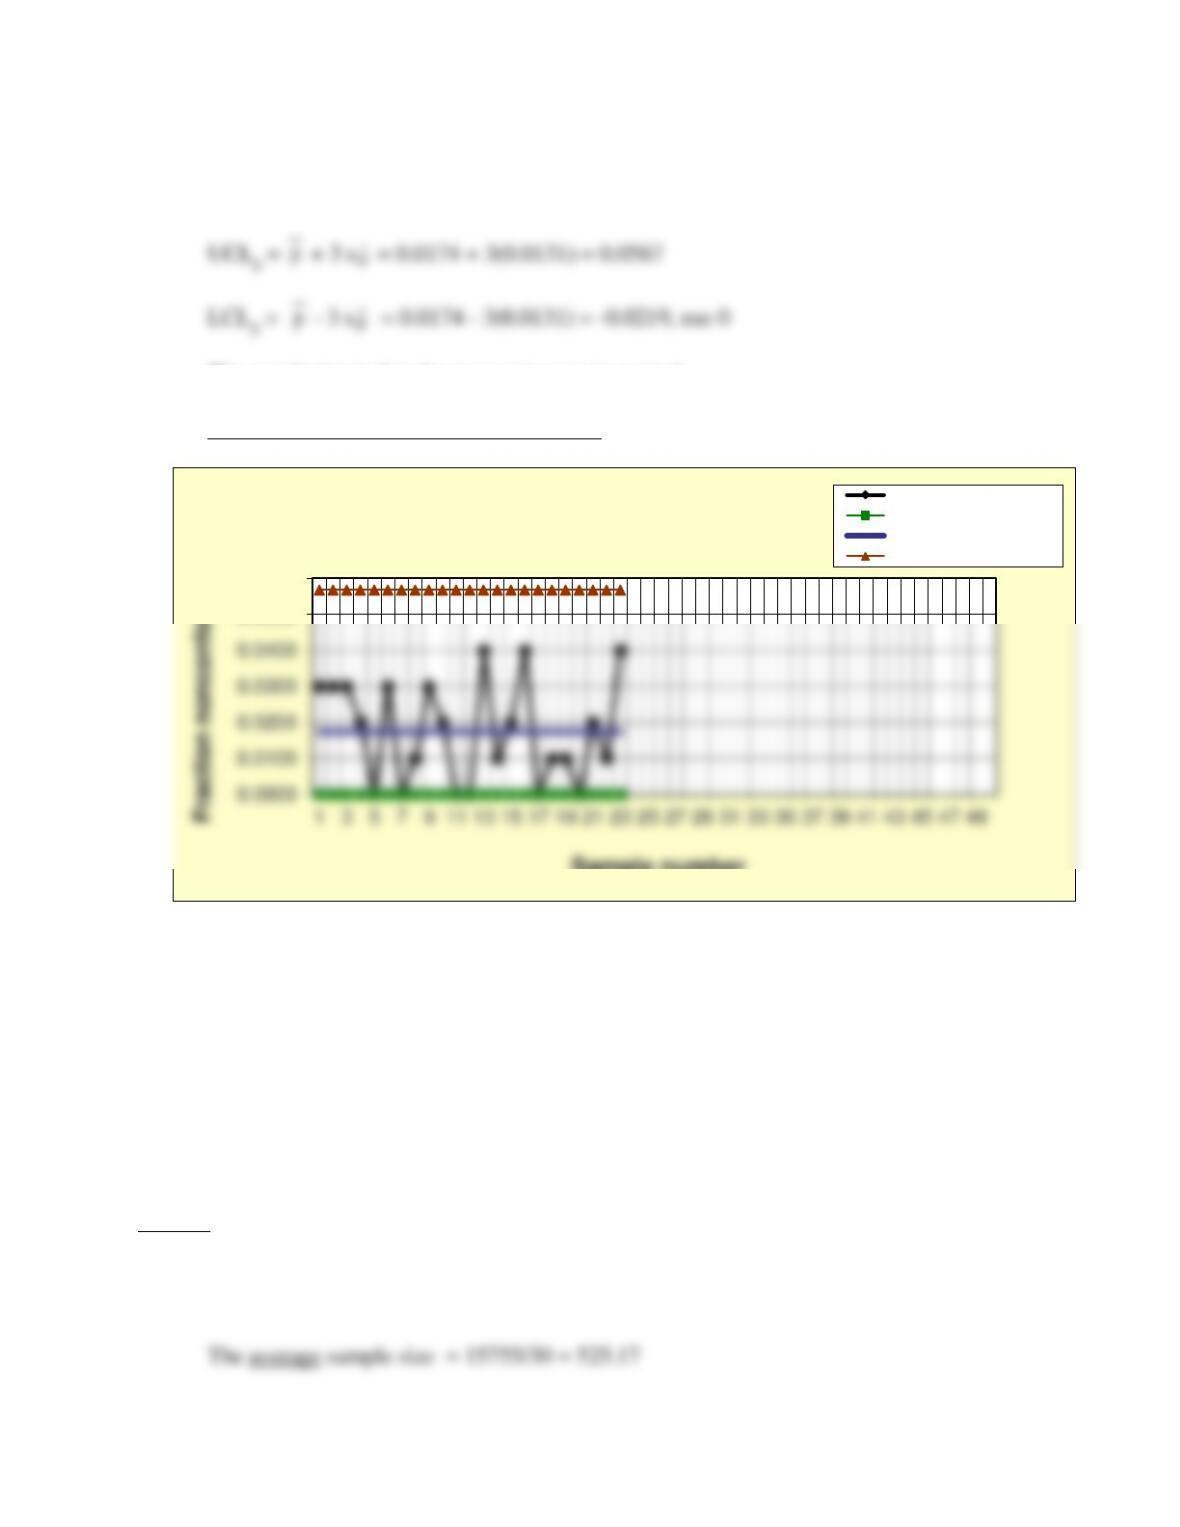
43. SpeedyNetService.com, an Internet service provider (ISP), is concerned that the level of
access of customers is decreasing, due to heavier use. The proportion of peak period time
when a customer is likely to receive busy signals is considered a good measure of service
level. The percentage of times a customer receives a busy signal during peak periods
varies. Using a sampling process, the ISP set up control charts to monitor the service
level, based on proportion of busy signals received. Construct the p–chart using on the
sample data in the table in the worksheet Prob.8-43 in the C08Data.xlsx file on the
Student Companion Site for this chapter. What does the chart show? Is the service level
good or bad, in your opinion?
Answer
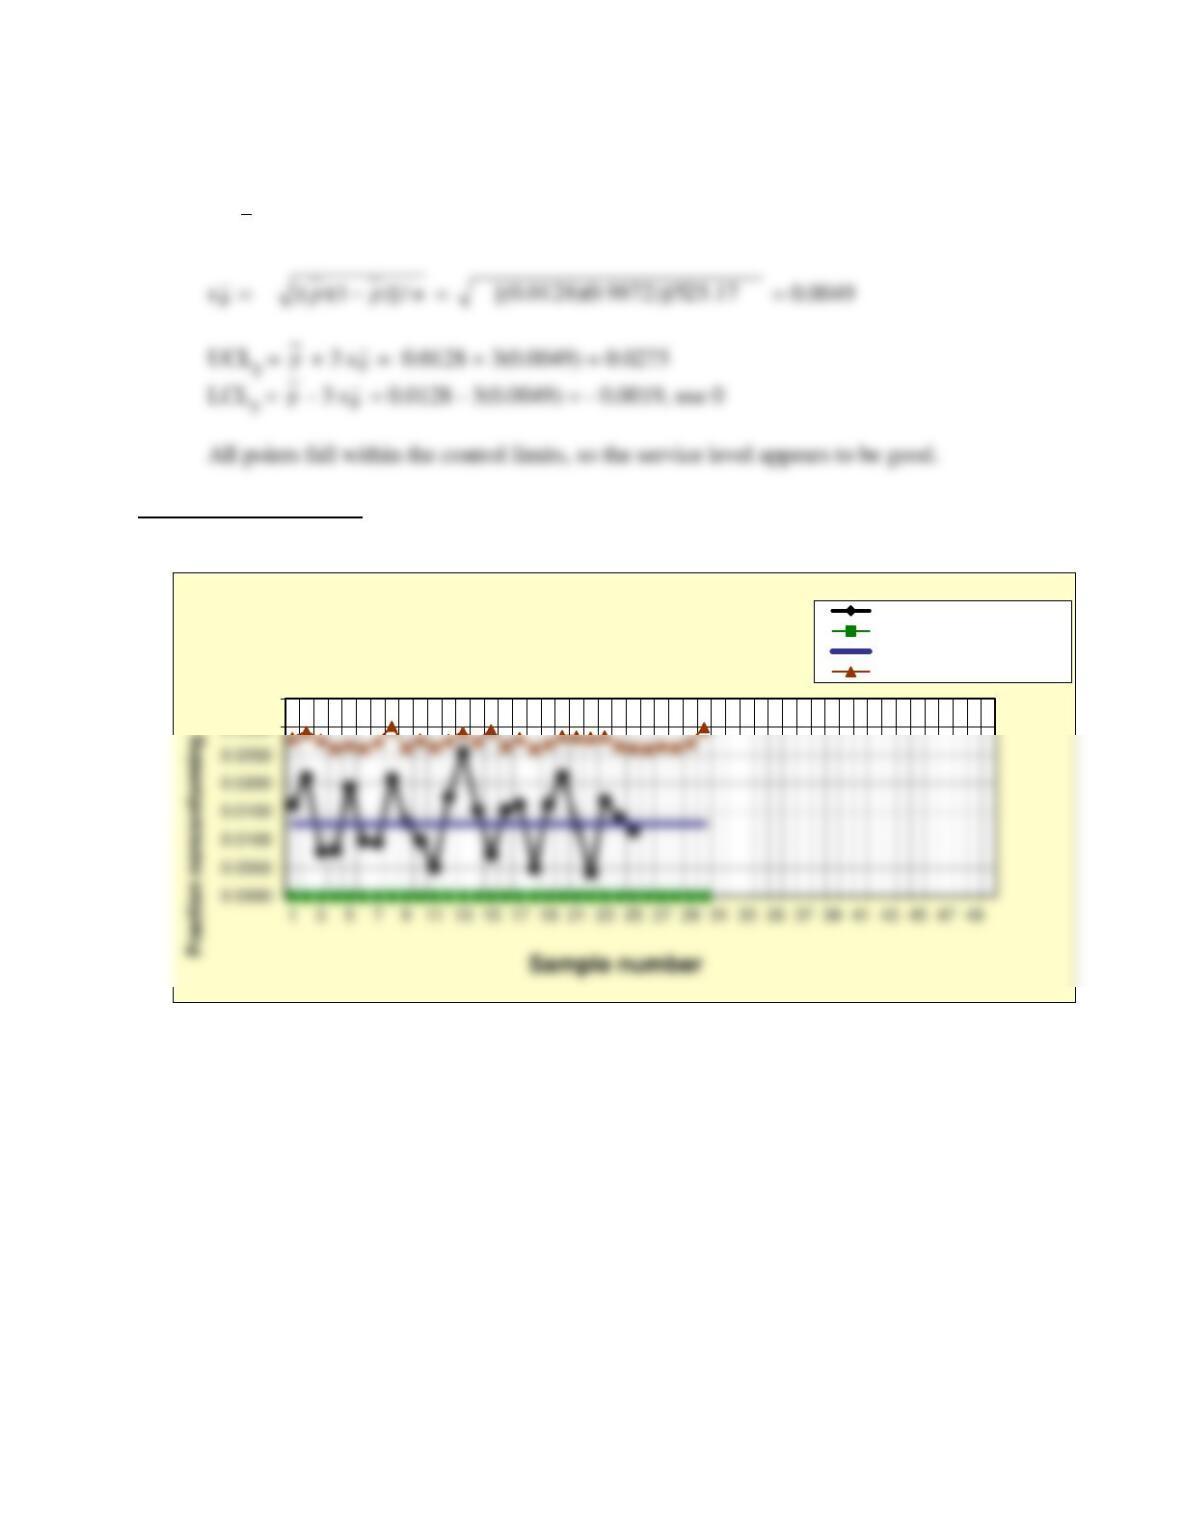
43. See spreadsheet Prob08-43P.xlsx in the Instructor materials for details about
SpeedyNetService.com.
0.0500
0.0600
Sample number
Prob. 8-42B Attribute (p) Chart Fraction nonconforming
Lower control limit
Center line
Upper control limit
Chapter 8 – Measuring and Controlling Quality 90
CL
p
= 202 / 15755 = 0.0128
Problem 8-43: p-charts
0.0300
0.0350
Prob. 8-43 Attribute (p) Chart
Fraction nonconforming
Lower control limit
Center line
Upper control limit
Chapter 8 – Measuring and Controlling Quality 91
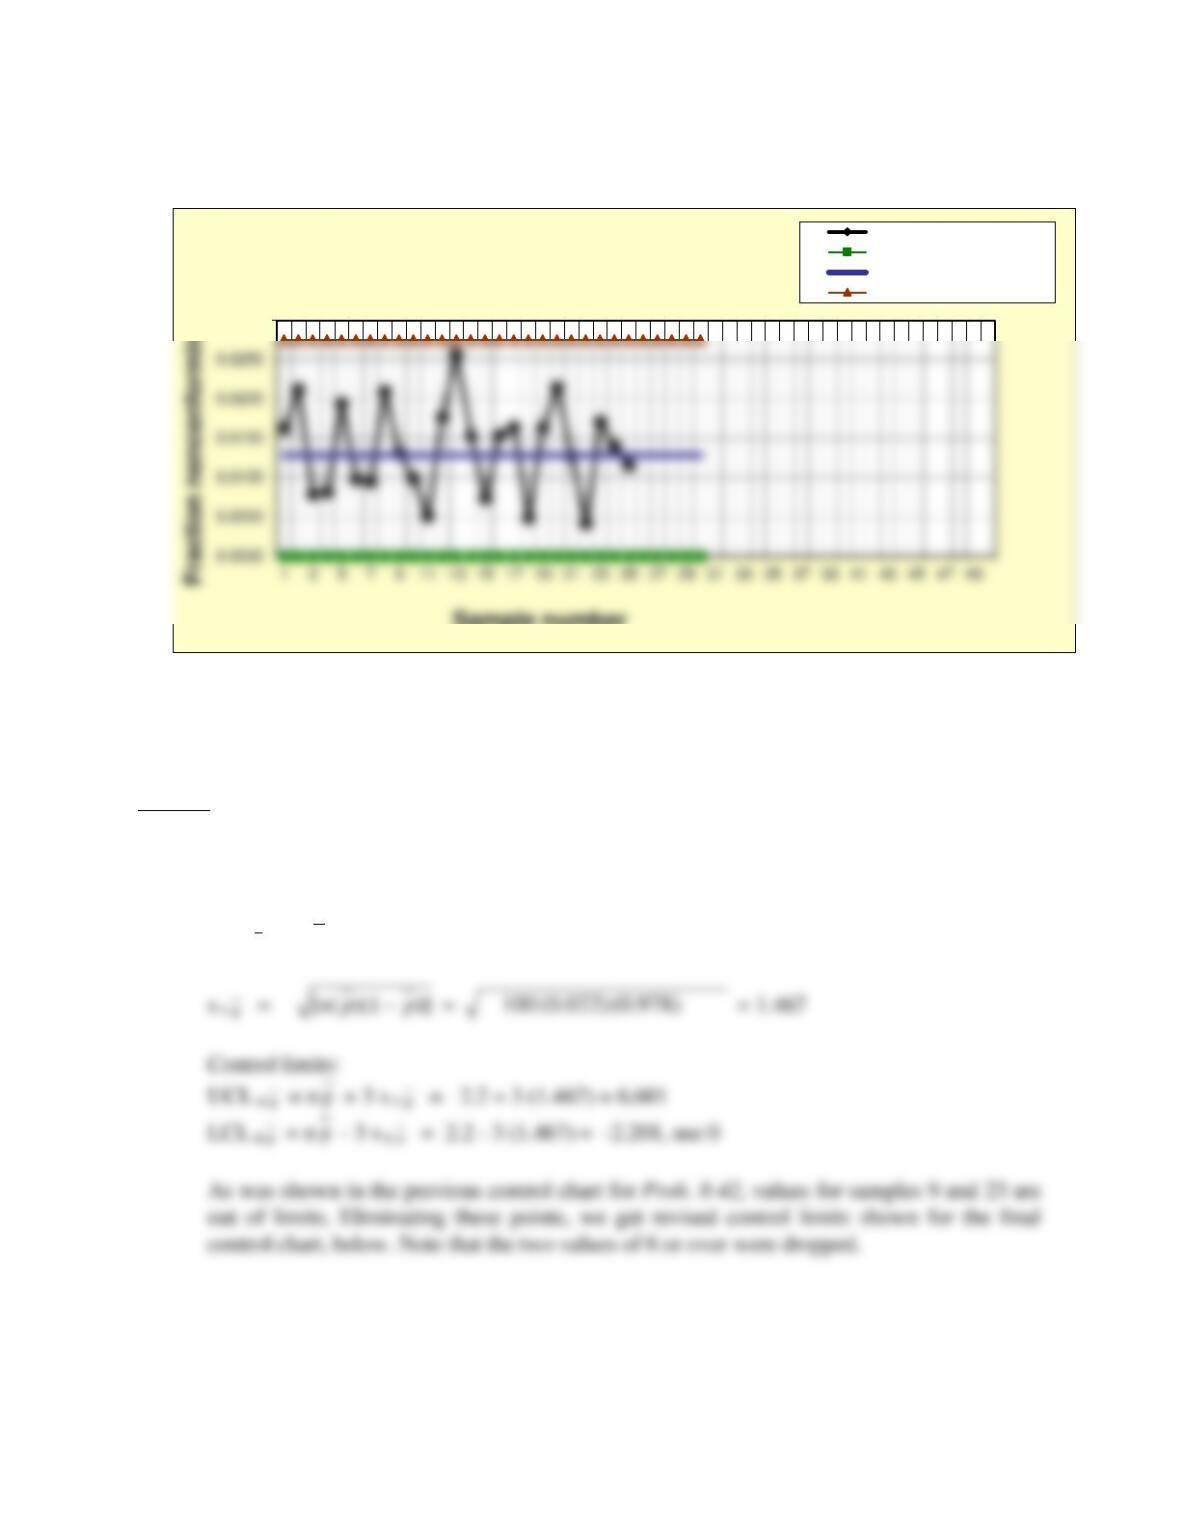
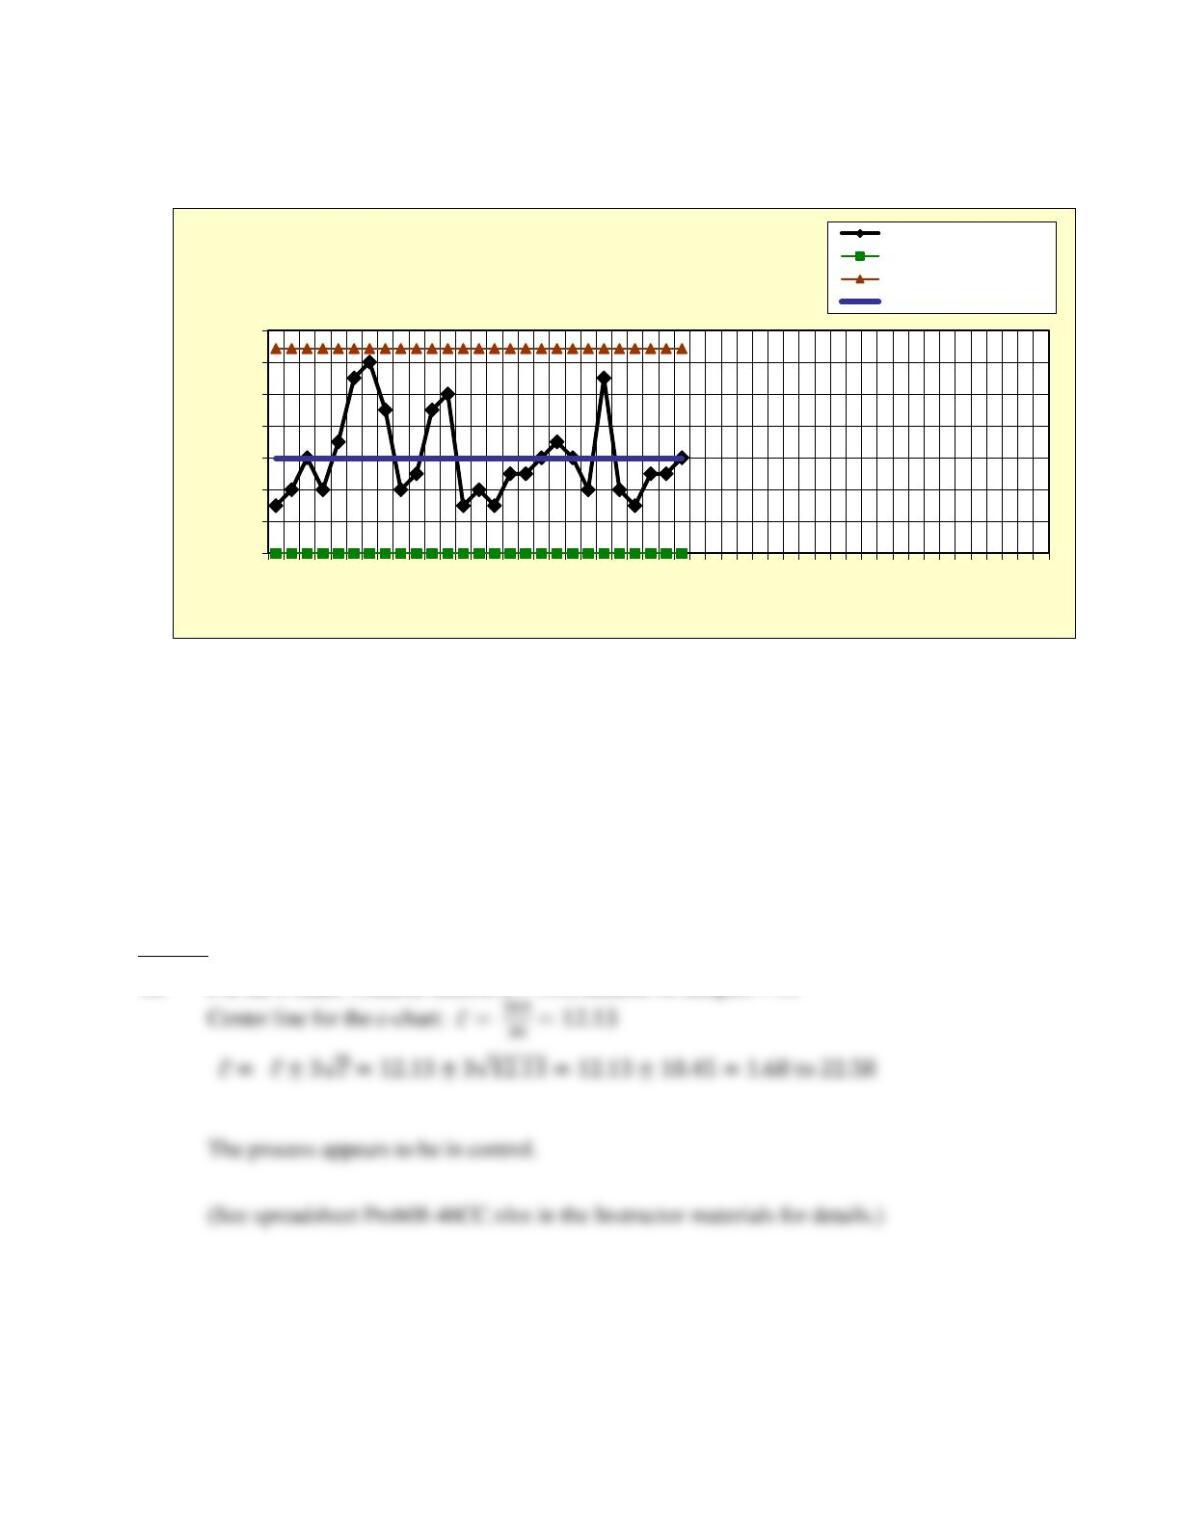
44. Construct an np-chart using the data in Prob. 8-42, the Full Life Insurance Co. What does
the chart show?
Answer
44. See spreadsheets Prob08-44NP.xlsx in the Instructor materials for details. Using data
from Prob.8-42, we get:
CL n
p
= n
p
= 100 (0.022) = 2.2
0.0300
Sample number
Prob. 8-43 Attribute (p) Chart
(approximate control limits)
Fraction nonconforming
Lower control limit
Center line
Upper control limit
p
p
p
Chapter 8 – Measuring and Controlling Quality 92
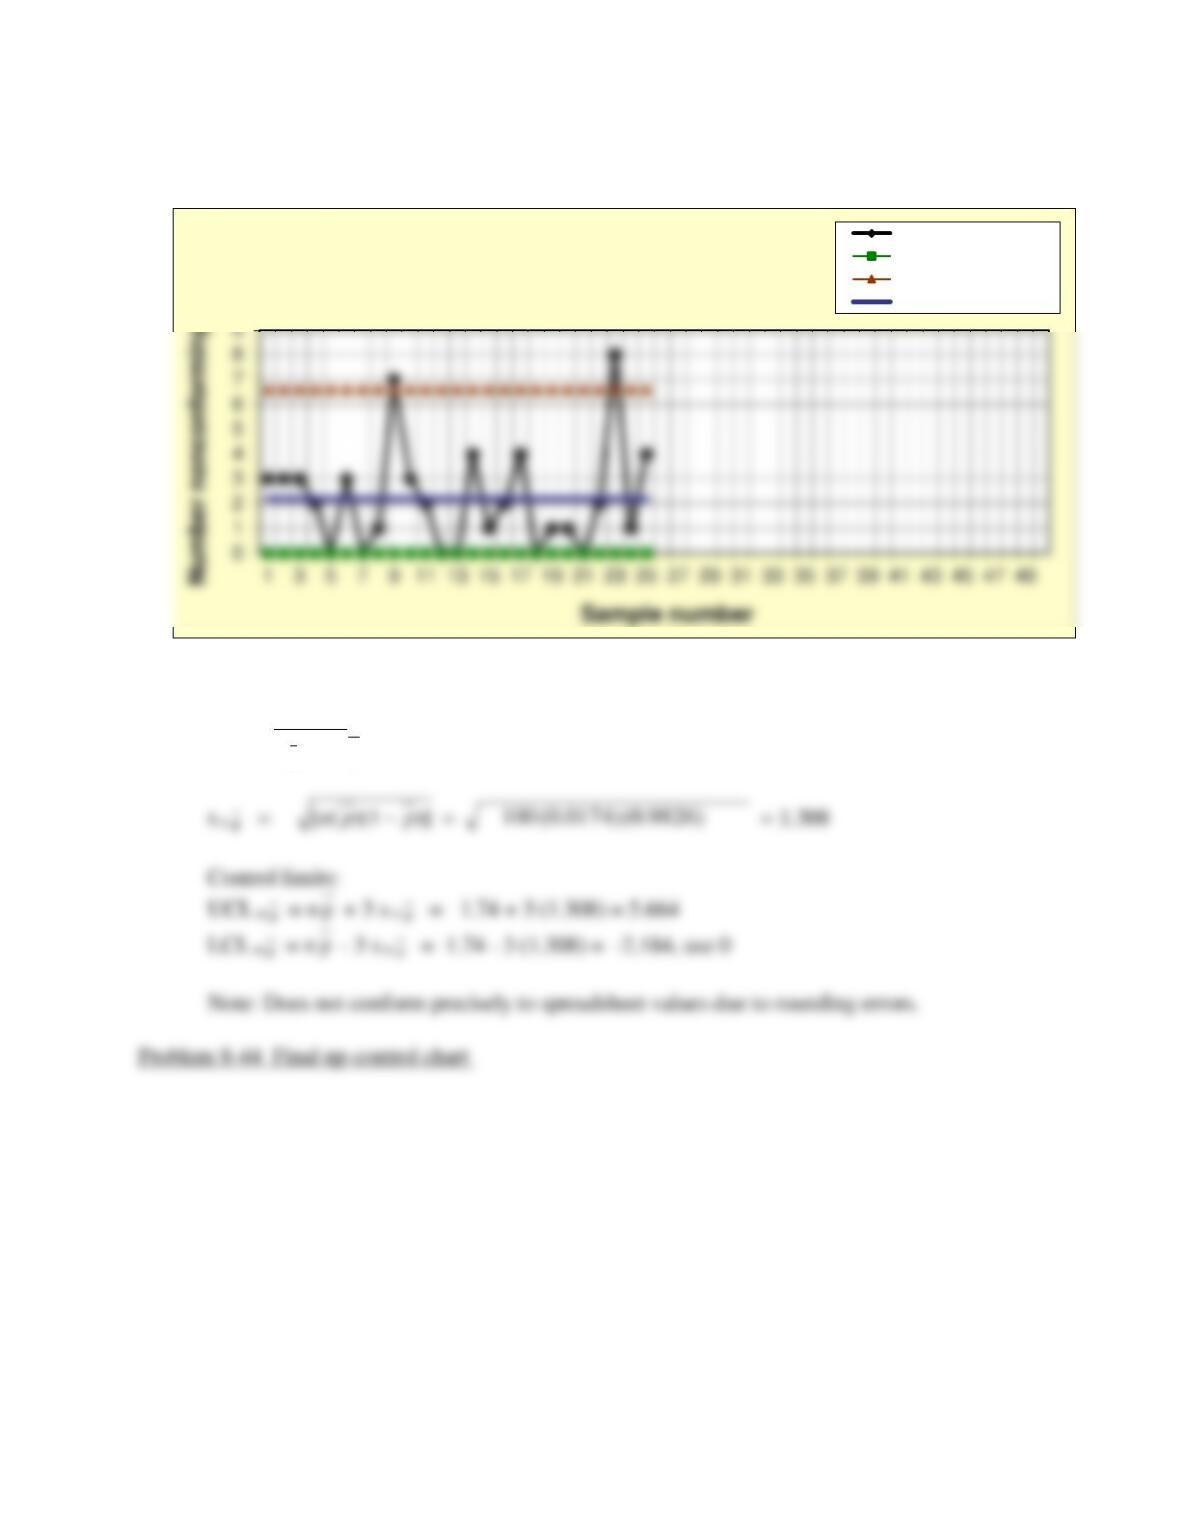
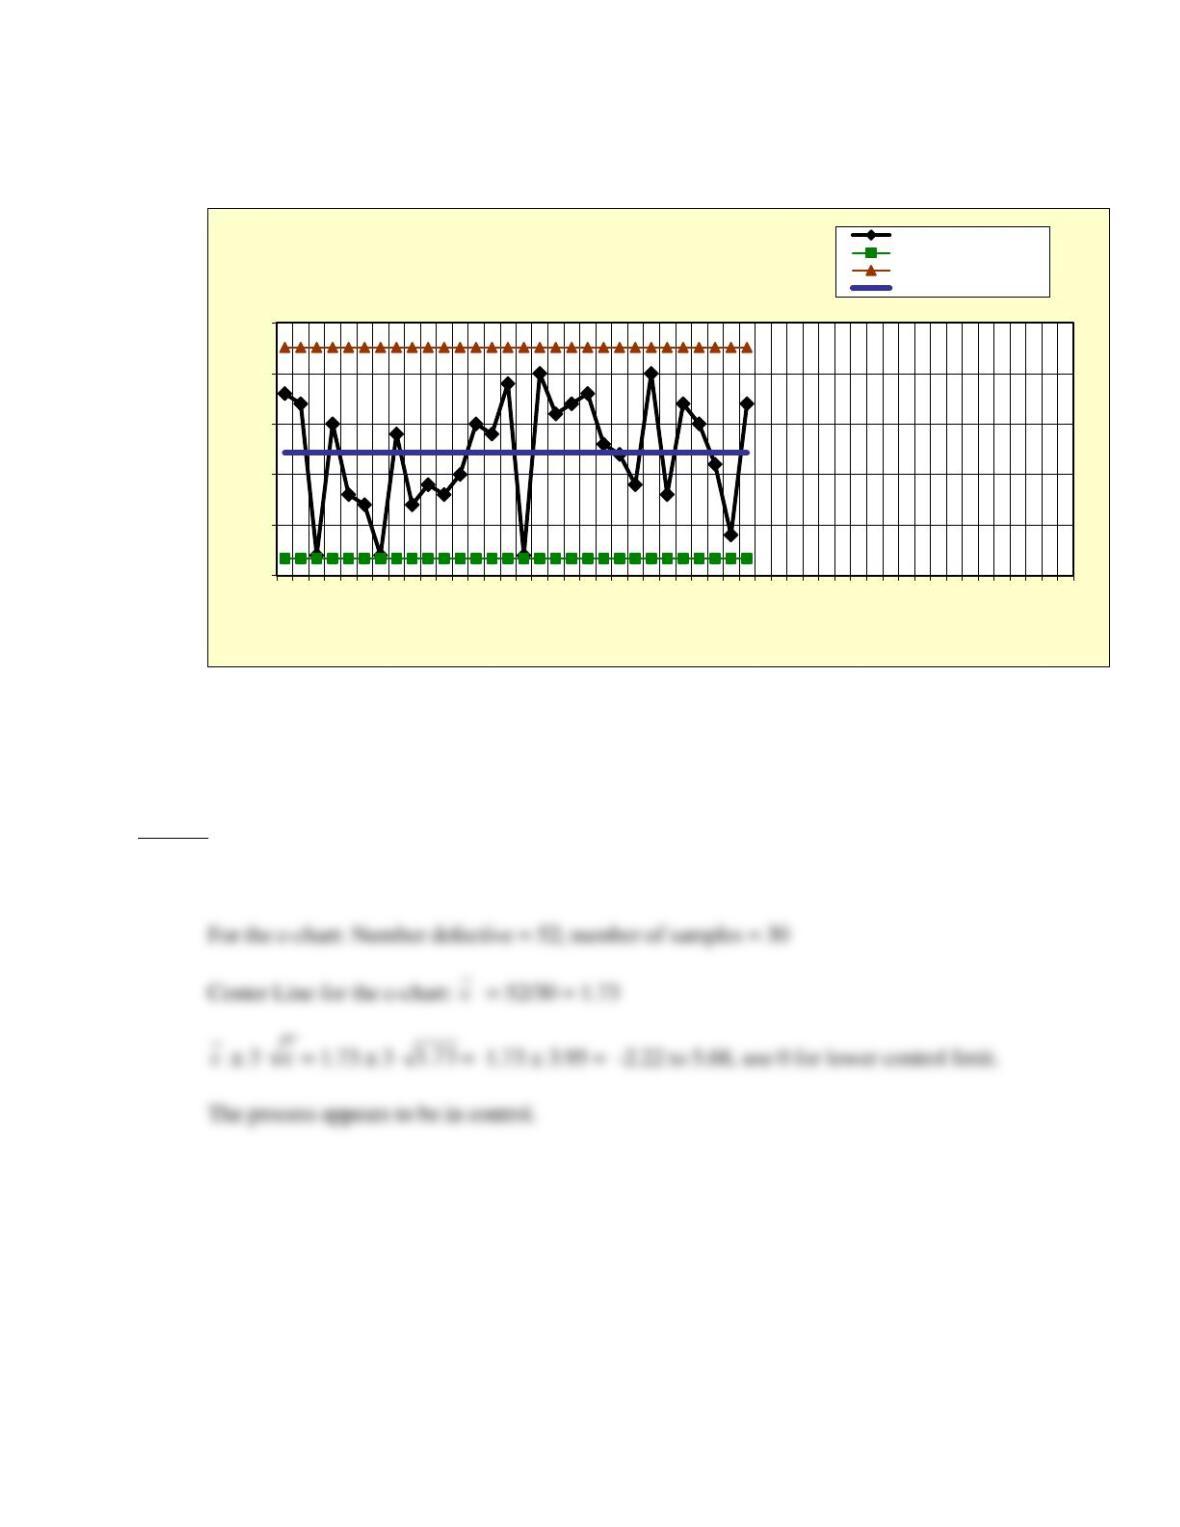
Problem 8–44– Revised
So, CL n
p
= n
p
= 100 (0.0174) = 1.74
Prob. 8-44
Number nonconforming (np) chart
Number nonconforming
Lower control limit
Upper control limit
Center line
Chapter 8 – Measuring and Controlling Quality 93
45. Construct an np-chart using the data in Prob. 8-45 in the C08Data.xlsx file on the Student
Companion Site for this chapter from Delgado Manufacturing Co. What does the chart
show?
Answer
45. See spreadsheet Prob08-45NP.xlsx in the Instructor materials for details. Note that values
obtained from a hand calculator are slightly different from those from an Excel spreadsheet,
due to rounding errors.
5
6
Sample number
Prob. 8-44 B
Number nonconforming (np) chart
Number nonconforming
Lower control limit
Upper control limit
Center line
Chapter 8 – Measuring and Controlling Quality 94
Values for 3 out of limits samples (actually sample 20 would have been out of limits after
re-calculation) had to be eliminated, leaving 27 usable data points. After eliminating the
unusable points, we get revised control limits shown for the final control chart, below.
Final Revised
So, CL n
p
= n
p
= 50 (0.1193) = 5.965
Problem 8–45: Final revised np control chart
14
16
18
1357911 13 15 17 19 21 23 25 27 29 31 33 35 37 39 41 43 45 47 49
Number nonconforming
Sample number
Prob. 8-45 A
Number nonconforming (np) chart
Number nonconforming
Lower control limit
Upper control limit
Center line
p
p
p
Chapter 8 – Measuring and Controlling Quality 95
46. Federal Scandex, Inc. uses a scanner on a conveyor line which scans 1,000 packages per
hour. Packages which have defective labels or detectable damage to the package are
automatically offloaded and hand-sorted by severity of defects, on a scale of 1-5. A minor
defect is a 1, such as a single number missing from a zip code. A 3 would be a moderate
defect, such as a missing addressee name or partially missing address. A 5 would be a
critical defect, such as a severely damaged package or missing address label. Construct a
c-chart for the 30 samples showing critical defects, from the data in the table in the
worksheet Prob. 8-48 in the C08Data.xlsx file, and interpret the results.
Answer
46. For the c-chart: Number defective = 364; number of samples = 30
0
2
4
6
8
10
12
14
1357911 13 15 17 19 21 23 25 27 29 31 33 35 37 39 41 43 45 47 49
Number nonconforming
Sample number
Prob. 8-45 B
Number nonconforming (np) chart
Number nonconforming
Lower control limit
Upper control limit
Center line
Chapter 8 – Measuring and Controlling Quality 96
47. FarmaSuitica, Inc., a mail-order prescription drug vendor, measured the number of
defects per standard 200 line order being picked in their distribution center. Construct a
c-chart for data in the table in the worksheet Prob. 8-47 in the C08Data.xlsx file and
interpret the results.
Answer
47. See spreadsheet Prob08–47CC.xlsx in the Instructor materials for details.
0
5
10
15
20
25
1 3 5 7 9 11 13 15 17 19 21 23 25 27 29 31 33 35 37 39 41 43 45 47 49
Number of nonconformances
Sample number
Prob. 8-46
Attribute (c) Chart
Number of defects
Lower control limit
Upper control limit
Center line
Chapter 8 – Measuring and Controlling Quality 97
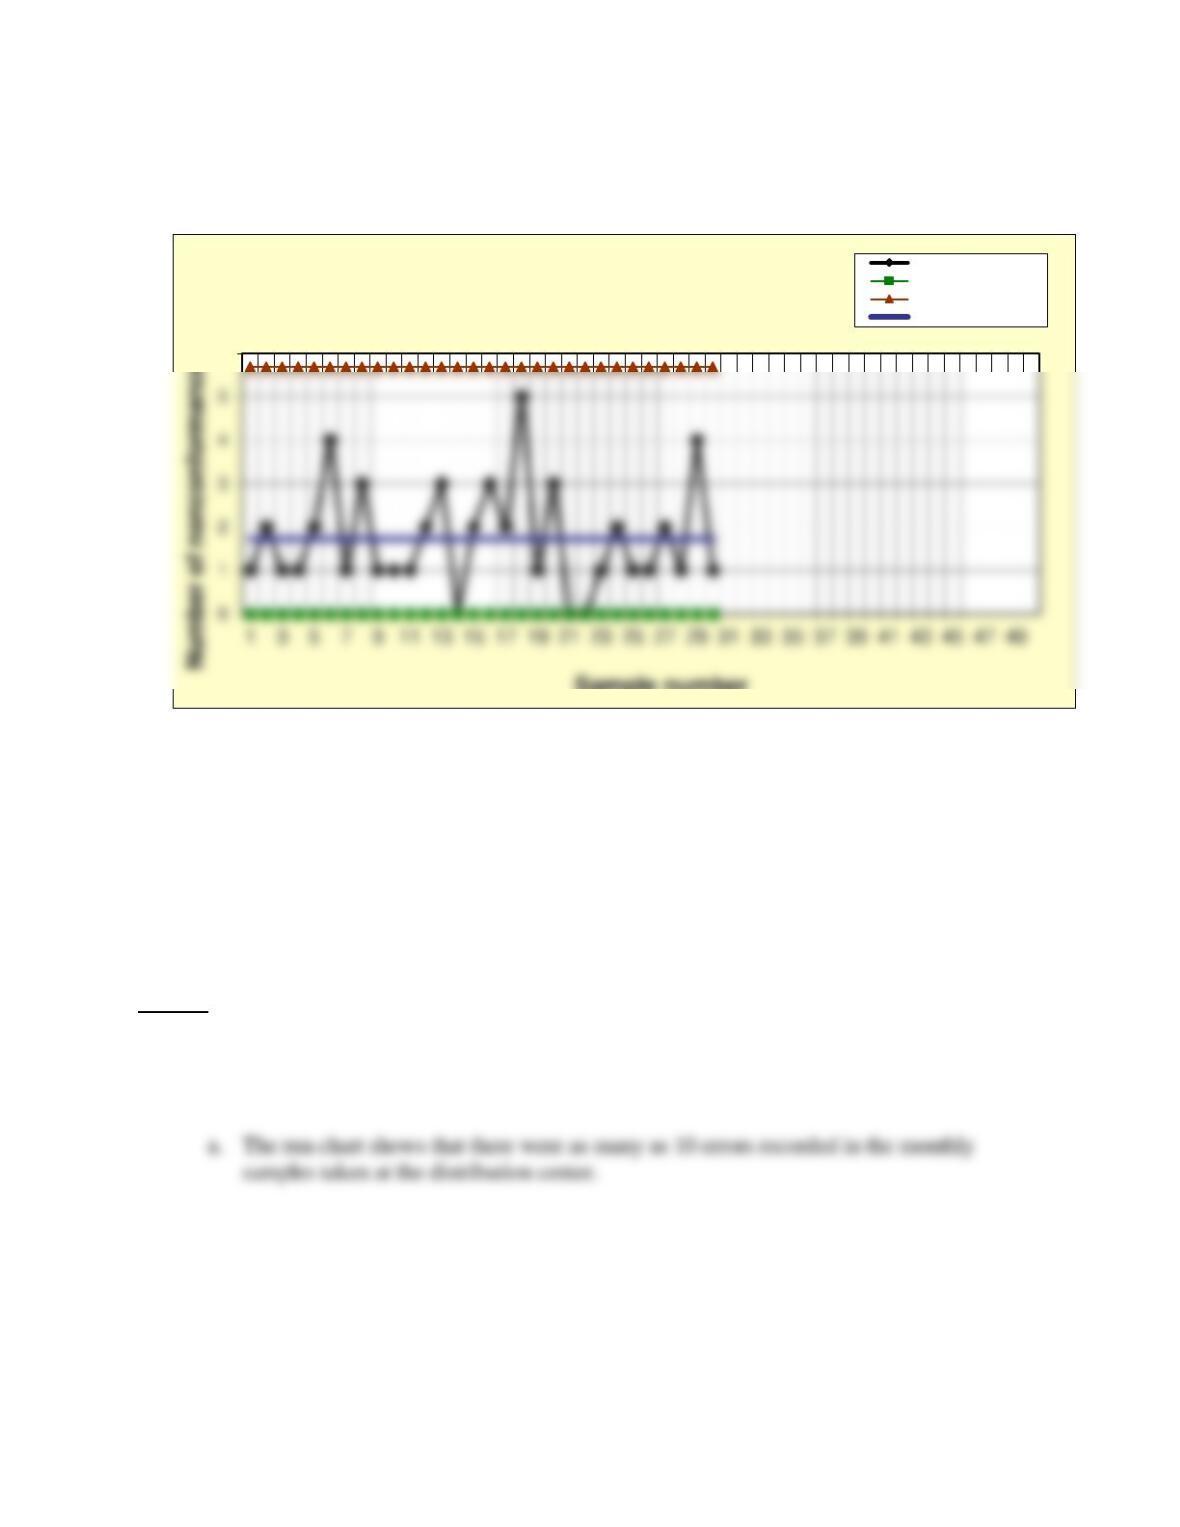
48. A quality consultant was asked to analyze the data from order errors at the Audubon
Books, Inc., distribution center as shown in the table in the worksheet Prob. 8-48 in the
C08Data.xlsx file on the Student Companion Site for this chapter. The data represent a
typical order processed in each month, and show the errors found in those orders. Any
order can have errors due to a number of causes, e.g. wrong item, incorrect customer
information, etc. Develop a run chart, a frequency histogram, and a u-chart for these
data. What insights do you get from each chart? What would you advise the distribution
center manager to do about the errors?
Answer
48. The run chart, frequency distribution, and u-chart all provide different insights into the
problem. See spreadsheet Prob08-48U.xlsx in the Instructor materials for details.
6
Sample number
Prob. 8-47
Attribute (c) Chart
Number of defects
Lower control limit
Upper control limit
Center line
Chapter 8 – Measuring and Controlling Quality 98
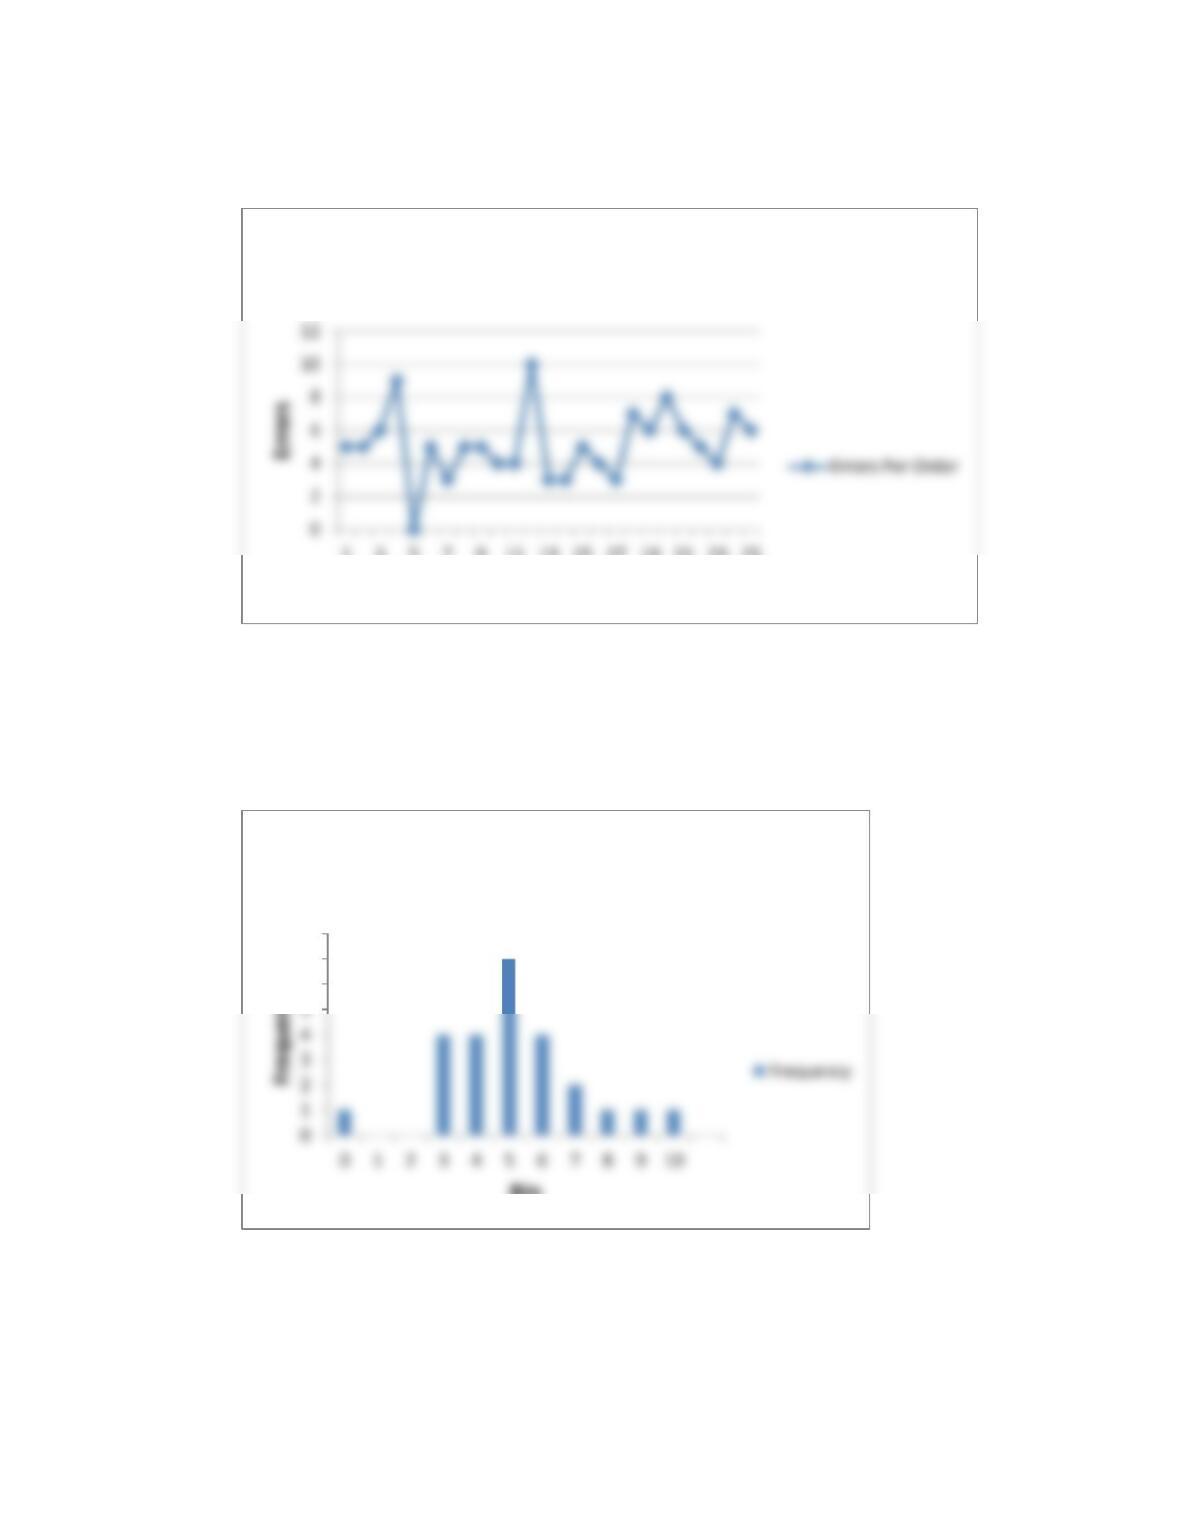
b. The frequency histogram shows that the most common number of errors was 5 per
monthly sample. Looking back at the run chart, one can see the months in which each
number of errors happened.
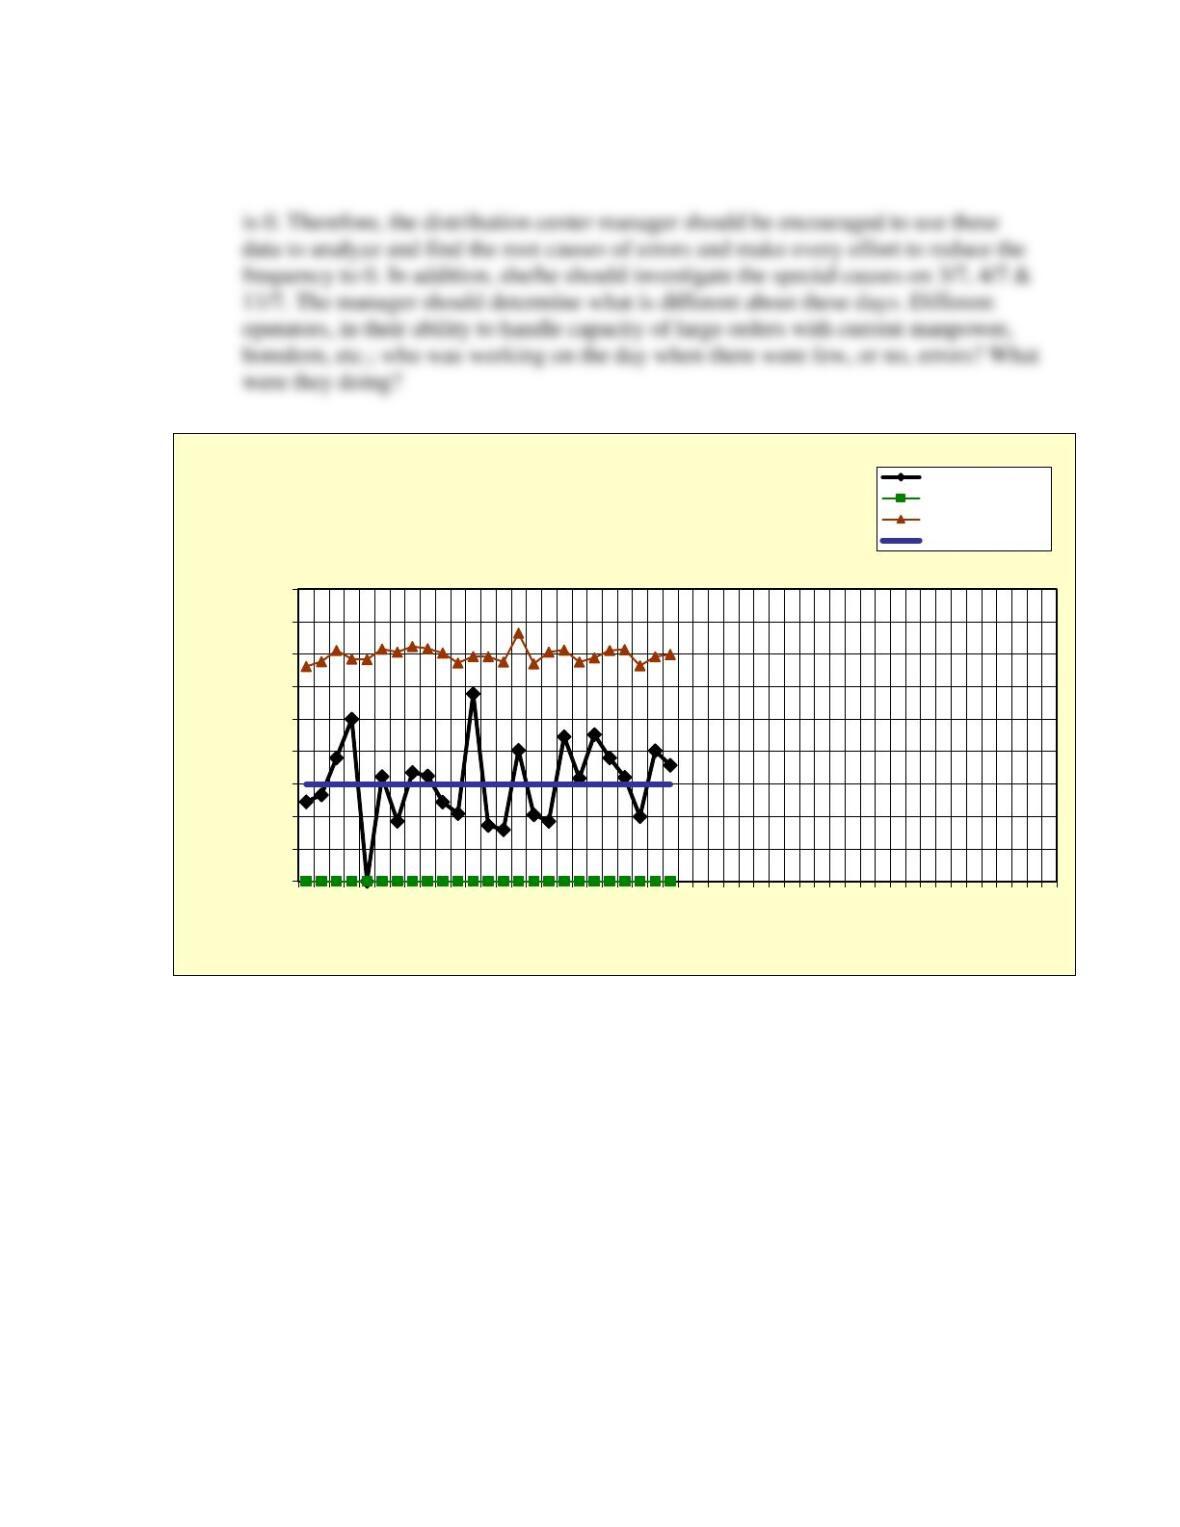
c. The u-chart shows what the rate of errors was, based on the orders processed, a
variable “sample size”. These data permit an analyst to develop a control chart, with
variable control limits. The chart shows that the process was under control, although
it doesn’t mean that errors were at an acceptable level! The acceptable level of errors
1 3 5 7 9 11 13 15 17 19 21 23 25
Samples
Prob. 8-48
Errors Per Order
6
7
8
Bin
Prob 8-48
Histogram of order errors
Chapter 8 – Measuring and Controlling Quality 99
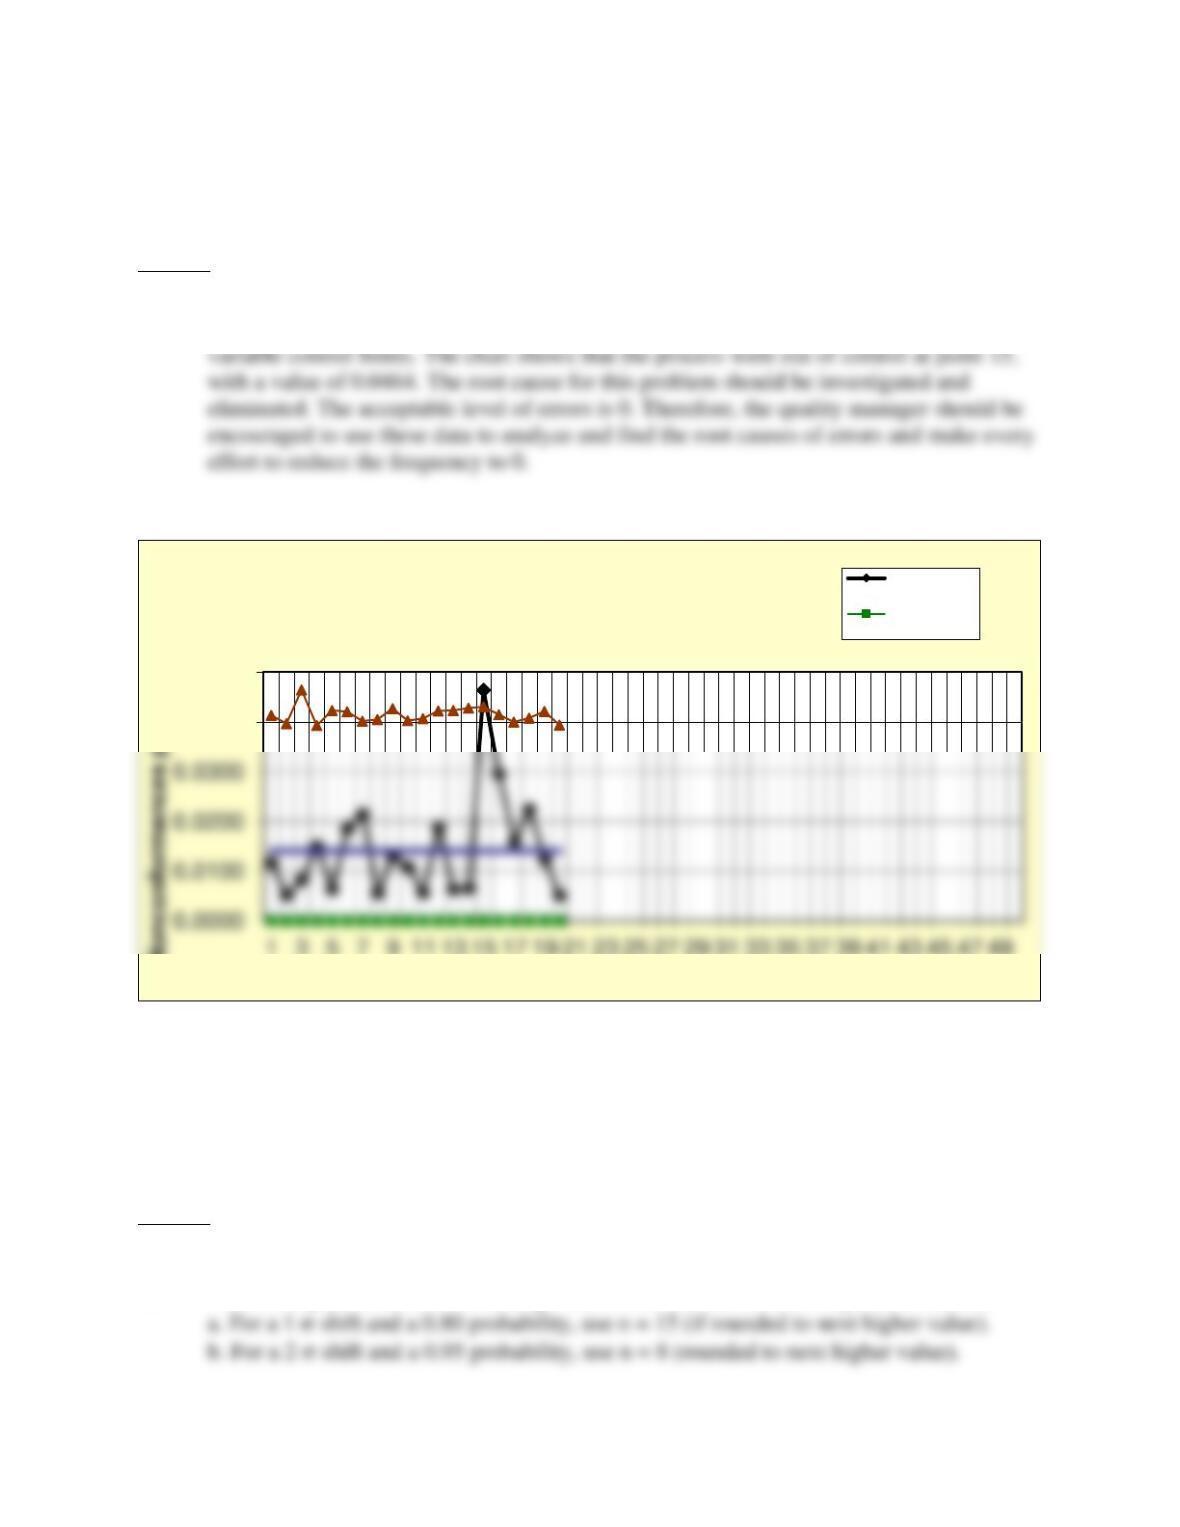
49. Top Billers processes bills for customers. Lately, they have been getting complaints of
errors in the bills they have processed. Bills can contain errors due to a number of causes,
such as incorrect amounts, wrong dates, wrong customer information, etc. The quality
manager for Top Billers decides to sample one customer’s batch of bills, per day, to
determine the number and proportion of errors. Use the u-chart to analyze the data found
in the table in the worksheet Prob. 8-49 in the C08Data.xlsx file.
0.000
0.010
0.020
0.030
0.040
0.050
0.060
0.070
0.080
0.090
1 3 5 7 9 11 13 15 17 19 21 23 25 27 29 31 33 35 37 39 41 43 45 47 49
Nonconformances per order
Sample number
Prob. 8-48
Attribute (u) Chart
Defects per unit
Lower control limit
Upper control limit
Center line
Chapter 8 – Measuring and Controlling Quality 100
Answer
The u-chart shows what the rate of errors was, based on the bills processed, with a
variable “sample size”. These data permit an analyst to develop a control chart, with
50. Determine, using Figure 8.50 the appropriate sample size for detecting:
a. A 1-sigma shift in the mean with a 0.80 probability.
b. A 2-sigma shift with 0.95 probability
c. A 2.5-sigma shift with 0.90 probability
Answer
50. This is simply an exercise in reading values from the curves to fit required conditions.
0.0400
0.0500
1 3 5 7 9 11 13 15 17 19 21 23 25 27 29 31 33 35 37 39 41 43 45 47 49
Nonconformances per unit
Sample number
Problem 8-49
Attribute (u) Chart
Defects per
unit
Lower control
limit