Prob. 8-18 Statistics
Problem 8-18
Mach4 Tool Co.
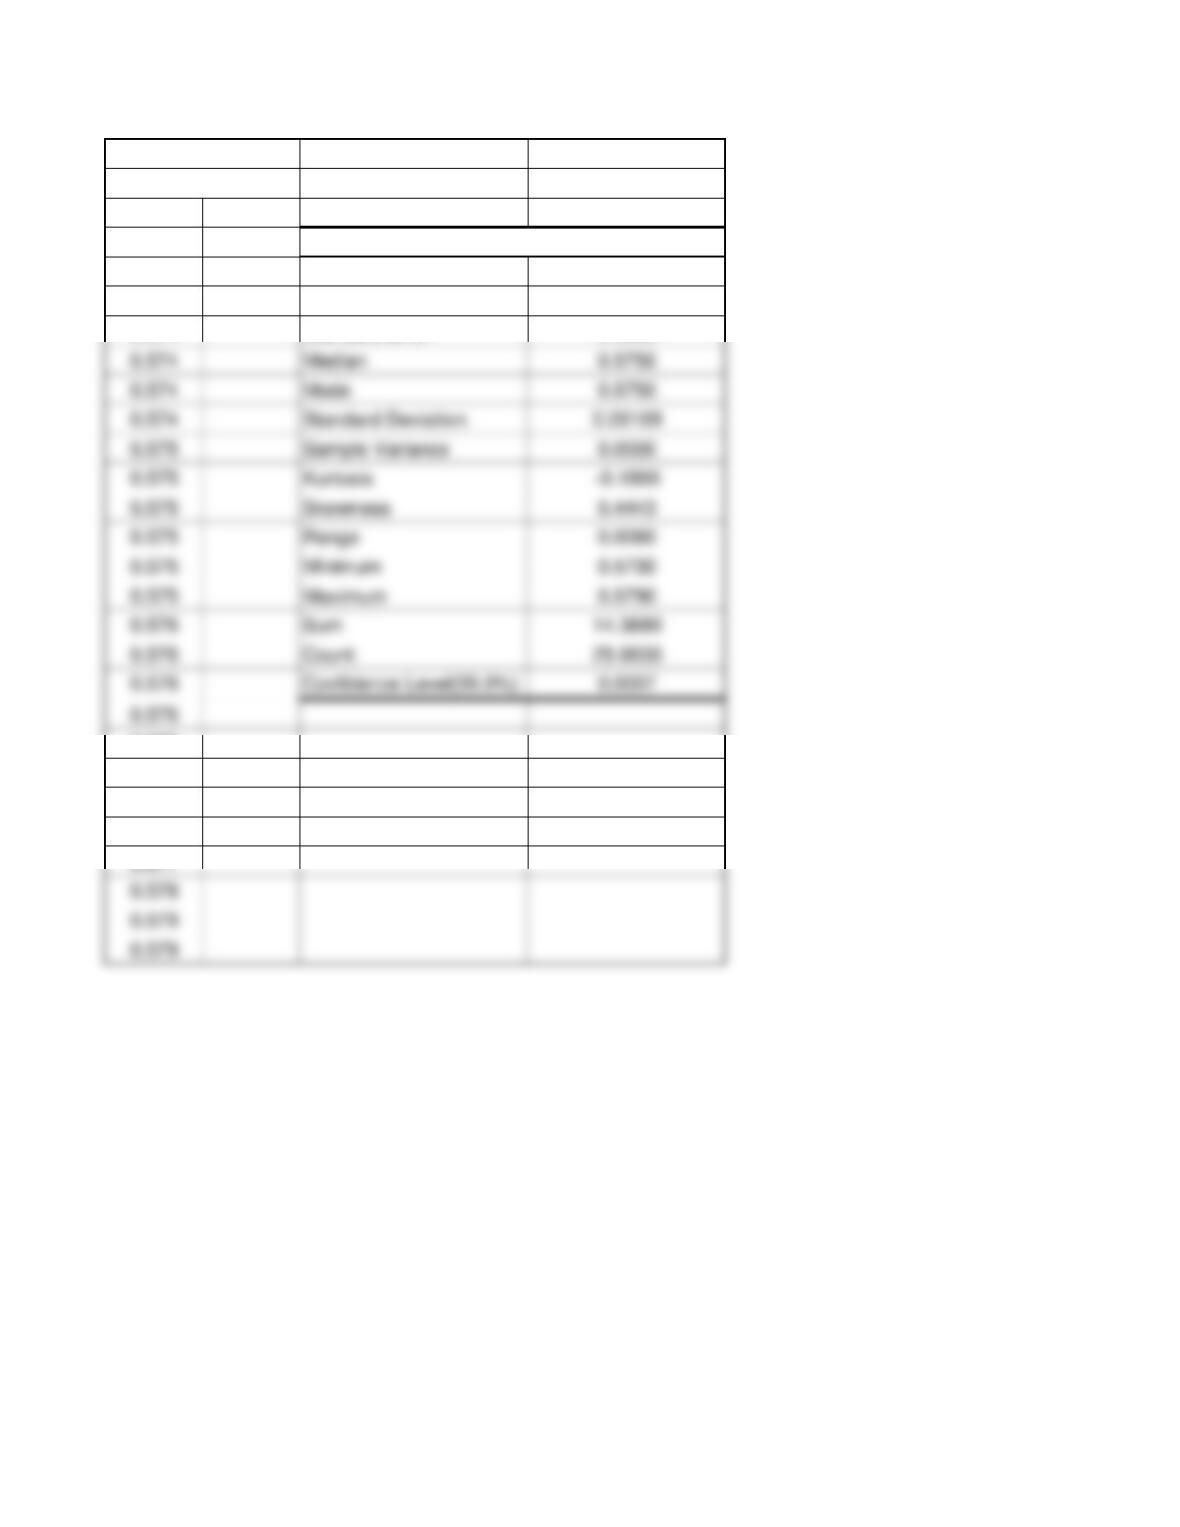
0.573 Column1
0.573
0.573 Mean 0.5755
0.574 Standard Error 0.0003
0.576
0.576
0.577
0.577
0.577
Page 1
Problem 8-18
Mach4 Tool Company
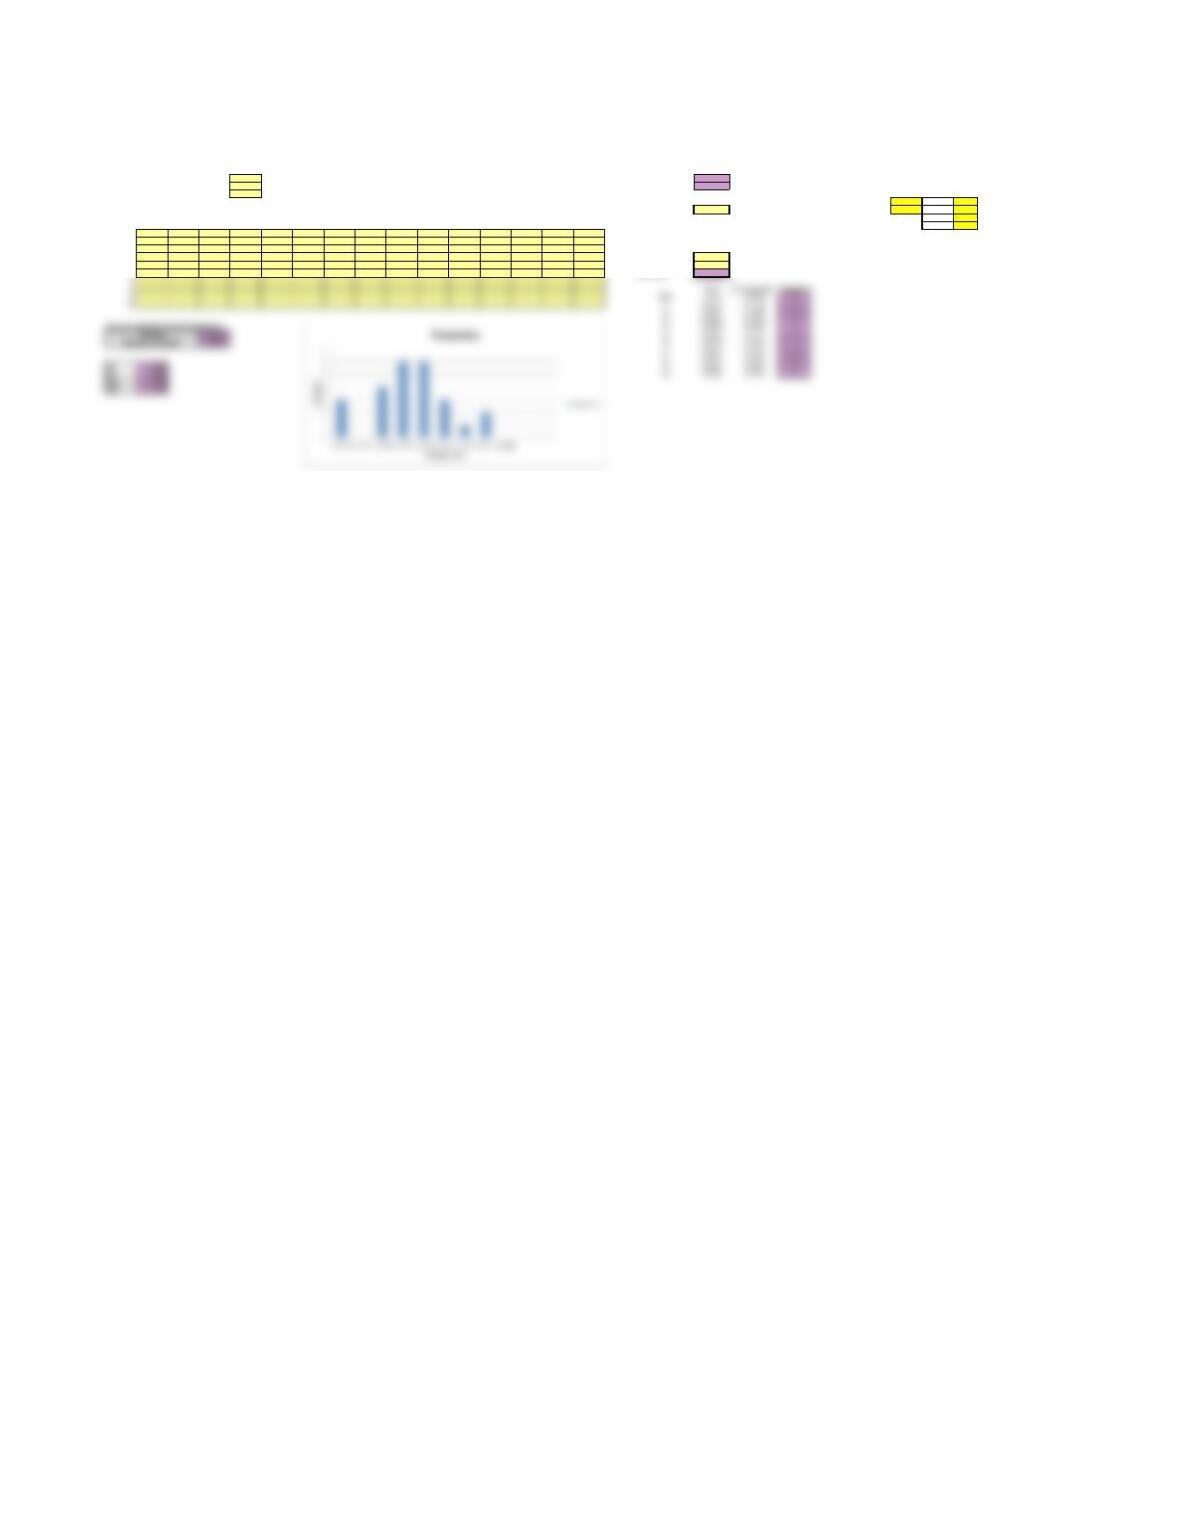
Frequency Distribution and Histogram
This spreadsheet is designed to handle up to 150 observations. Enter data ONLY in yellow-shaded cells.
Nominal specification 0.575 Data Minimum 0.5730
Upper specification limit 0.582 Data Maximum 0.5790
Lower specification limit 0.568
Enter number of cells below (10 or less) 0.5750 Cp 0.7644 Cp 1.383767
Number of Cells 80.0065 Cpl 1.5267 Cpl 1.486561
Cpu 0.0020 Cpu 1.280973
DATA 12345678910 11 12 13 14 15
Enter smallest and largest limits for the frequency distribution below. Cpk 0.0020 Cpk 1.280973
10.573 0.578 0.576 0.579 0.574
The lower limit should be slightly less than the data minimum.
20.575 0.575 0.573 0.577 0.576
The upper limit should be slightly larger than the data maximum.
30.573 0.574 0.576 0.575 0.579
40.576 0.577 0.577 0.574 0.575
Lower limit 0.5730
50.576 0.574 0.575 0.575 0.576
Upper limit 0.5800
6
Cell width 0.001