Problem 8-26
J. McWilliams Swim Club
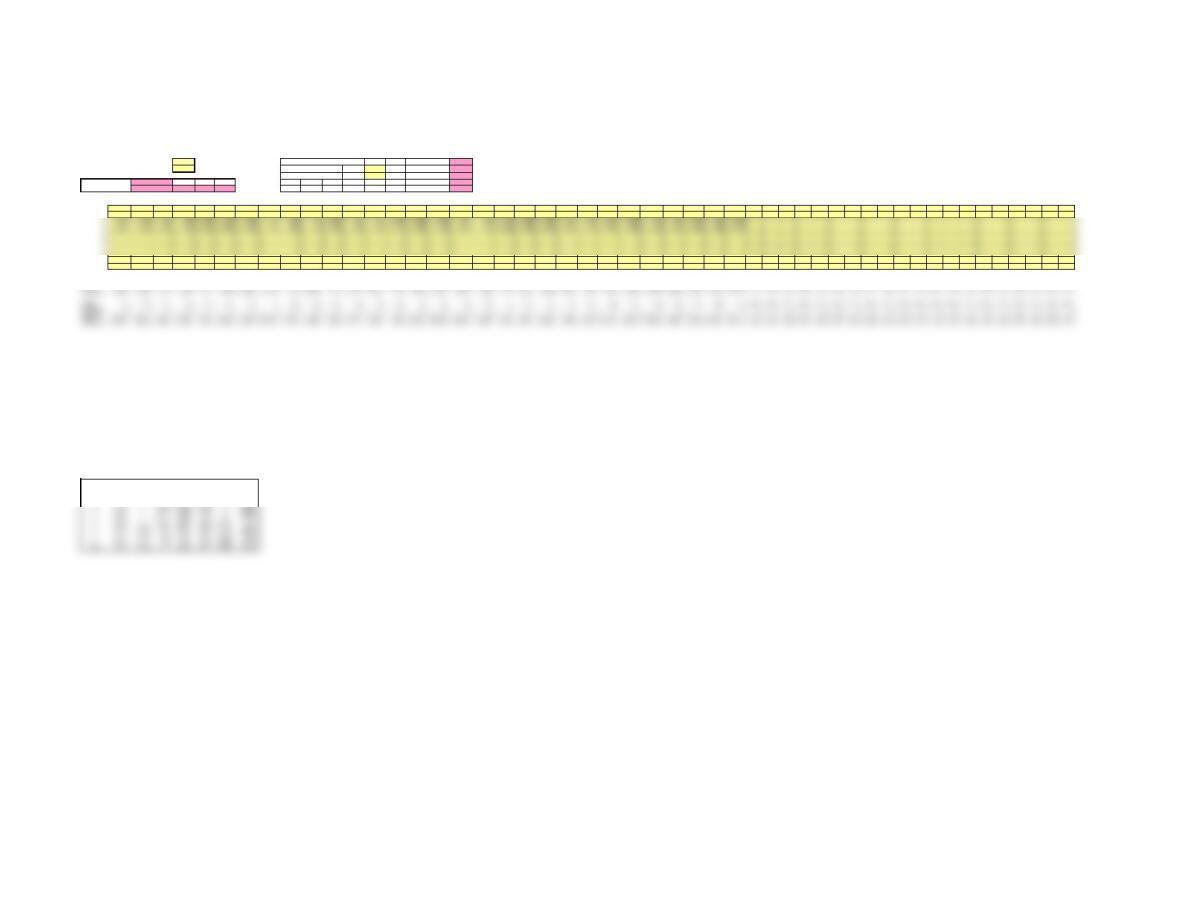
This spreadsheet is designed for up to 50 samples, each of a constant sample size from 2 to 10. Enter data ONLY in yellow-shaded cells.
Enter the number of samples in cell E6 and the sample size in cell E7. Then enter your data in the grid below.
Click on sheet tabs for a display of the control charts. Specification limits may be entered in cells N7 and N8 for process capability.
Number of samples (<= 50) 30 Process Capability Calculations Six sigma 0.33946
4Upper specification
Lower specification
Grand Average A2 D3 D4
Average Range 0.729 02.282
DATA 1 2 3 4 5 6 7 8 9 10 11 12 13 14 15 16 17 18 19 20 21 22 23 24 25 26 27 28 29 30 31 32 33 34 35 36 37 38 39 40 41 42 43 44 45 46 47 48 49 50
11.220 1.360 1.220 1.260 1.290 1.310 1.240 1.280 1.280 1.140 1.200 1.250 1.260 1.240 1.360 1.250 1.300 1.290 1.200 1.260 1.170 1.280 1.190 1.230 1.220 1.240 1.320 1.250 1.170 1.140
8
9
10
Average
1.275 1.34 1.27 1.235 1.2525 1.265 1.23 1.255 1.2425 1.165 1.205 1.215 1.2575 1.215 1.265 1.21 1.285 1.3 1.2025 1.27 1.23 1.25 1.2175 1.23 1.235 1.2125 1.2375 1.2225 1.23 1.2175 #N/A #N/A #N/A #N/A #N/A #N/A #N/A #N/A #N/A #N/A #N/A #N/A #N/A #N/A #N/A #N/A #N/A #N/A #N/A #N/A
LCLx-bar
1.171509 1.17151 1.1715 1.17151 1.1715 1.17151 1.171509 1.171509 1.1715 1.17151 1.1715 1.171509 1.17151 1.1715 1.17151 1.171509 1.171509 1.17151 1.1715 1.17151 1.17151 1.17151 1.1715 1.17151 1.17151 1.171509 1.17151 1.17151 1.17151 1.17151 1.172 1.172 1.172 1.172 1.172 1.172 1.172 1.172 1.172 1.172 1.172 1.172 1.172 1.172 1.172 1.172 1.172 1.172 1.172 1.172
Center
1.24125 1.24125 1.2413 1.24125 1.2413 1.24125 1.24125 1.24125 1.2413 1.24125 1.2413 1.24125 1.24125 1.2413 1.24125 1.24125 1.24125 1.24125 1.2413 1.24125 1.24125 1.24125 1.2413 1.24125 1.24125 1.24125 1.24125 1.24125 1.24125 1.24125 1.241 1.241 1.241 1.241 1.241 1.241 1.241 1.241 1.241 1.241 1.241 1.241 1.241 1.241 1.241 1.241 1.241 1.241 1.241 1.241
1.310991 1.31099 1.311 1.31099 1.311 1.31099 1.310991 1.310991 1.311 1.31099 1.311 1.310991 1.31099 1.311 1.31099 1.310991 1.310991 1.31099 1.311 1.31099 1.31099 1.31099 1.311 1.31099 1.31099 1.310991 1.31099 1.31099 1.31099 1.31099 1.311 1.311 1.311 1.311 1.311 1.311 1.311 1.311 1.311 1.311 1.311 1.311 1.311 1.311 1.311 1.311 1.311 1.311 1.311 1.311
0.095667 0.09567 0.0957 0.09567 0.0957 0.09567 0.095667 0.095667 0.0957 0.09567 0.0957 0.095667 0.09567 0.0957 0.09567 0.095667 0.095667 0.09567 0.0957 0.09567 0.09567 0.09567 0.0957 0.09567 0.09567 0.095667 0.09567 0.09567 0.09567 0.09567 0.096 0.096 0.096 0.096 0.096 0.096 0.096 0.096 0.096 0.096 0.096 0.096 0.096 0.096 0.096 0.096 0.096 0.096 0.096 0.096
0.218311 0.21831 0.2183 0.21831 0.2183 0.21831 0.218311 0.218311 0.2183 0.21831 0.2183 0.218311 0.21831 0.2183 0.21831 0.218311 0.218311 0.21831 0.2183 0.21831 0.21831 0.21831 0.2183 0.21831 0.21831 0.218311 0.21831 0.21831 0.21831 0.21831 0.218 0.218 0.218 0.218 0.218 0.218 0.218 0.218 0.218 0.218 0.218 0.218 0.218 0.218 0.218 0.218 0.218 0.218 0.218 0.218
DO NOT MODIFY THIS TABLE
nA2 D3 D4 d2 A3 B3 B4
21.88 03.267 1.128 2.659 03.267
31.023 02.574 1.693 1.954 02.568
40.729 02.282 2.059 1.628 02.266
50.577 02.114 2.326 1.427 02.089
60.483 02.004 2.534 1.287 0.03 1.97
70.419 0.076 1.924 2.704 1.182 0.118 1.882
80.373 0.136 1.864 2.847 1.099 0.185 1.815
90.337 0.184 1.816 2.97 1.032 0.239 1.761
Control Chart Factors
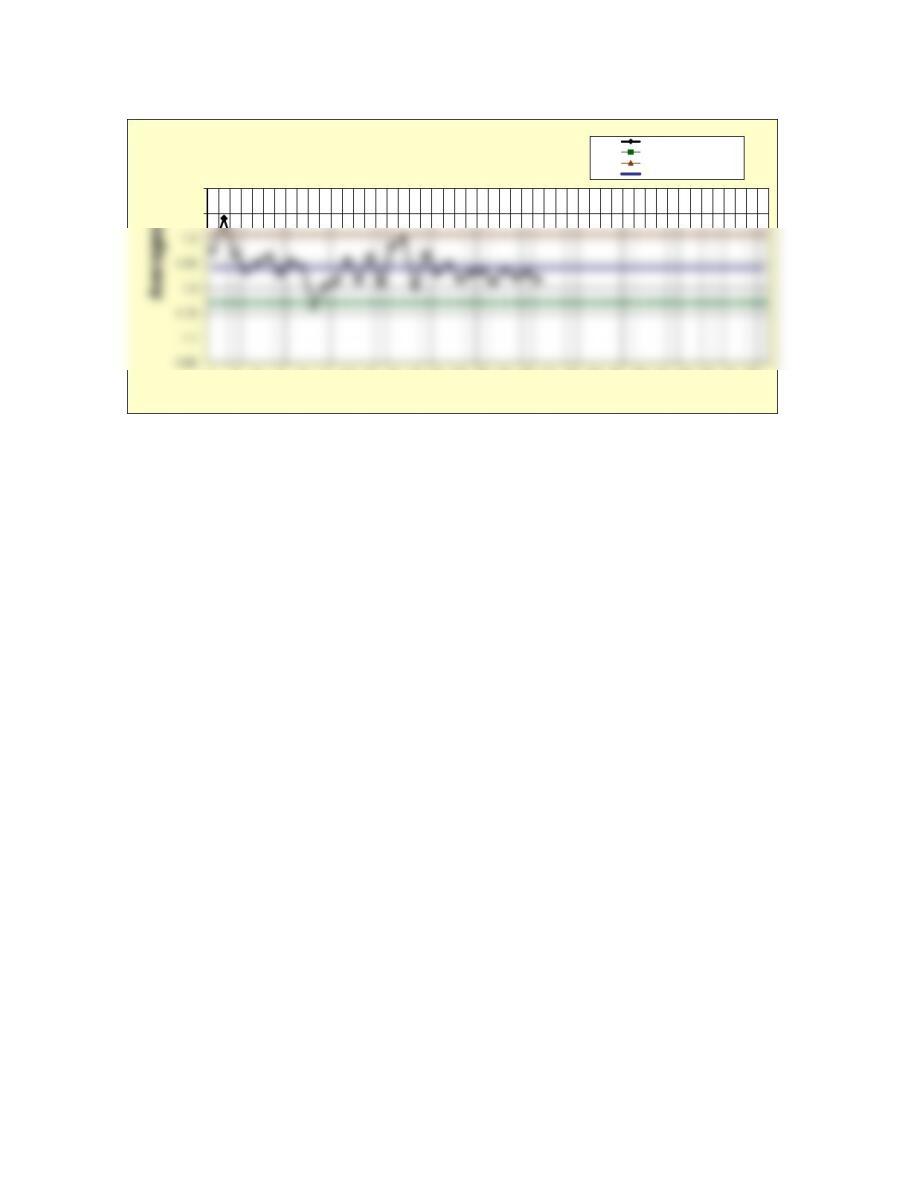
X-bar and R-Chart
Sample size (2 – 10)
1.241
0.096
Cp
Cpu
Cpl
Cpk
21.320 1.320 1.250 1.250 1.230 1.250 1.260 1.260 1.220 1.190 1.210 1.170 1.250 1.190 1.180 1.150 1.320 1.340 1.240 1.280 1.300 1.250 1.160 1.240 1.230 1.250 1.190 1.210 1.170 1.140
31.210 1.310 1.330 1.220 1.340 1.240 1.240 1.190 1.270 1.180 1.200 1.200 1.300 1.220 1.360 1.290 1.290 1.200 1.140 1.250 1.150 1.210 1.250 1.230 1.260 1.160 1.250 1.210 1.290 1.350
41.350 1.370 1.280 1.210 1.150 1.260 1.180 1.290 1.200 1.150 1.210 1.240 1.220 1.210 1.160 1.150 1.230 1.370 1.230 1.290 1.300 1.260 1.270 1.220 1.230 1.200 1.190 1.220 1.290 1.240
5
6
7
1.35
1.4
1357911 13 15 17 19 21 23 25 27 29 31 33 35 37 39 41 43 45 47 49
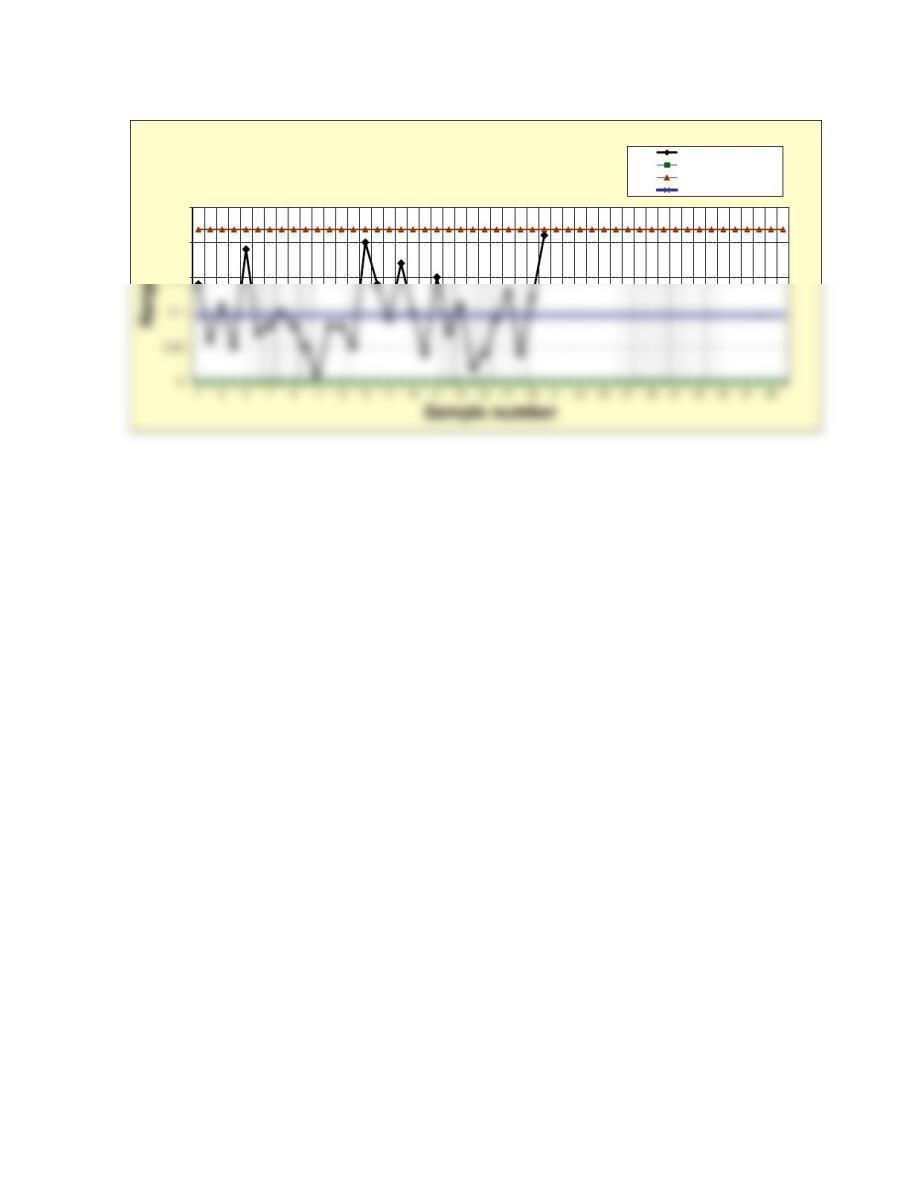
Sample number
Prob. 8-26 X-bar Chart Averages
Lower control limit
Upper control limit
Center line
0.15
0.2
0.25
Prob. 08-26 R-Chart Ranges
Lower control limit
Upper control limit
Center line
Problem 8-26
J. McWilliams Swim Club
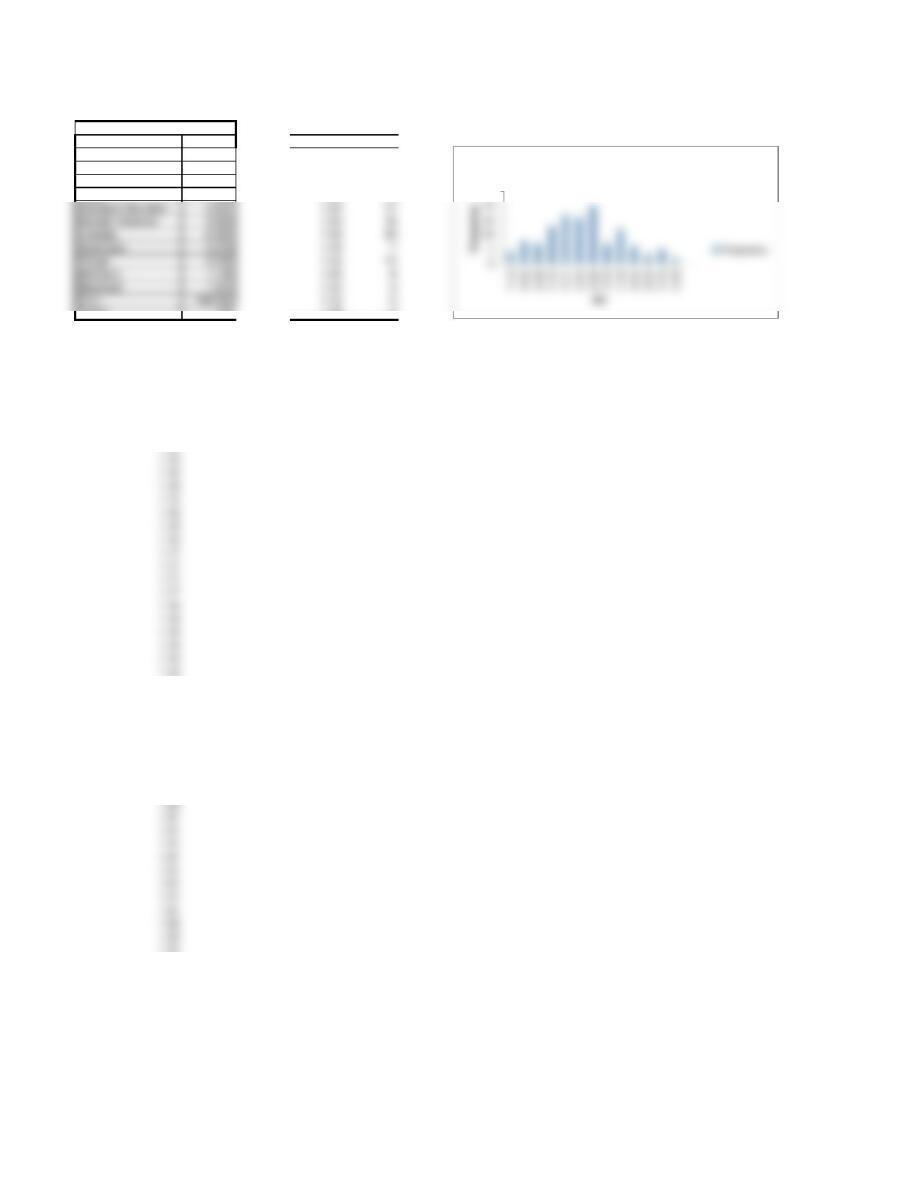
Descriptive Statistics
Bin Frequency
Mean 1.241 1.14 4
Standard Error 0.005 1.16 8
Median 1.240 1.18 7
Mode 1.250 1.20 13
Count 120 1.38 2
DATA
1.14
1.14
1.14
1.14
1.15
1.19
1.19
1.19
1.20
1.20
1.20
1.20
1.20
1.20
1.22
1.22
1.22
1.22
1.22
1.22
1.22
1.23
1.23
1.23
1.23
25
Histogram
1.23
1.23
1.23
1.25
1.25
1.25
1.25
1.25
1.25
1.26
1.26
1.26
1.26
1.26
1.26
1.26
1.26
1.27
1.27
1.28
1.28
1.28
1.28
1.28
1.29
1.29
1.29
1.33
1.34
1.34
1.35
1.35
1.36
1.36
1.36
1.37
1.37