Excel Templates to accompany Operations Management, Eleventh Edition
created by Lee Tangedahl
Copyright © 2012 by The McGraw Hill Companies, Inc. All rights reserved.
Chapter Eight – Location Planning and Analysis
Templates: Locational Cost-Profit-Volume Analysis
Center of Gravity Method (B)
Solved Problems: Solved Problem 1
Solved Problem 4
Lecture Suggestions
Example 3
Example 4
See Instructions template for complete instructions.
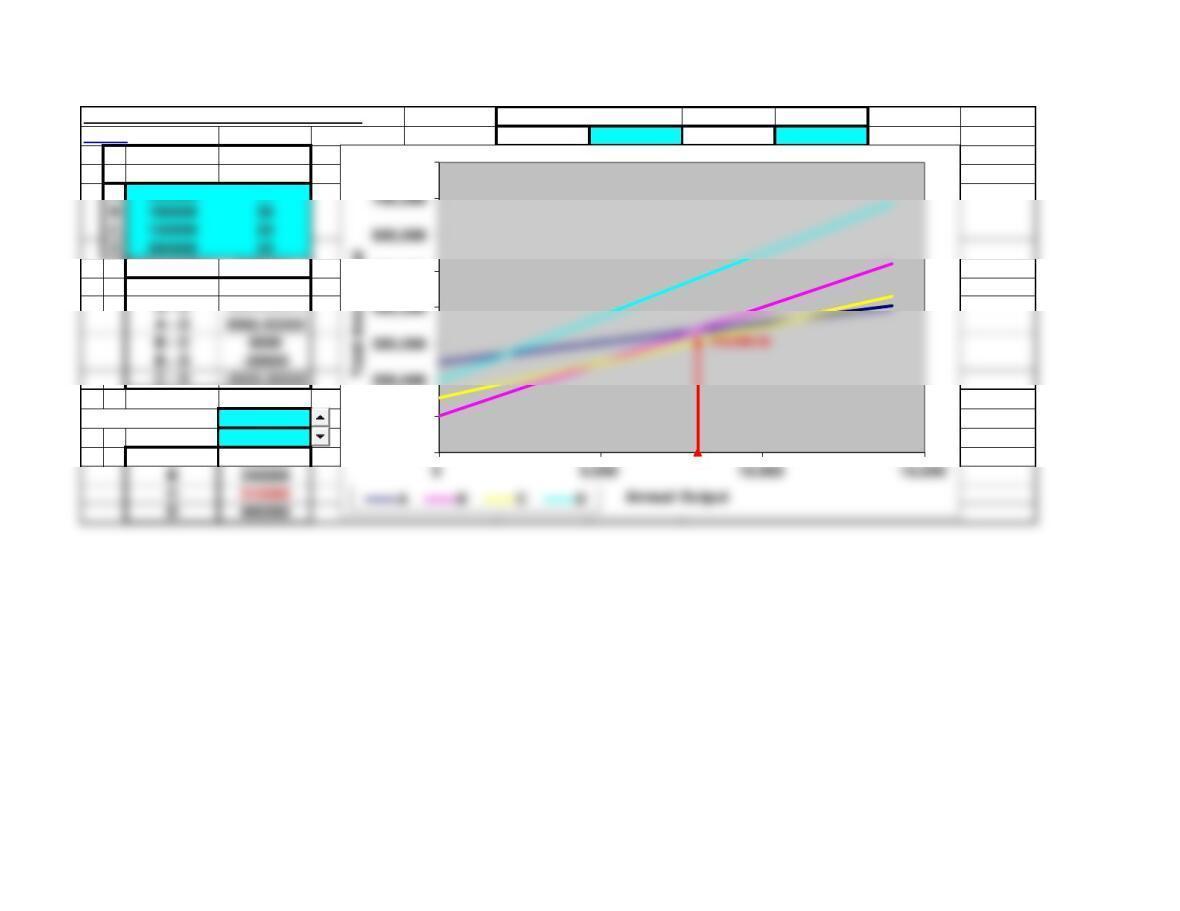
Locational Analysis
Locational Cost-Profit-Volume Analysis Chart Settings:
<Back Start: 0 Step: 1,000
Fixed Variable Volume A B C D
Cost Cost 0250,000 100,000 150,000 200,000
A250000 11 1,000 261,000 130,000 170,000 235,000
Intersection Volume 5,000 305,000 250,000 250,000 375,000
A – B 7894.73684 6,000 316,000 280,000 270,000 410,000
A – C 11111.1111 7,000 327,000 310,000 290,000 445,000
A – D 2083.33333 8,000 338,000 340,000 310,000 480,000
B – C 5000 9,000 349,000 370,000 330,000 515,000 8000 0
B – D -20000 10,000 360,000 400,000 350,000 550,000 8000 310000
12,000 382,000 460,000 390,000 620,000
Annual Output = 8000 13,000 393,000 490,000 410,000 655,000
1000 14,000 404,000 520,000 430,000 690,000
A338000
0
100,000
500,000
800,000
Page 2
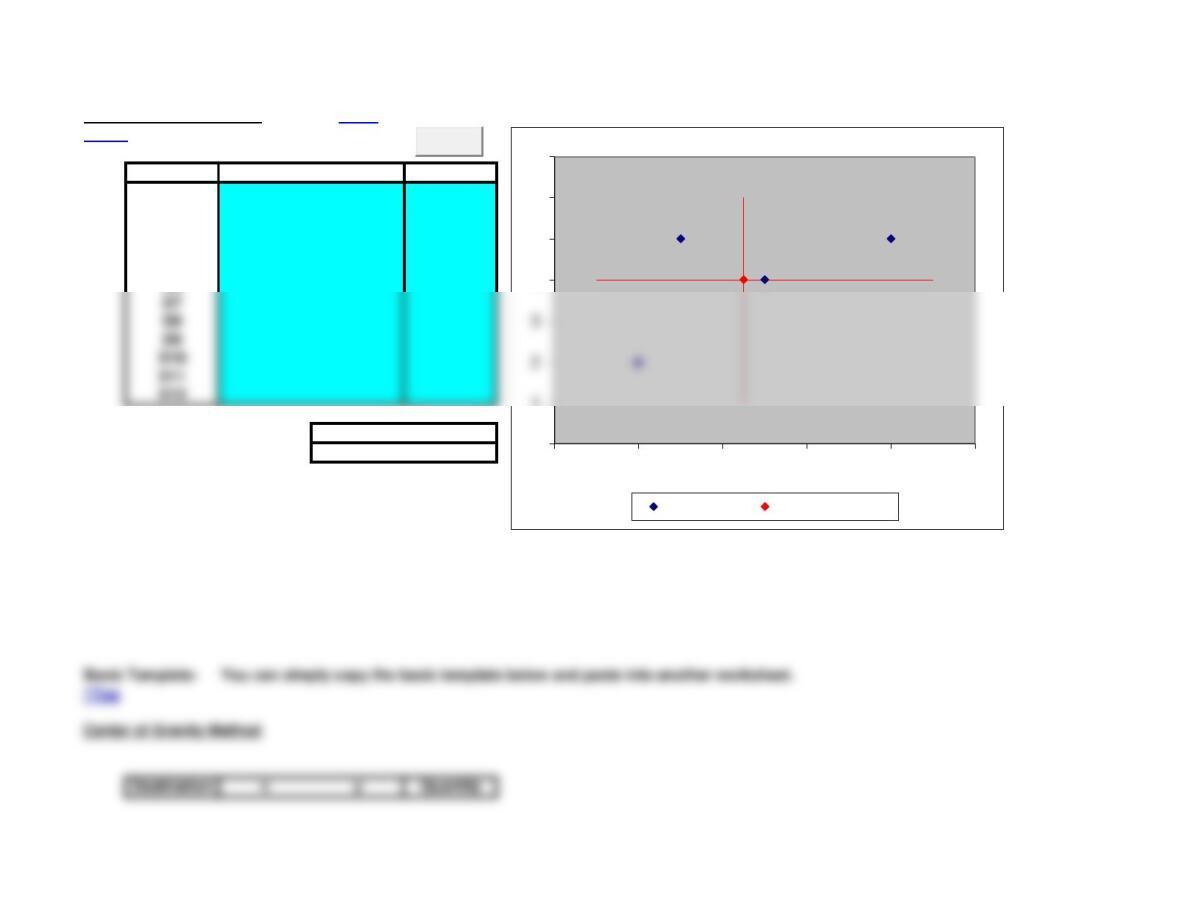
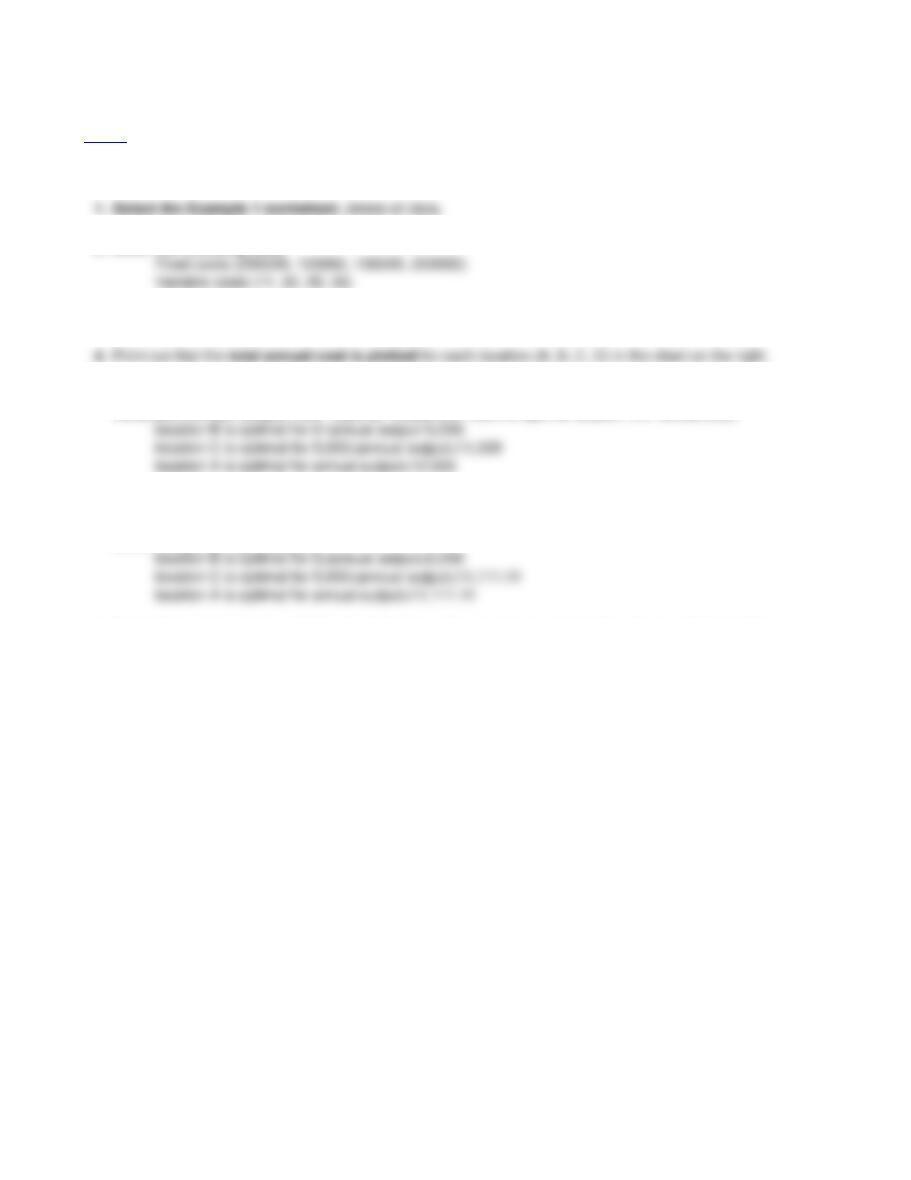
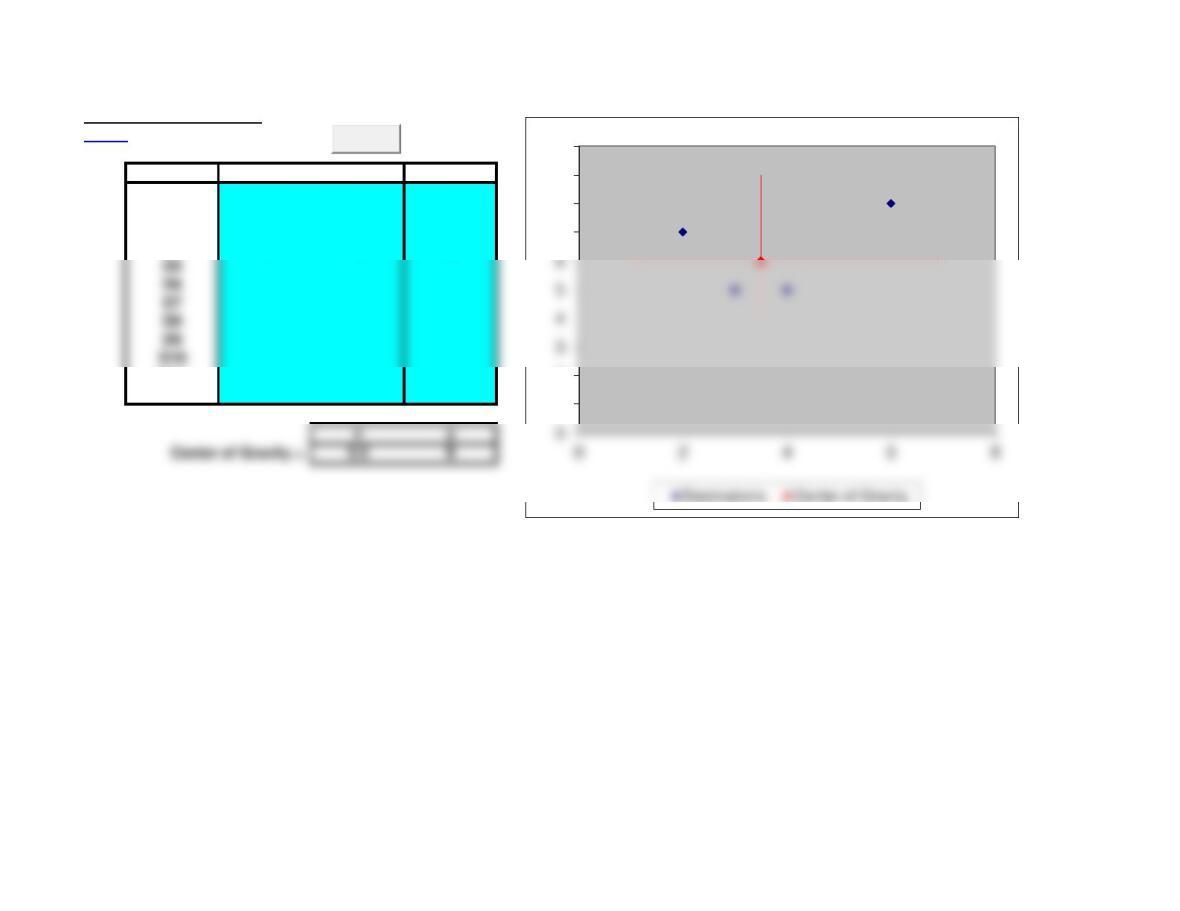
Center of Gravity Method Basic
<Back
Destination x y Quantity
D1 2 2 1
D2 3 5 1
D3 5 4 1
D4 8 5 1
D5 0
D6 0
x y
Center of Gravity = 4.5 4
Basic Template: You can simply copy the basic template below and paste into another worksheet.
^Top
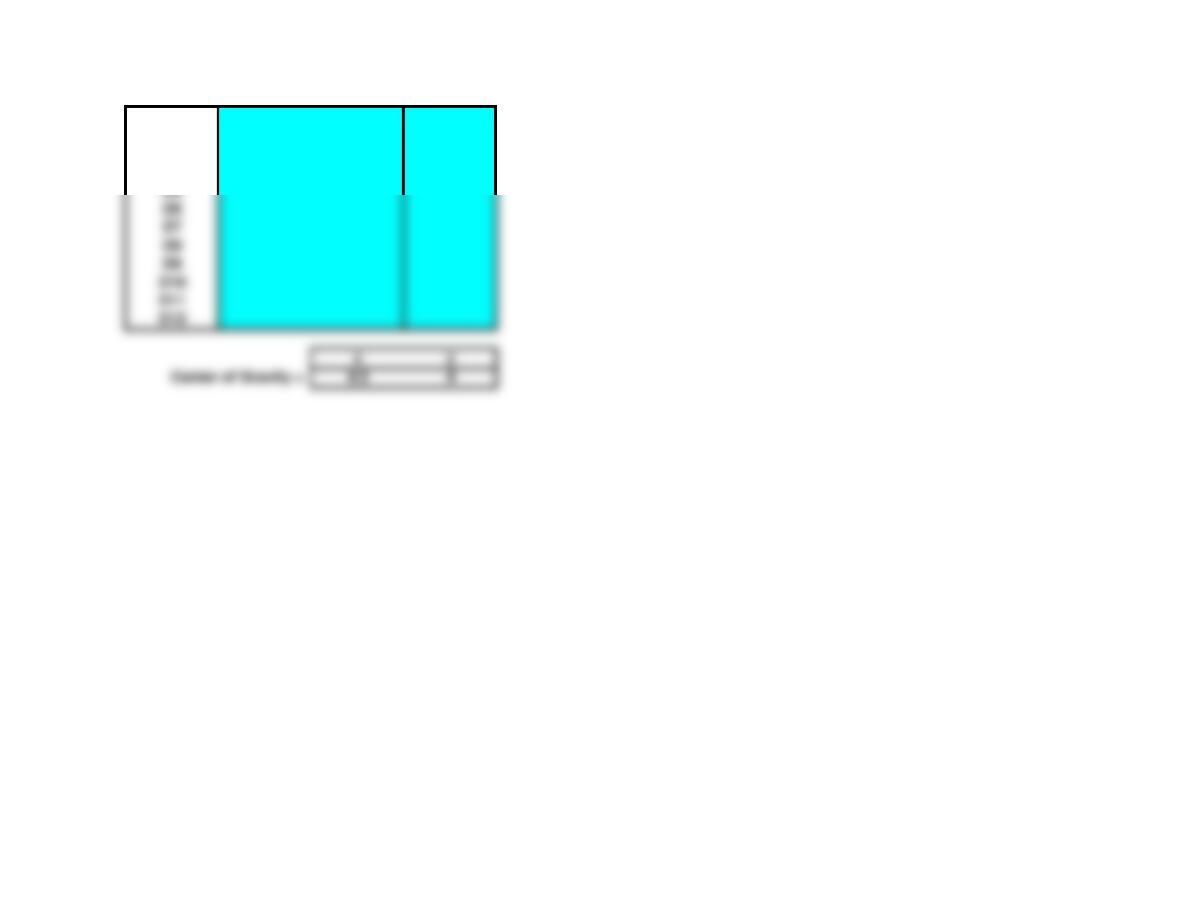
Center of Gravity Method
Destination x y Quantity
0
1
4
5
6
7
0 2 4 6 8 10
Destinations Center of Gravity
Clear
D7 0
D8 0
D9 01 4
D1 2 2 1
D2 3 5 1
D3 5 4 1
D4 8 5 1
D5
D6
D7
D8
D9
Lecture Suggestions – Chapter 8
<Back
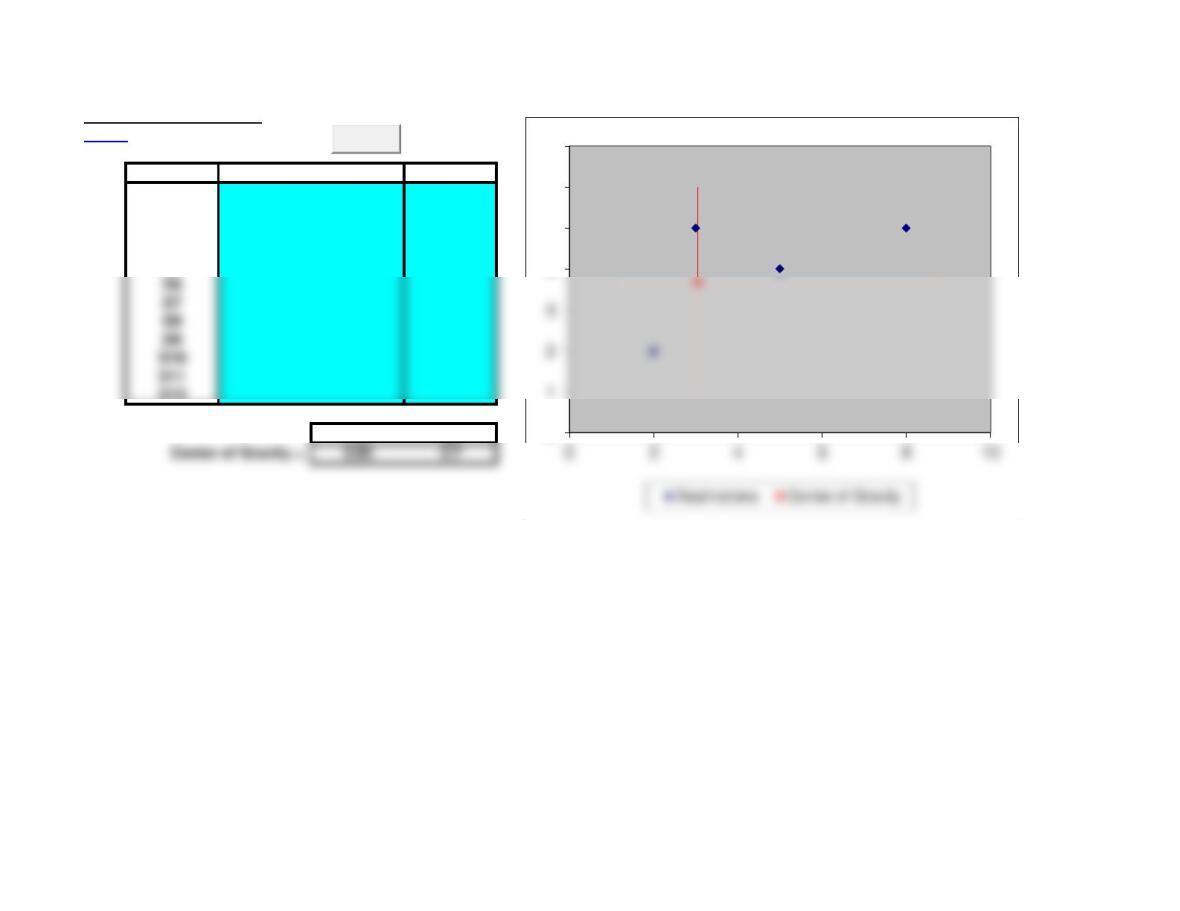
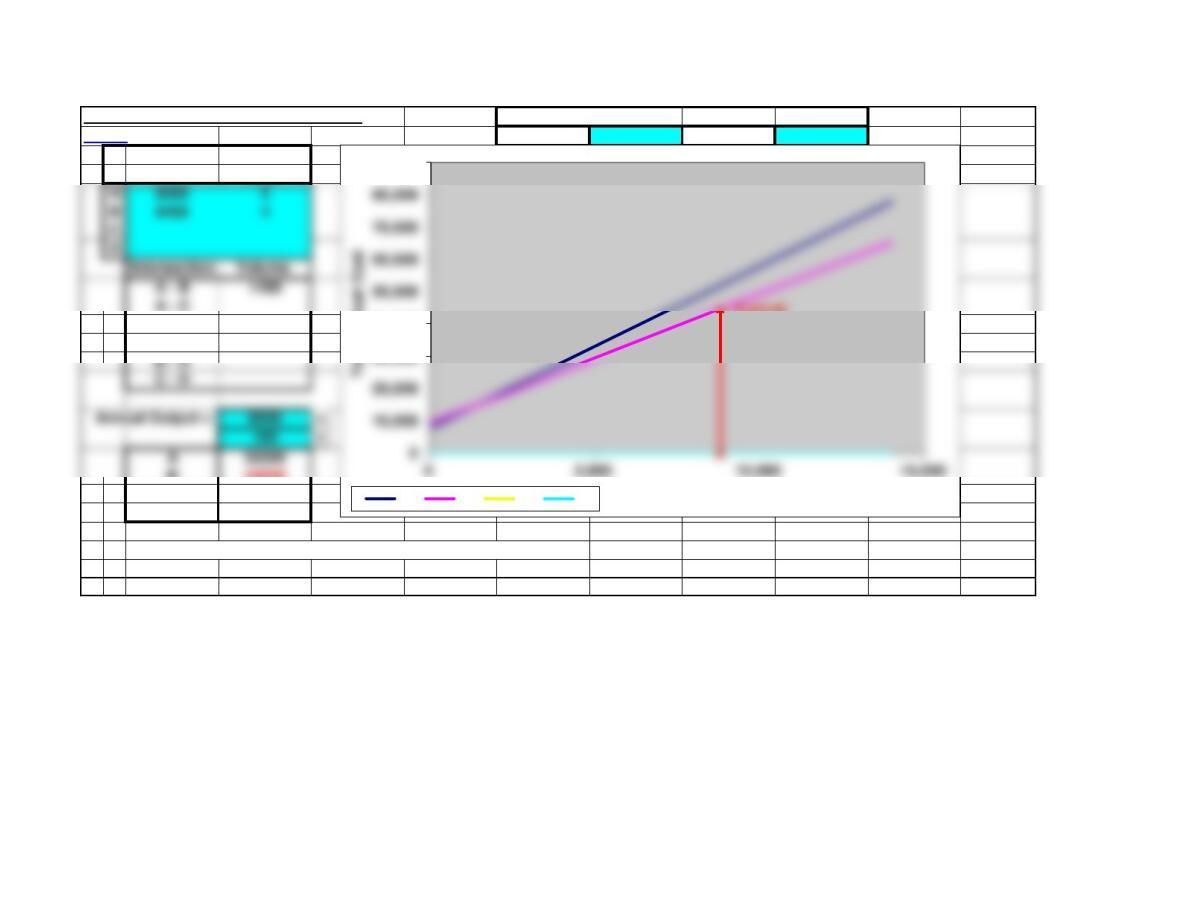
Example 3: Locational Cost-Profit-Volume Analysis
2. Enter the following data:
3. Adjust graph, if necessary, by changing start value and step value for the x-axis.
4. Point out that the total annual cost is plotted for each location (A, B, C, D) in the chart on the right.
5. Enter Annual output (volume) = 1000 and increment = 1000 (cell D18), then use the spinner button to
increment annual output from 1,000 to 12,000 and note the optimal location (i.e. lowest cost):
6. The template also computes the exact intersections of the total annual cost lines, e.g. lines B and C
intersect at annual output = 500 and lines A and C intersect at annual output = 1111.11. Therefore the
actual ranges of optimality are:
7. For part c, enter Volume = 8000 and note that location C has the lowest total annual cost = 310,000.
1. Select the Example 1 worksheet, delete all data.

Example 1
Locational Cost-Profit-Volume Analysis Chart Settings:
<Back Start: 0 Step: 1,000
Fixed Variable Volume A B C D
Cost Cost 0250,000 100,000 150,000 200,000
A250000 11 1,000 261,000 130,000 170,000 235,000
Intersection Volume 5,000 305,000 250,000 250,000 375,000
A – B 7894.73684 6,000 316,000 280,000 270,000 410,000
A – C 11111.1111 7,000 327,000 310,000 290,000 445,000
A – D 2083.33333 8,000 338,000 340,000 310,000 480,000
B – C 5000 9,000 349,000 370,000 330,000 515,000 8000 0
B – D -20000 10,000 360,000 400,000 350,000 550,000 8000 310000
12,000 382,000 460,000 390,000 620,000
Annual Output = 8000 13,000 393,000 490,000 410,000 655,000
1000 14,000 404,000 520,000 430,000 690,000
A338000
0
100,000
400,000
500,000
800,000
Page 6
Center of Gravity Method
<Back
Destination x y Quantity
D1 2 2 1
D2 3 5 1
D3 5 4 1
D8 0
D9 01 4
D10 09 4
D11 04.5 1
D12 04.5 6
x y
0
1
2
3
5
6
7
Clear
D4 8 5 1
D5 0
D6 0
D7 0
Center of Gravity Method
<Back
Destination x y Quantity
D1 2 2 800 800
D2 3 5 900 900
D3 5 4 200 200
D4 8 5 100 100
D5 0
x y
0
4
5
6
7
Clear
D6 0
D7 0
D8 0
D9 013.7
Solved Problem 1
Locational Cost-Profit-Volume Analysis Chart Settings:
<Back Start: 0 Step: 200
Fixed Variable Volume A B C D
Cost Cost 023,000 25,500 23,000 0
A23000 4200 23,800 26,500 24,200 0
B25500 5400 24,600 27,500 25,400 0
Intersection Volume 1,000 27,000 30,500 29,000 0
A – B -2500 1,200 27,800 31,500 30,200 0
A – C 0 1,400 28,600 32,500 31,400 0
A – D 1,600 29,400 33,500 32,600 0
B – C 2500 1,800 30,200 34,500 33,800 0800 0
B – D 2,000 31,000 35,500 35,000 0800 26200
2,400 32,600 37,500 37,400 0
Annual Output = 800 2,600 33,400 38,500 38,600 0
100 2,800 34,200 39,500 39,800 0
A26200
26,200.00
0
5,000
10,000
25,000
30,000
40,000
45,000
0 500 1,000 1,500 2,000 2,500 3,000
Page 9
C23000 6600 25,400 28,500 26,600 0
Solved Problem 2
Locational Cost-Profit-Volume Analysis Chart Settings:
<Back Start: 0 Step: 1,000
Fixed Variable Volume A B C D
Cost Cost 08,000 9,400 0 0
A – D 8,000 48,000 41,400 0 0
B – C 9,000 53,000 45,400 0 0 8800 0
B – D 10,000 58,000 49,400 0 0 8800 44600
B44600
C
D
Note: The costs above must be subtacted from the revenue.
A B
800 8200
44,600.00
30,000
40,000
90,000
Annual Output
A B C D
Page 10
A – B 1400 6,000 38,000 33,400 0 0
A – C 7,000 43,000 37,400 0 0
Center of Gravity Method
<Back
Destination x y Quantity
D1 3 5 20 20
D2 6 8 10 10
D3 2 7 15 15
D4 4 5 15 15
D11 03.5 4
D12 03.5 9
1
2
7
8
9
10
Clear
D10 07 6
Chapter 8 – Problems 1-6 Note: This worksheet displays results only, you must copy the shaded
<Back area into the corresponding template to make additional calculations.
1. Locational Cost-Profit-Volume Analysis
Fixed Variable
Cost Cost
Fixed Variable
Cost Cost
A1400000 47
3. Locational Cost-Profit-Volume Analysis
Fixed Variable
Cost Cost
A800000 14000
A1200000 36
C – D
Annual Output = 120
100
A2480000
4. Locational Cost-Profit-Volume Analysis
Fixed Variable
Cost Cost
A250000 500
Intersection
Volume
A – B 125
A – C 400
A – D
B – C 33.33333
B – D
C – D
Annual Output = 150
100
A325000
5. Locational Cost-Profit-Volume Analysis
Fixed Variable
Cost Cost
A254000 500
Intersection
Volume
A – B 114.5
A – C 268
A – D
B – C 63.33333
B – D
Annual Output = 150
100
A329000
B400000
C270000
D
6. Locational Cost-Profit-Volume Analysis
Fixed Variable
Cost Cost
A90000 8
B120000 4
C125000 5
Intersection
Volume
A – B 7500
A – C 11666.67
A – D
B – D
C120000 1000
Annual Output = 10000
100
A170000
B160000
C175000
Chapter 8 – Problems 7-14 Note: This worksheet displays results only, you must copy the shaded
<Back area into the corresponding template to make additional calculations.
7. Locational Cost-Profit-Volume Analysis
Fixed Variable
Cost Cost
A7000 30
B4700 40
C
D
Intersection
Volume
A – B 230
A – C
Annual Output = 200
100
A13000
D
Annual Output = 300
100
A16000
D
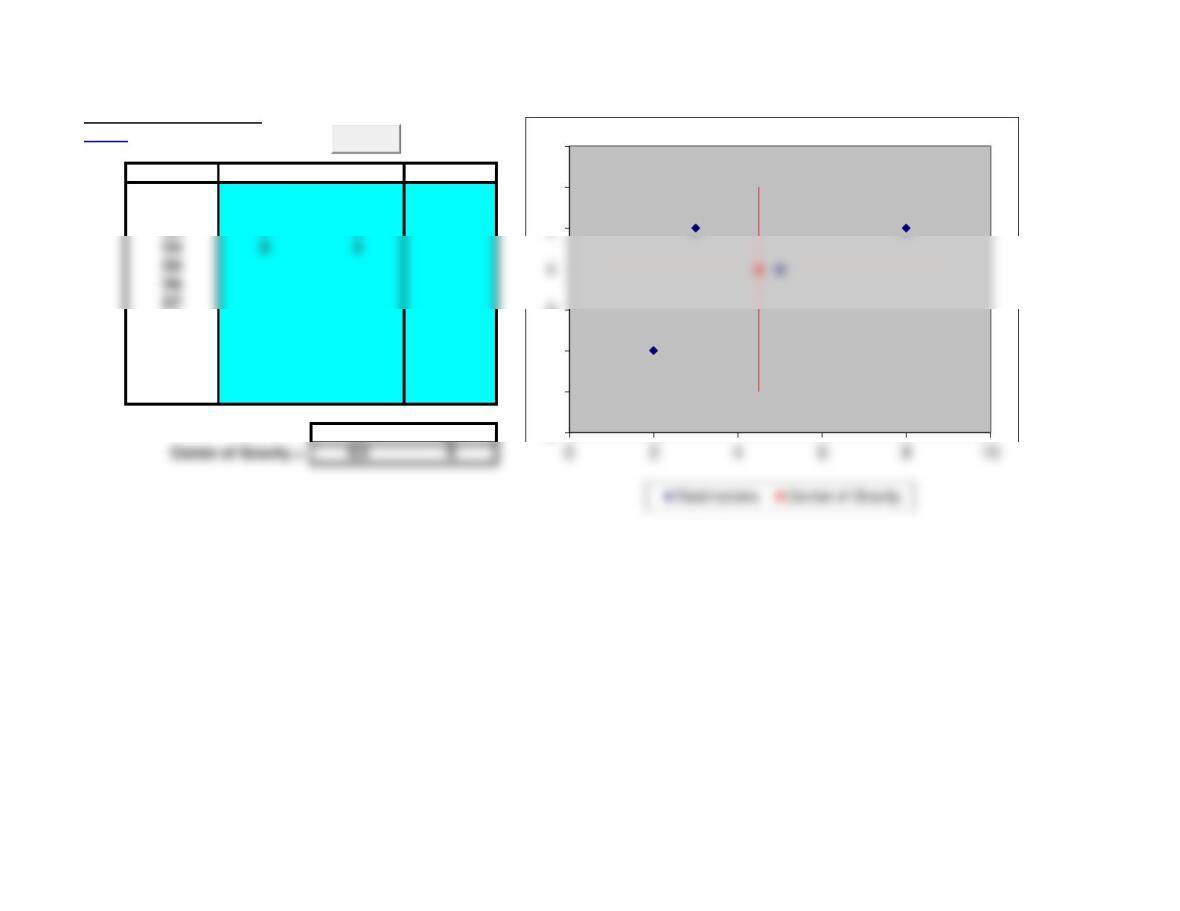
12. Center of Gravity Method
A – D
B – C
B – D
Destination
x y Quantity
D1 3 7
D2 8 2
D3 4 6
D4 4 1
D5 6 4
D6
x y
Center of Gravity = 5 4
13. Center of Gravity Method
Destination
x y Quantity
D1 5 7 15
D2 6 9 20
D3 3 9 25
D4 9 4 30
D5
D6
D7
D8
D9
x y
D7
D8
D9
Center of Gravity = 6 7
14. Center of Gravity Method
Destination
x y Quantity
D1 10 526
D2 4 1 9
D3 4 7 25
D4 2 6 30
D5 8 7 40
D6
x y
Center of Gravity = 5.969231 5.953846
15. Center of Gravity Method
Destination
x y Quantity
D1 1 2 900
D2 2 4 300
D3 3 1 700
D4 4 2 600
D5 5 3 800
D6
D7
D8
D9
D7
D8
D9
D10
D11
D12
x y
Center of Gravity = 3.030303 2.212121