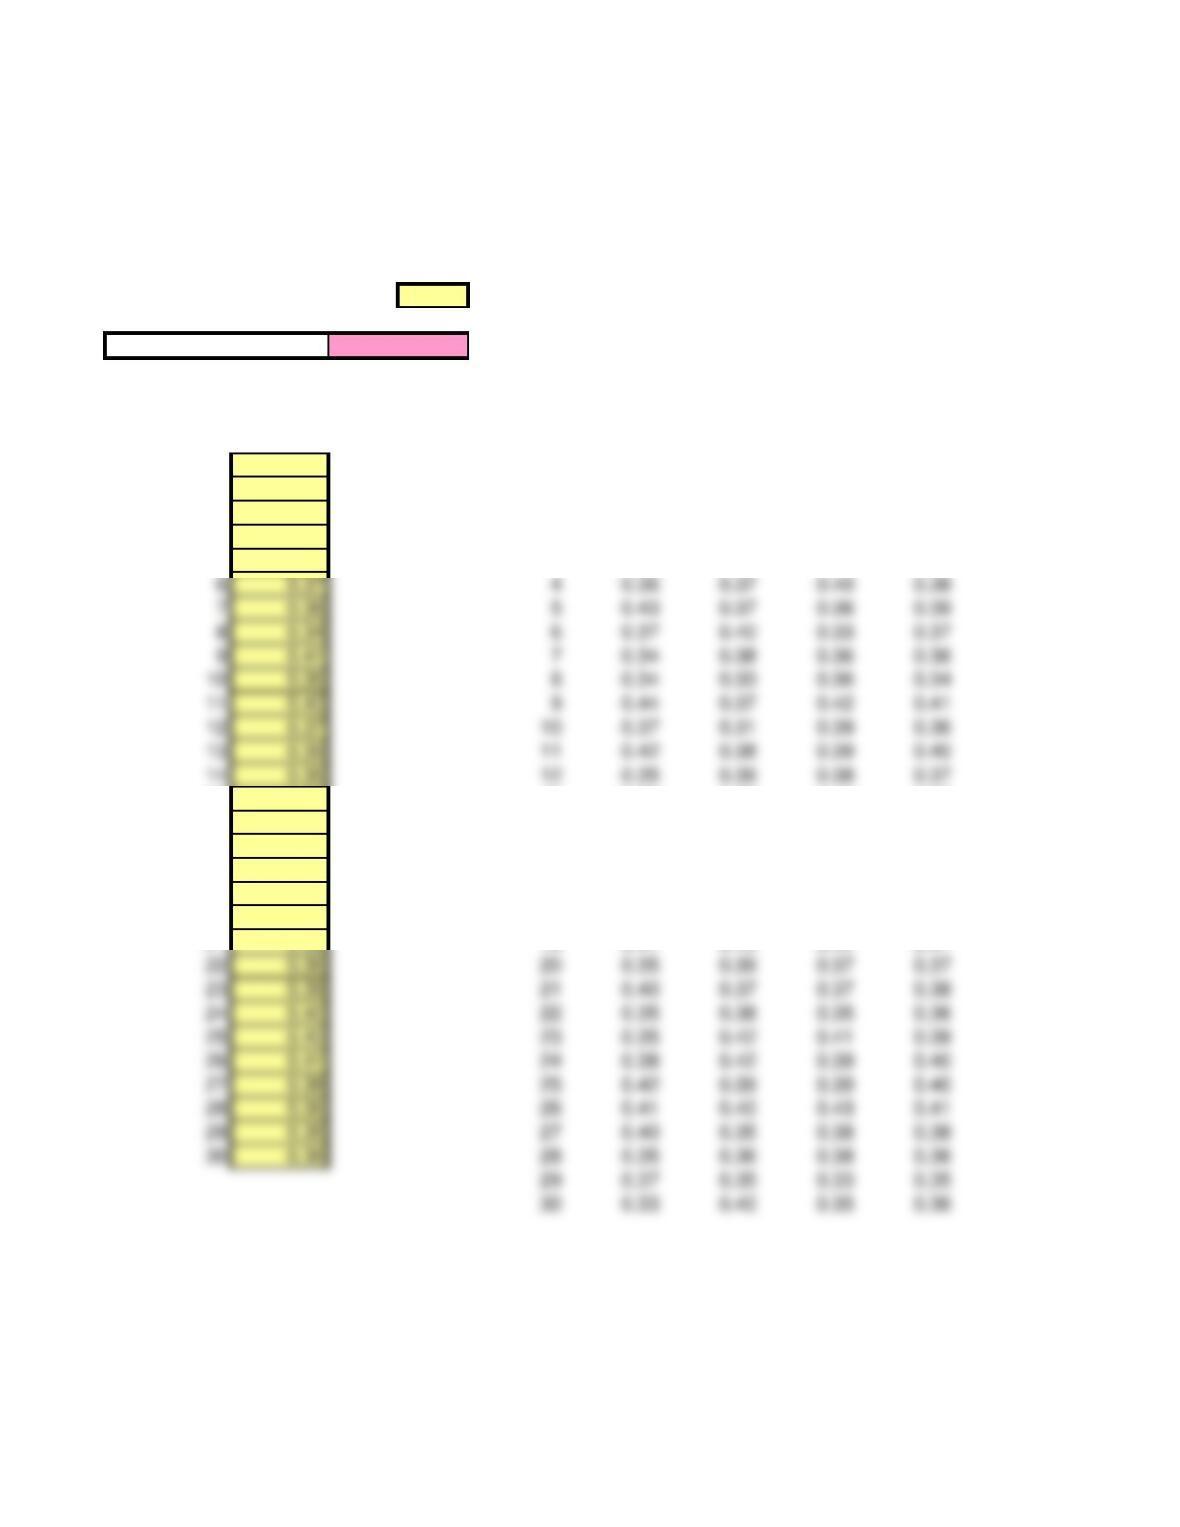
Problem 8-24
Hawkeye Magnetronics
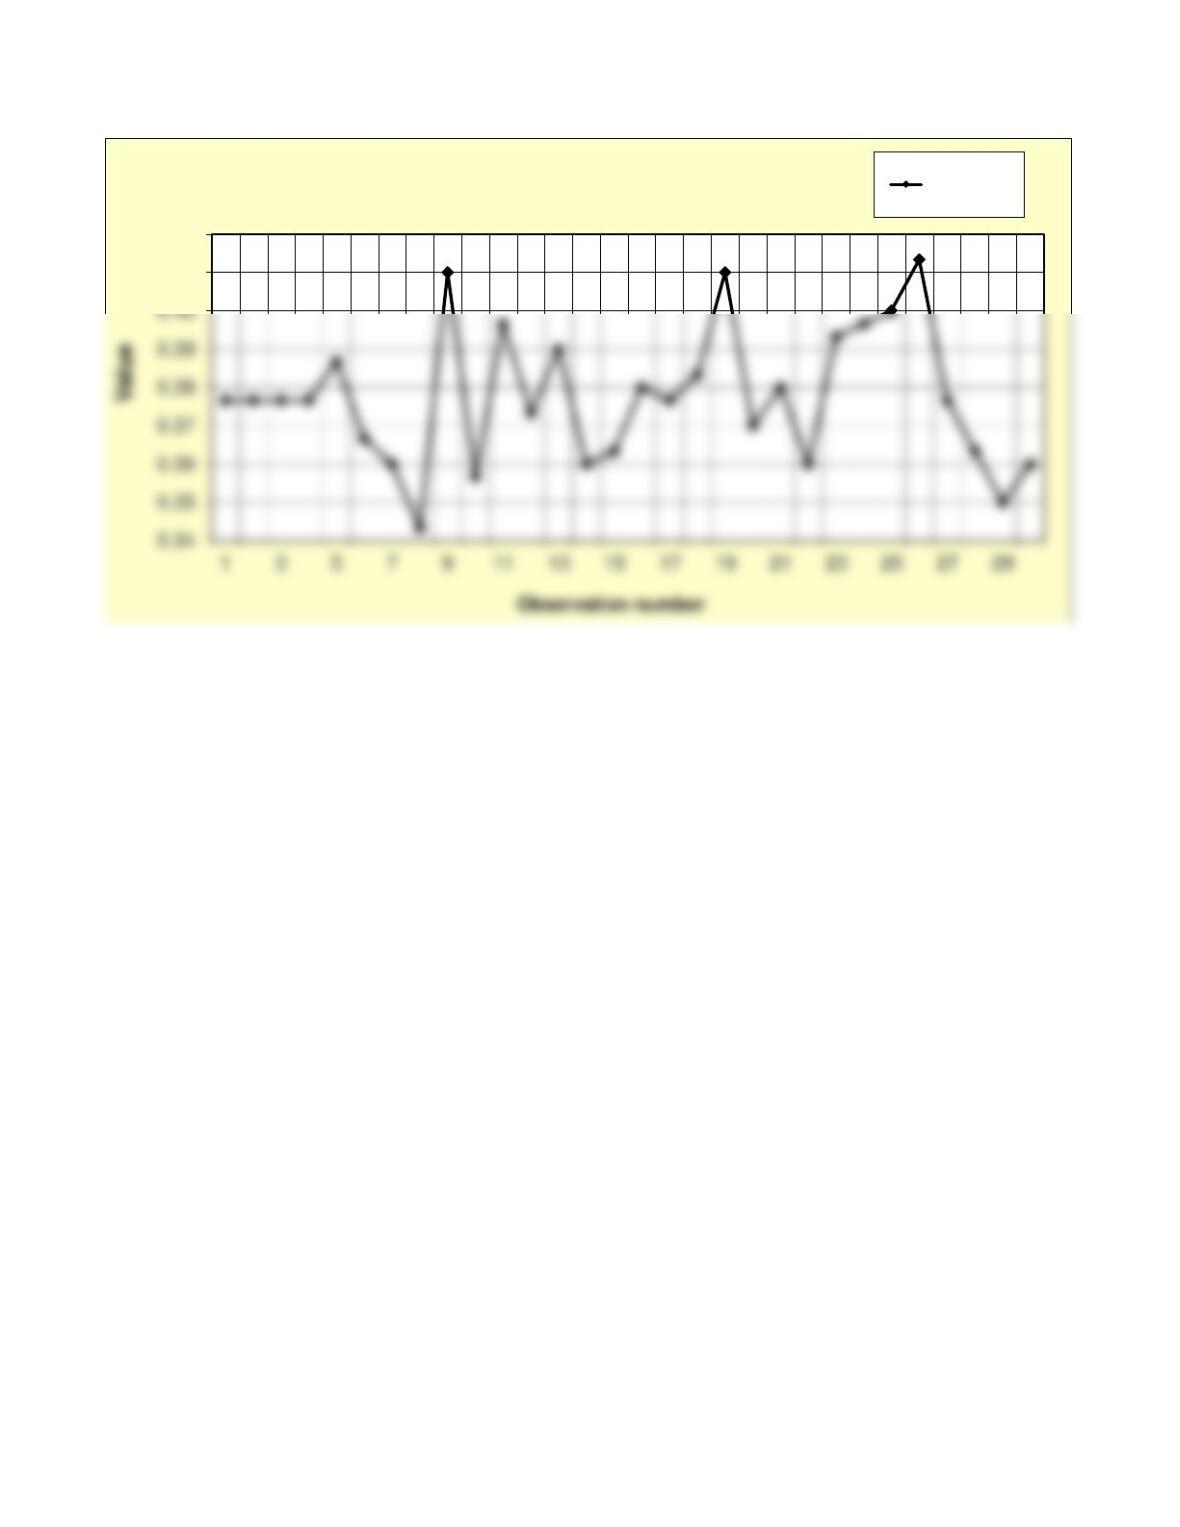
Run Chart – Showing Sample Means Over a Time Period
See Run Chart Tab for this chart
Number of observations 90
Grand Average
Sample Mean
Observation Values DATA
10.38 Sample Means
20.38 123
30.38 10.39 0.39 0.35 0.38
40.38 20.38 0.40 0.35 0.38
50.39 30.33 0.39 0.41 0.38
15 0.36 13 0.39 0.38 0.40 0.39
16 0.38 14 0.33 0.36 0.39 0.36
17 0.38 15 0.37 0.37 0.35 0.36
18 0.38 16 0.36 0.37 0.41 0.38
19 0.41 17 0.39 0.35 0.39 0.38
20 0.37 18 0.36 0.41 0.38 0.38
21 0.38 19 0.41 0.40 0.42 0.41
0.444
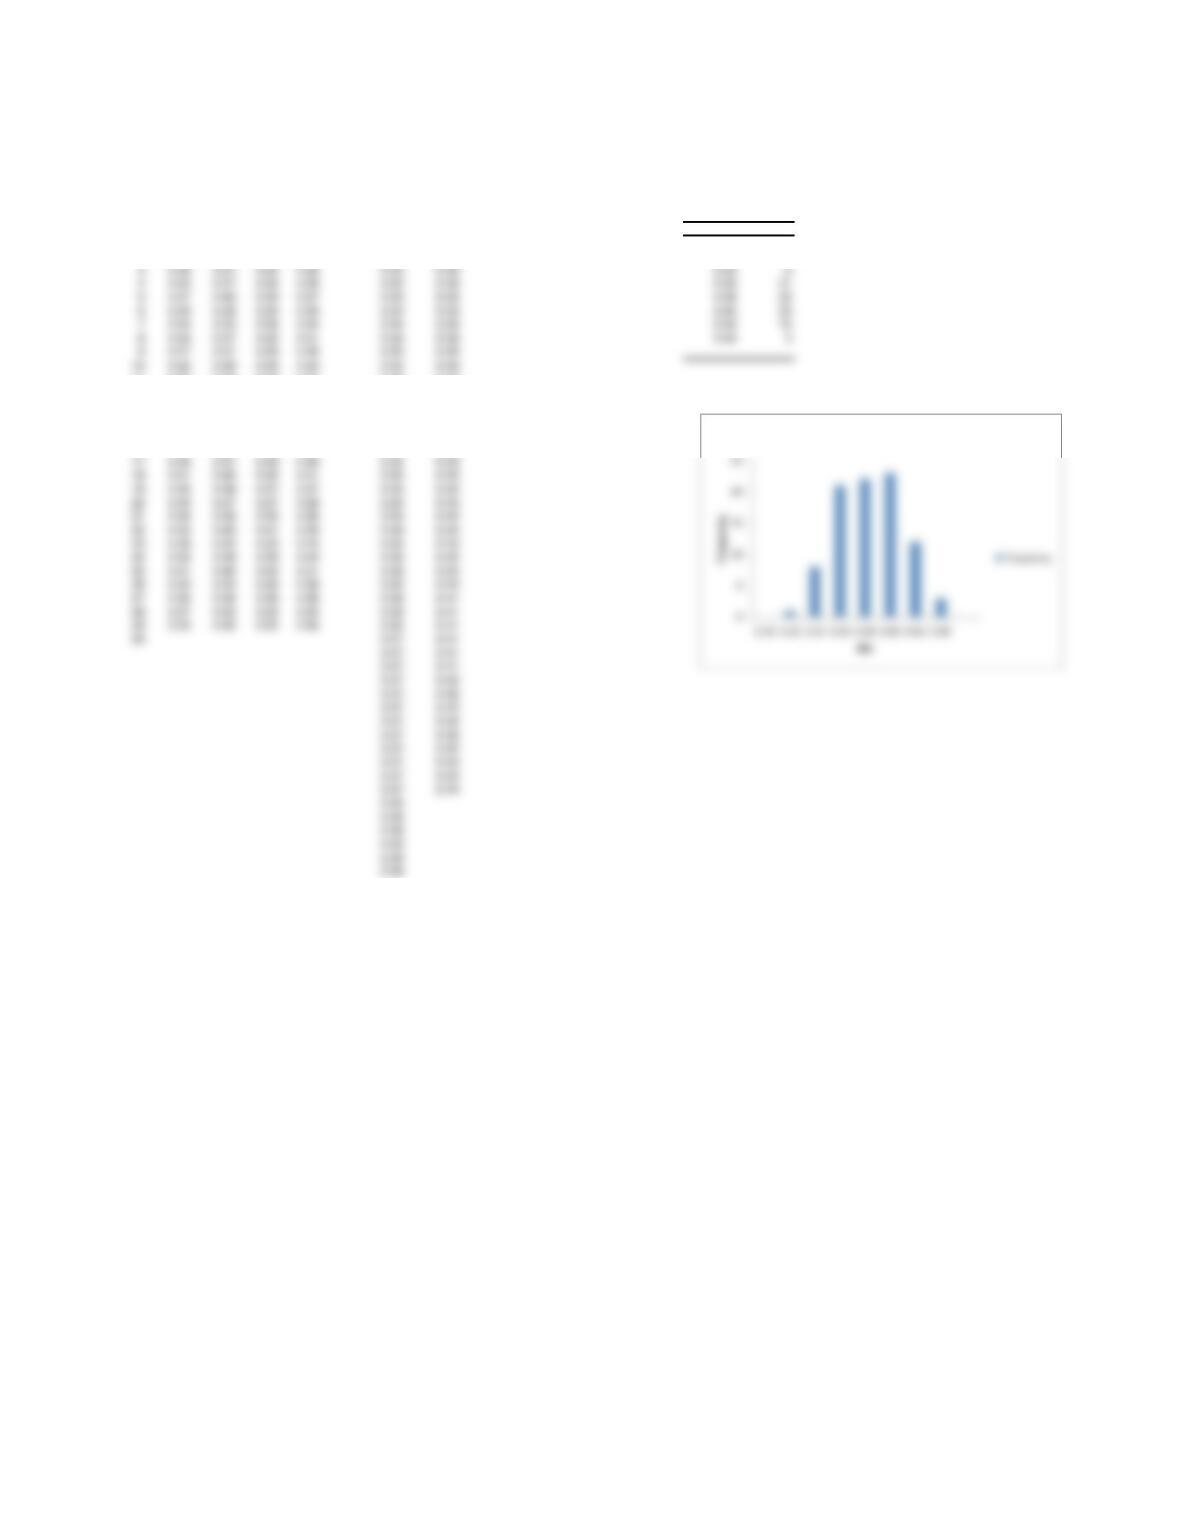
Problem 8-24
Histogram for Hawkeye Magnetronics
Sorted
DATA Values Histogram Values
Sample 1 2 3 Means
0.39 0.39 0.35 0.38 0.31 0.38 Bin Frequency
1 0.38 0.40 0.35 0.38 0.33 0.38 0.30 0
2 0.33 0.39 0.41 0.38 0.33 0.38 0.32 1
11 0.35 0.39 0.38 0.37 0.35 0.39
12 0.39 0.38 0.40 0.39 0.35 0.39
13 0.33 0.36 0.39 0.36 0.35 0.39
14 0.37 0.37 0.35 0.36 0.35 0.39
15 0.36 0.37 0.41 0.38 0.35 0.39
16 0.39 0.35 0.39 0.38 0.35 0.39
17 0.36 0.41 0.38 0.38 0.35 0.39
18 0.41 0.40 0.42 0.41 0.35 0.40
19 0.35 0.39 0.37 0.37 0.35 0.40
20 0.40 0.37 0.37 0.38 0.35 0.40
21 0.35 0.38 0.35 0.36 0.35 0.40
22 0.35 0.42 0.41 0.39 0.36 0.40
23 0.38 0.42 0.39 0.40 0.36 0.40
24 0.42 0.39 0.39 0.40 0.36 0.40
25 0.41 0.40 0.43 0.41 0.36 0.40
26 0.40 0.35 0.38 0.38 0.36 0.40
27 0.35 0.36 0.38 0.36 0.36 0.41
28 0.37 0.35 0.33 0.35 0.36 0.41
29 0.33 0.40 0.35 0.36 0.36 0.41
Histogram
3 0.36 0.37 0.40 0.38 0.33 0.38 0.34 8
4 0.43 0.37 0.36 0.39 0.33 0.39 0.36 21
5 0.37 0.40 0.33 0.37 0.33 0.39 0.38 22
6 0.34 0.38 0.36 0.36 0.33 0.39 0.40 23
7 0.34 0.33 0.36 0.34 0.34 0.39 0.42 12
8 0.44 0.37 0.42 0.41 0.34 0.39 0.44 3
10 0.42 0.38 0.39 0.40 0.35 0.39
0.41
0.42
Problem 8-24 Run Chart of Sample Means Sample Means