Problem 8-38
Gotham City Police Department
X and Moving Range Chart
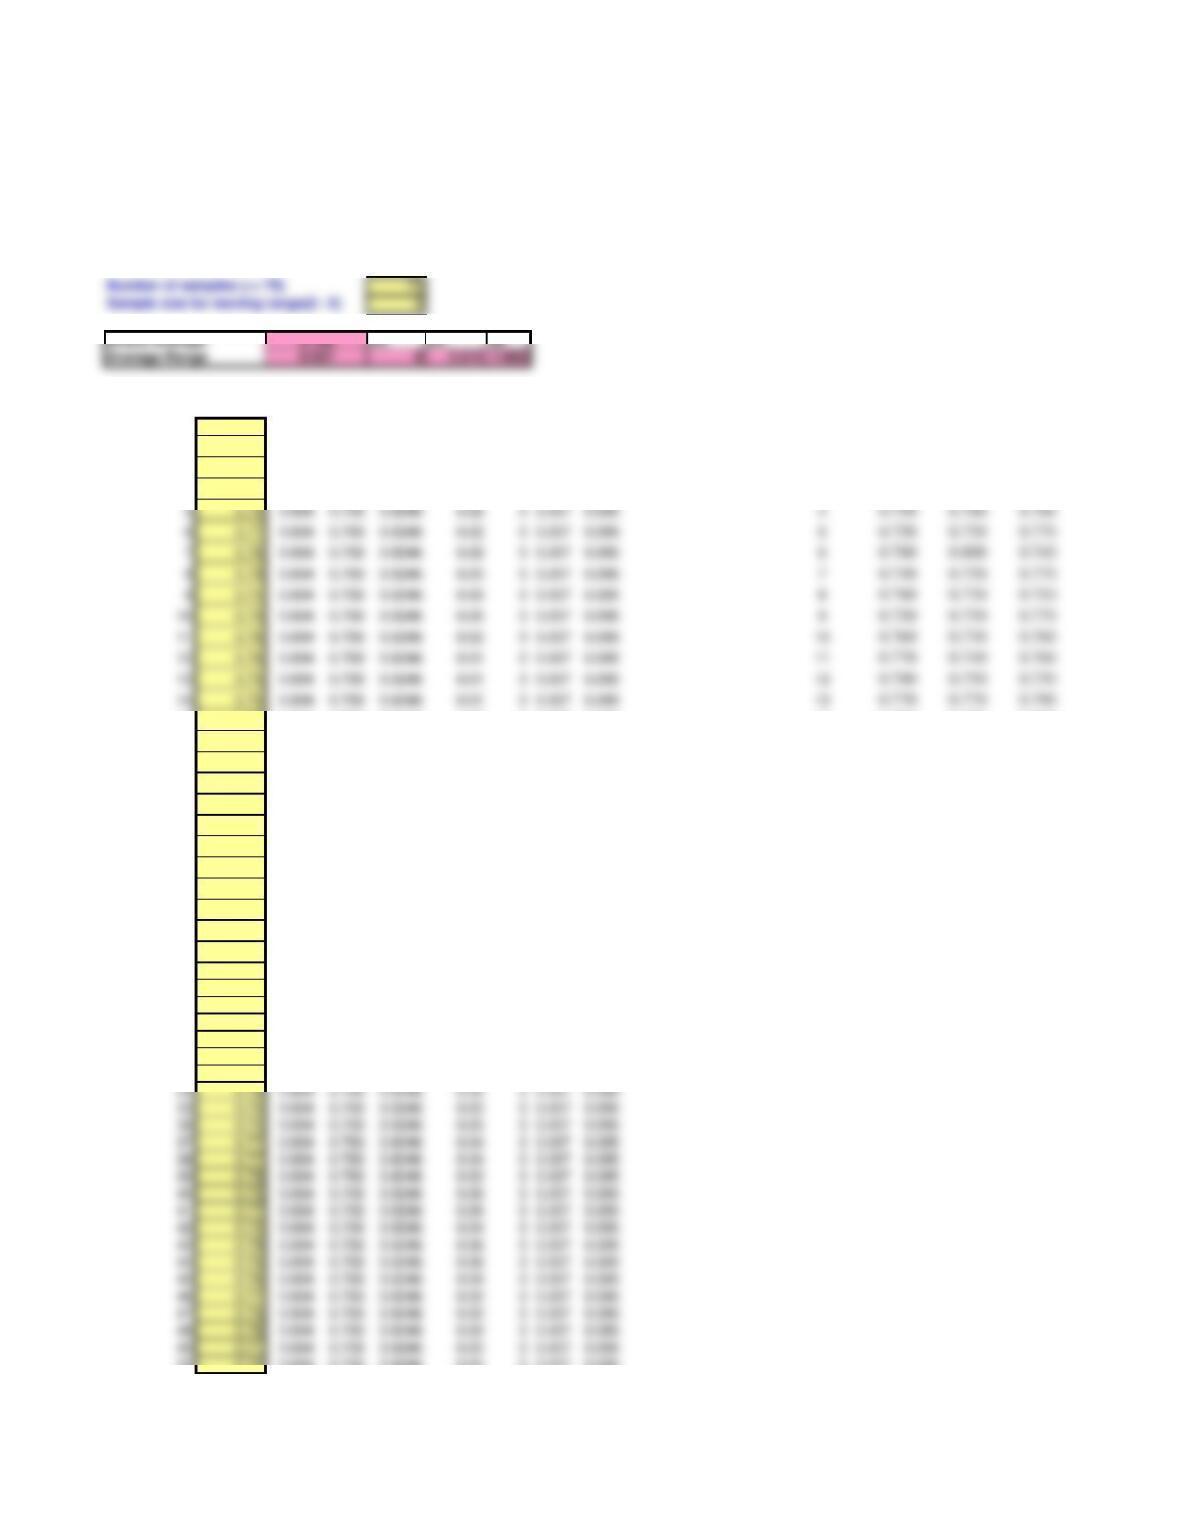
This spreadsheet is designed for up to 75 observations and a moving range from 2 to 5. Enter data ONLY in yellow-shaded cells.
Enter the number of samples in cell E6 and the sample size in cell E7. Then enter your data in the grid below.
Click on sheet tabs to display the control charts (some rescaling may be needed). Calculated standard deviation = 0.021203
Grand Average D3 D4 d2
Moving
Observation Value LCLx CLx UCLx Range LCLr CLr UCLr Samples
1 0.78 0.694 0.759 0.8246 Sample no.
2 0.76 0.694 0.759 0.8246 #N/A #N/A #N/A #N/A 1 0.780 0.760 0.770
3 0.77 0.694 0.759 0.8246 0.02 0 0.037 0.095 2 0.770 0.750 0.770
4 0.77 0.694 0.759 0.8246 0.01 0 0.037 0.095 3 0.760 0.790 0.740
15 0.77 0.694 0.759 0.8246 0.02 0 0.037 0.095 14 0.730 0.770 0.730
16 0.78 0.694 0.759 0.8246 0.03 0 0.037 0.095 15 0.790 0.750 0.760
17 0.80 0.694 0.759 0.8246 0.03 0 0.037 0.095 16 0.770 0.750 0.760
18 0.74 0.694 0.759 0.8246 0.06 0 0.037 0.095 17 0.710 0.750 0.750
19 0.74 0.694 0.759 0.8246 0.06 0 0.037 0.095 18 0.770 0.790 0.750
20 0.75 0.694 0.759 0.8246 0.01 0 0.037 0.095 19 0.760 0.780 0.780
21 0.77 0.694 0.759 0.8246 0.03 0 0.037 0.095 20 0.720 0.710 0.750
22 0.78 0.694 0.759 0.8246 0.03 0 0.037 0.095 21 0.790 0.780 0.780
23 0.73 0.694 0.759 0.8246 0.05 0 0.037 0.095 22 0.790 0.760 0.750
24 0.71 0.694 0.759 0.8246 0.07 0 0.037 0.095 23 0.720 0.780 0.750
25 0.75 0.694 0.759 0.8246 0.04 0 0.037 0.095 24 0.790 0.730 0.790
26 0.75 0.694 0.759 0.8246 0.04 0 0.037 0.095 25 0.760 0.760 0.780
27 0.77 0.694 0.759 0.8246 0.02 0 0.037 0.095
28 0.76 0.694 0.759 0.8246 0.02 0 0.037 0.095
29 0.73 0.694 0.759 0.8246 0.04 0 0.037 0.095
30 0.76 0.694 0.759 0.8246 0.03 0 0.037 0.095
31 0.77 0.694 0.759 0.8246 0.04 0 0.037 0.095
32 0.74 0.694 0.759 0.8246 0.03 0 0.037 0.095
33 0.76 0.694 0.759 0.8246 0.03 0 0.037 0.095
50 0.75 0.694 0.759 0.8246 0.05 0 0.037 0.095
51 0.75 0.694 0.759 0.8246 0.04 0 0.037 0.095
52 0.77 0.694 0.759 0.8246 0.02 0 0.037 0.095
53 0.79 0.694 0.759 0.8246 0.04 0 0.037 0.095
54 0.75 0.694 0.759 0.8246 0.04 0 0.037 0.095
55 0.76 0.694 0.759 0.8246 0.04 0 0.037 0.095
56 0.78 0.694 0.759 0.8246 0.03 0 0.037 0.095
57 0.78 0.694 0.759 0.8246 0.02 0 0.037 0.095
58 0.72 0.694 0.759 0.8246 0.06 0 0.037 0.095
59 0.71 0.694 0.759 0.8246 0.07 0 0.037 0.095
66 0.75 0.694 0.759 0.8246 0.04 0 0.037 0.095
67 0.72 0.694 0.759 0.8246 0.04 0 0.037 0.095
68 0.78 0.694 0.759 0.8246 0.06 0 0.037 0.095
69 0.75 0.694 0.759 0.8246 0.06 0 0.037 0.095
70 0.79 0.694 0.759 0.8246 0.04 0 0.037 0.095
75 0.78 0.694 0.759 0.8246 0.02 0 0.037 0.095
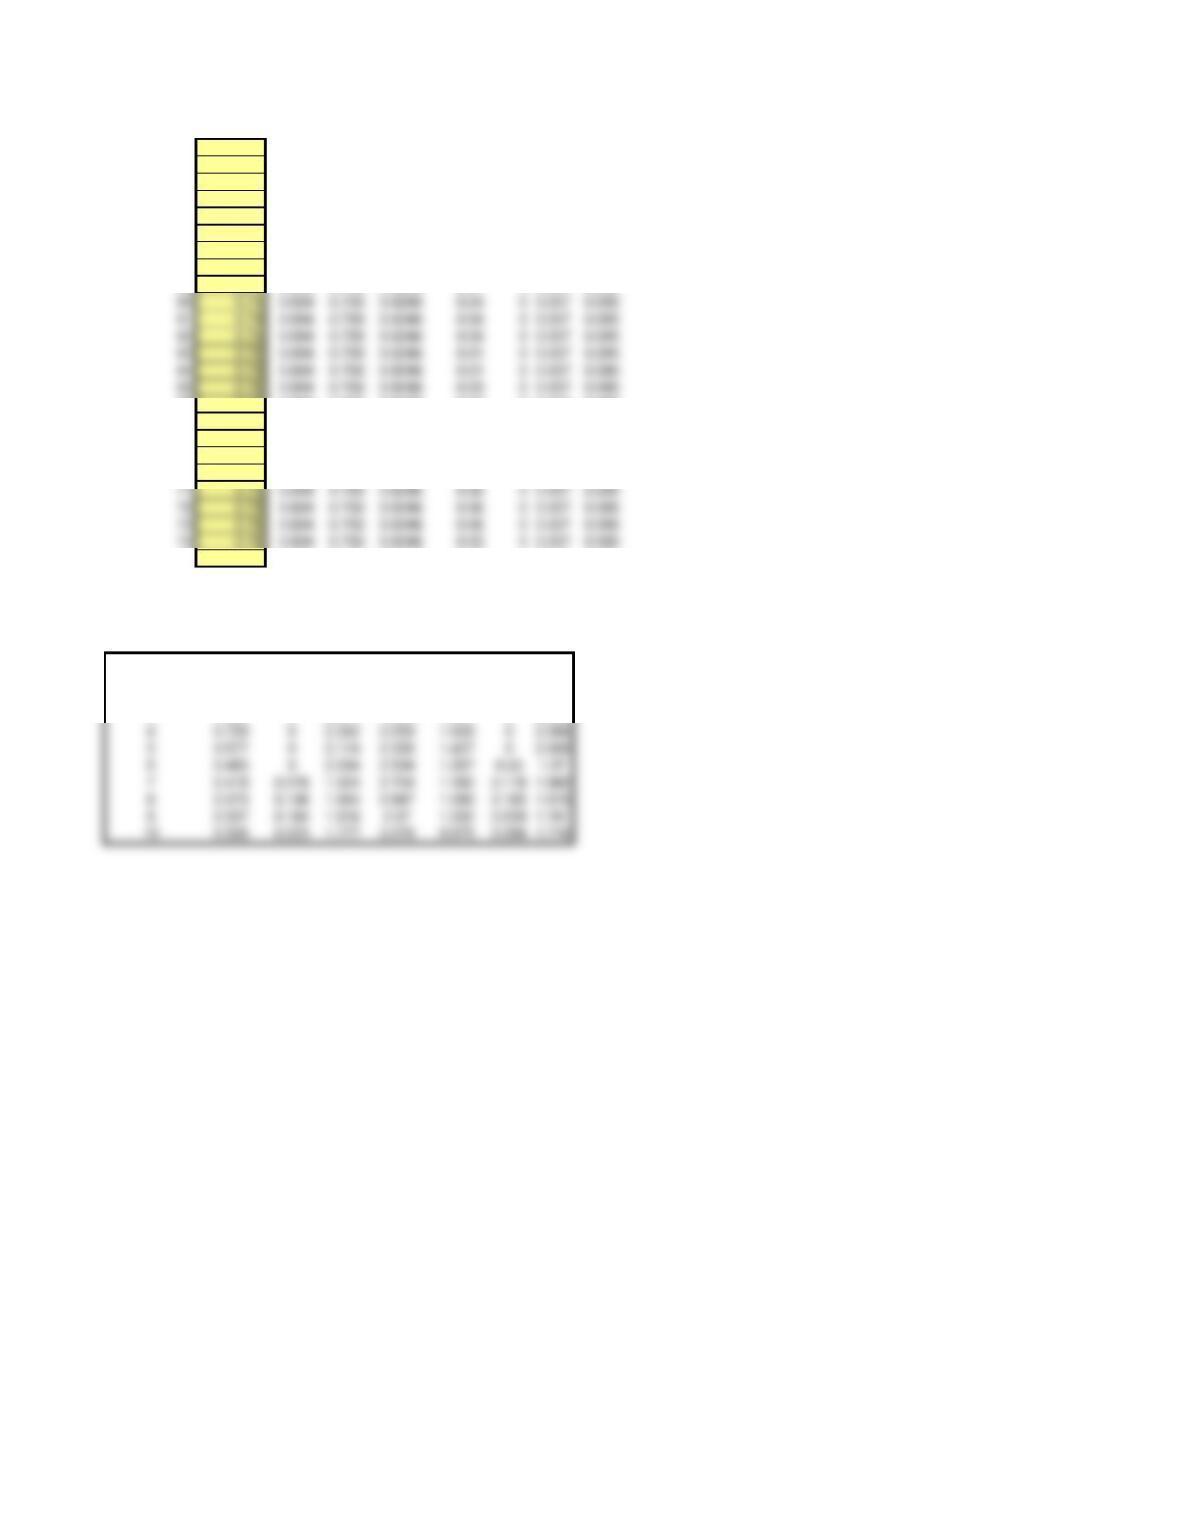
DO NOT MODIFY THIS TABLE
nA2 D3 D4 d2 A3 B3 B4
2 1.88 0 3.267 1.128 2.659 0 3.267
3 1.023 0 2.574 1.693 1.954 0 2.568
Control Chart Factors
0.83
0.85
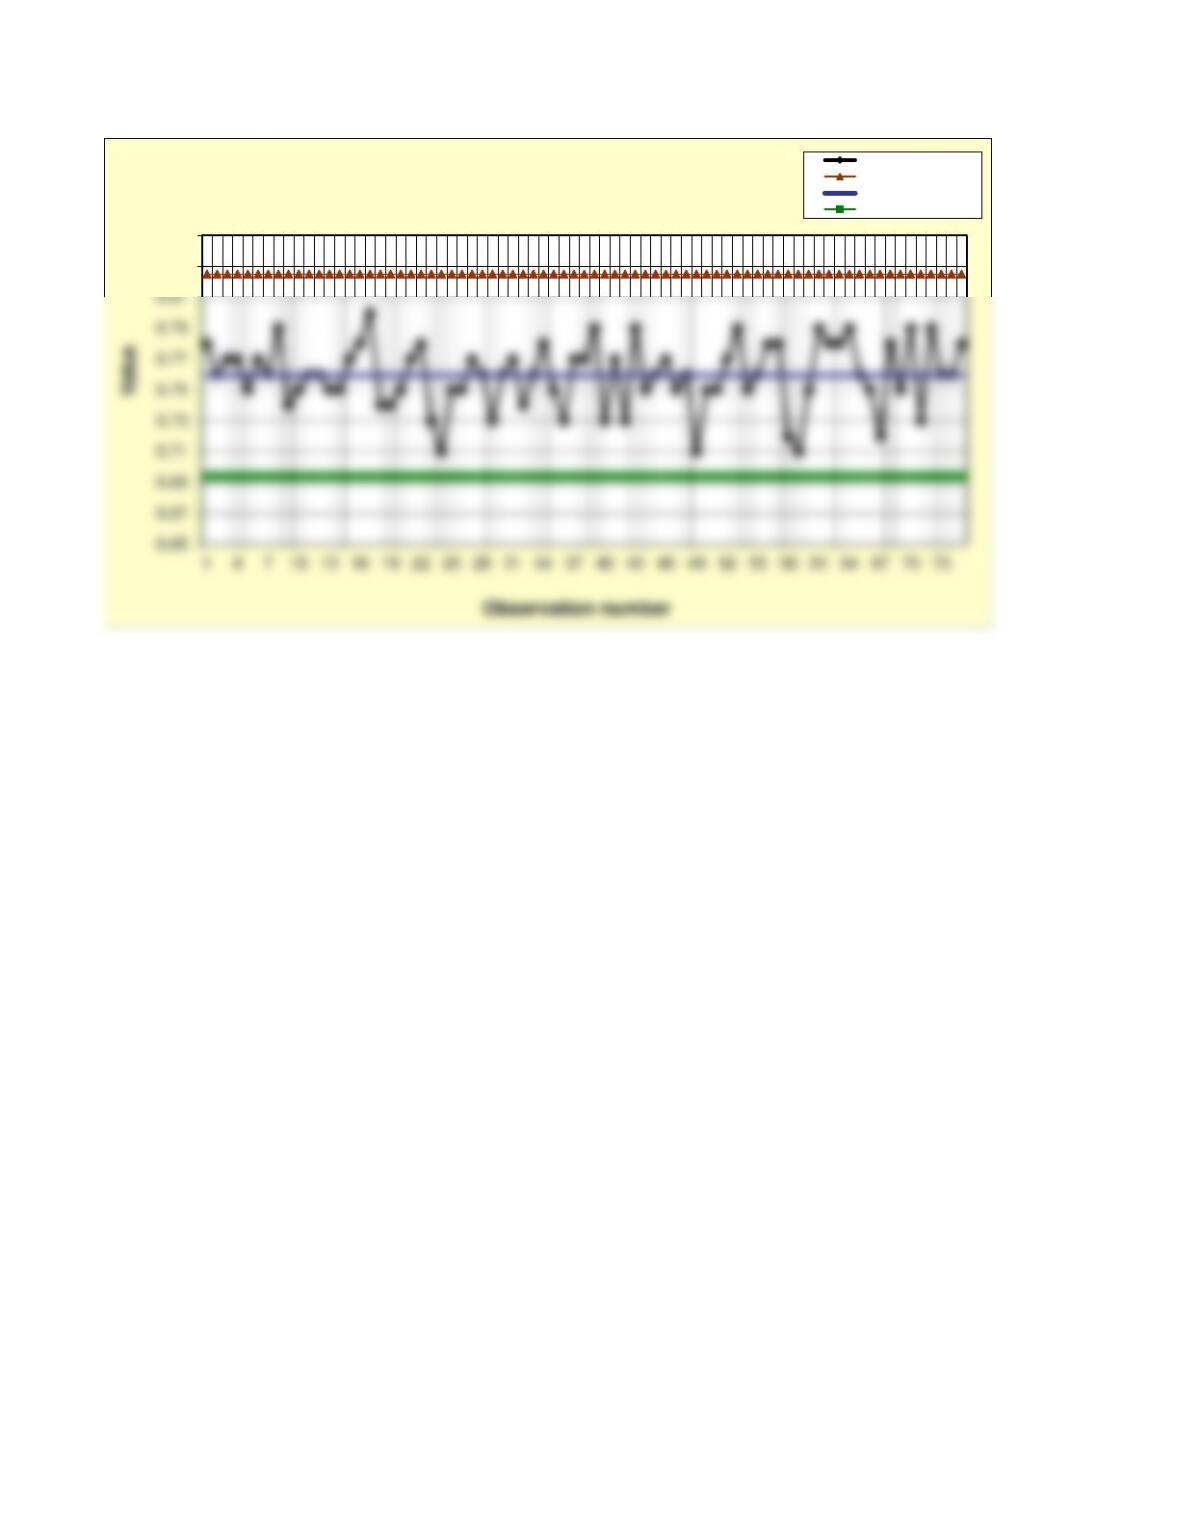
Prob. 8-38 – Individuals (X) Chart
Individuals
Upper control limit
Center line
Lower control limit
0.06
0.07
0.08
0.09
0.1
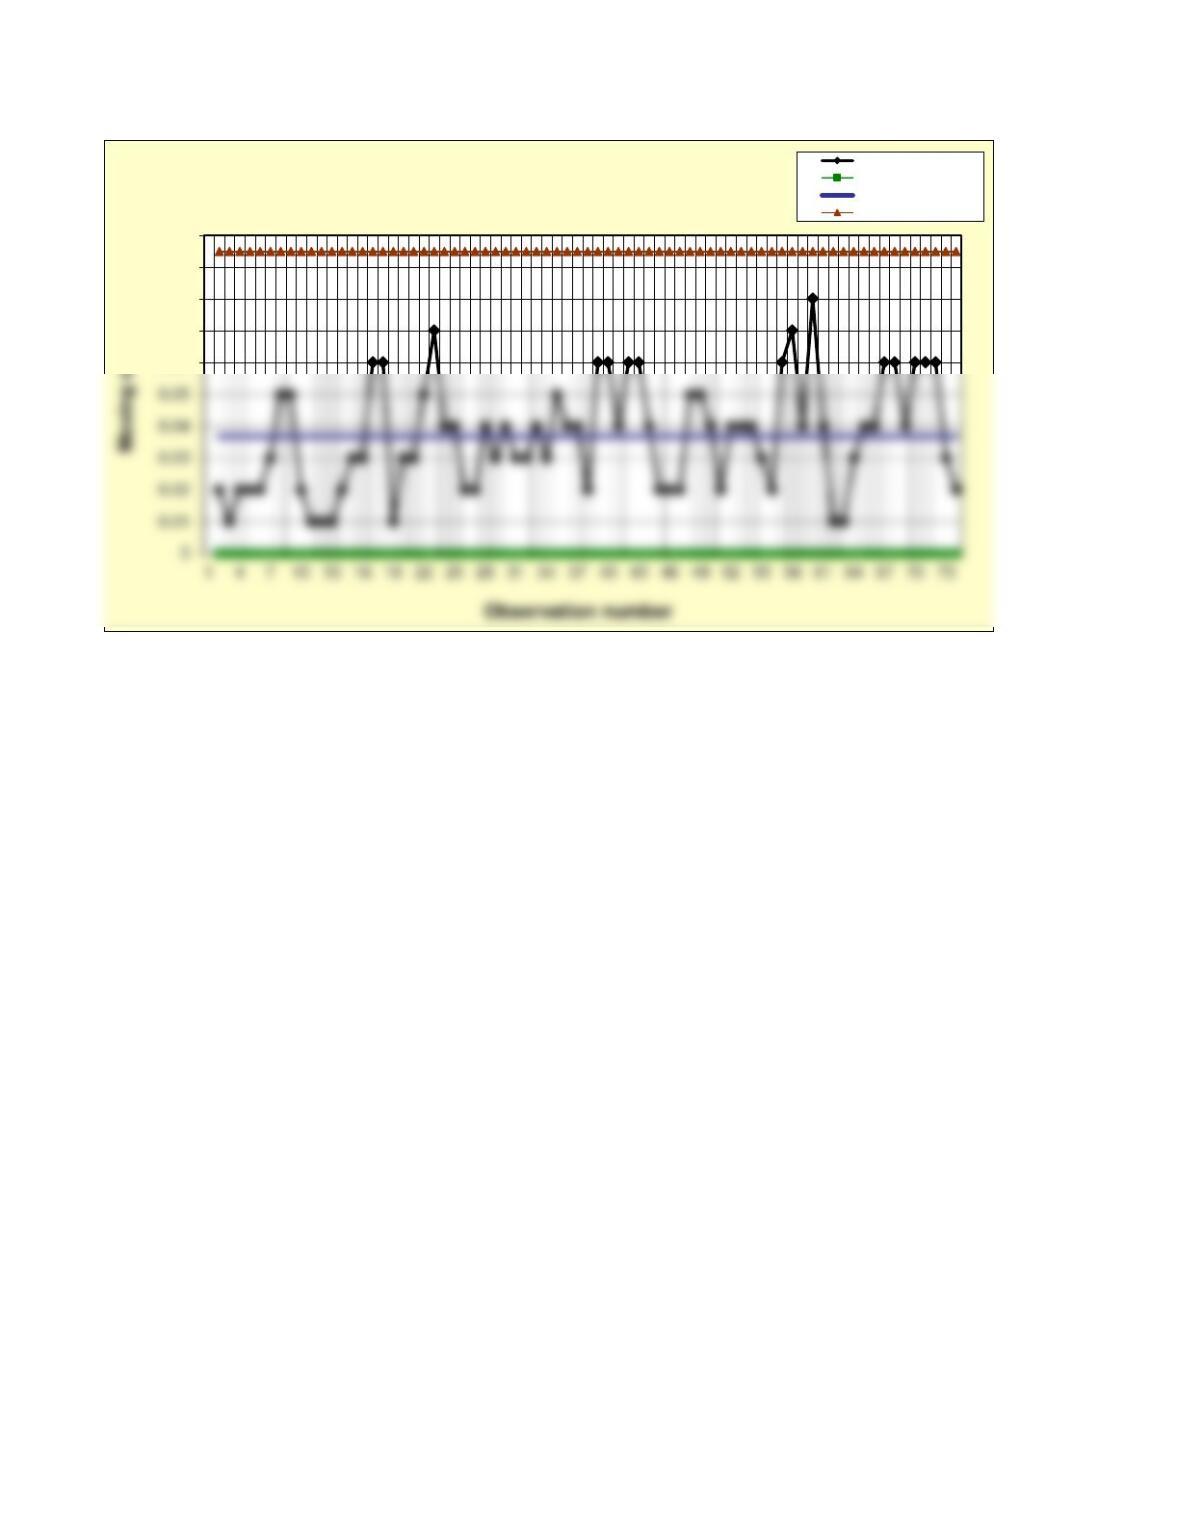
Prob. 8-38 Moving Range Chart
Moving ranges
Lower control limit
Center line
Upper control limit