Chapter 8- Problem 13a
Aussieburgers, Ltd.
Descriptive Statistics and Frequency Chart
This spreadsheet is designed for up to 100 pieces of data Enter data ONLY in yellow-shaded cells.
Note: The data and cell boundaries below were sorted in ascending order to more accurately show the increasing values on the histogram
as contrasted with decreasing values in the even-numbered solutions in the text.
Australian Hamburger Weights
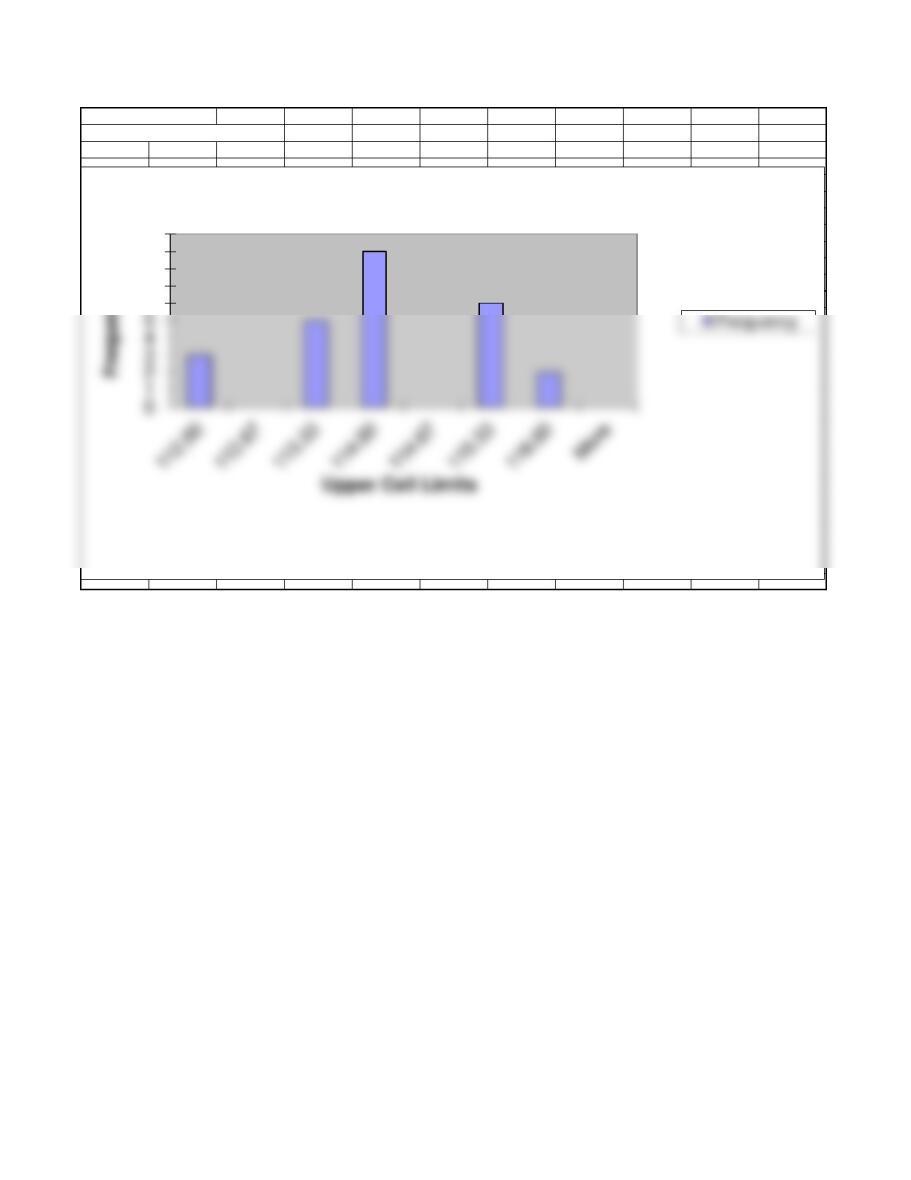
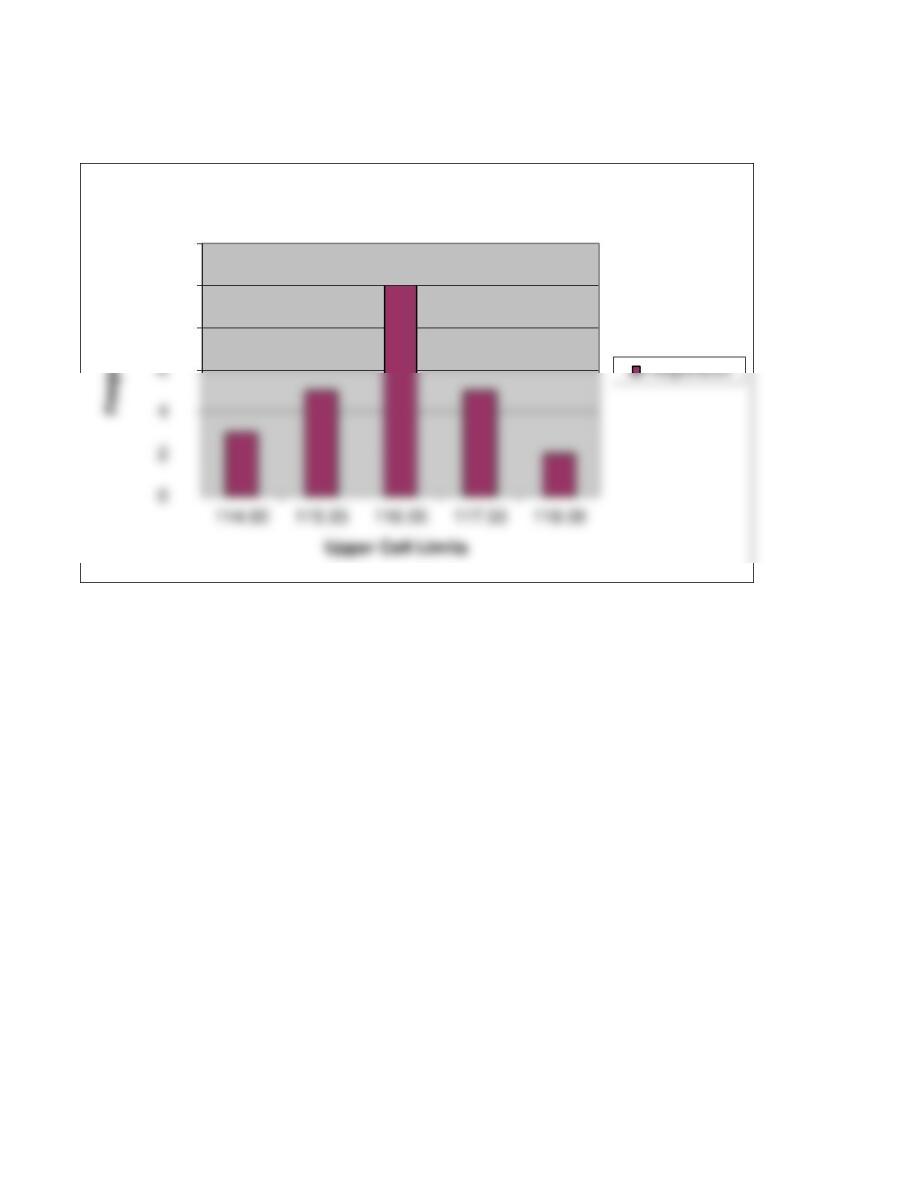
Frequency Table – Problem 8-13a
Upper Cell
Sorted Boundaries Frequencies
DATA Values
1112 Cell 1 112.00 3
2112 Cell 2 112.67 0
3112 Cell 3 113.33 5
4113 Cell 4 114.00 9
5113 Cell 5 114.67 0
6113 Cell 6 115.33 6
7113 Cell 7 116.00 2
9114
27
28
29
30
31
32
33
34
35
36
37
38
39
40
41
42
43
44
45
46
47
48
49
50
51
52
53
54
55
56
57
58
59
26
Freq. Distrib. 8-13a
Problem 8-13a
Australian Restaurant Scales
6
7
8
9
10
Frequency Distribution – Problem 8-13a
Page 5
Chapter 8- Problem 13b
Australian Hamburger Weights
Descriptive Statistics and Frequency Chart
This spreadsheet is designed for up to 100 pieces of data Enter data ONLY in yellow-shaded cells.
Note: The data and cell boundaries below were sorted in ascending order to more accurately show the increasing values on the histogram
as contrasted with decreasing values in the even-numbered solutions in the text.
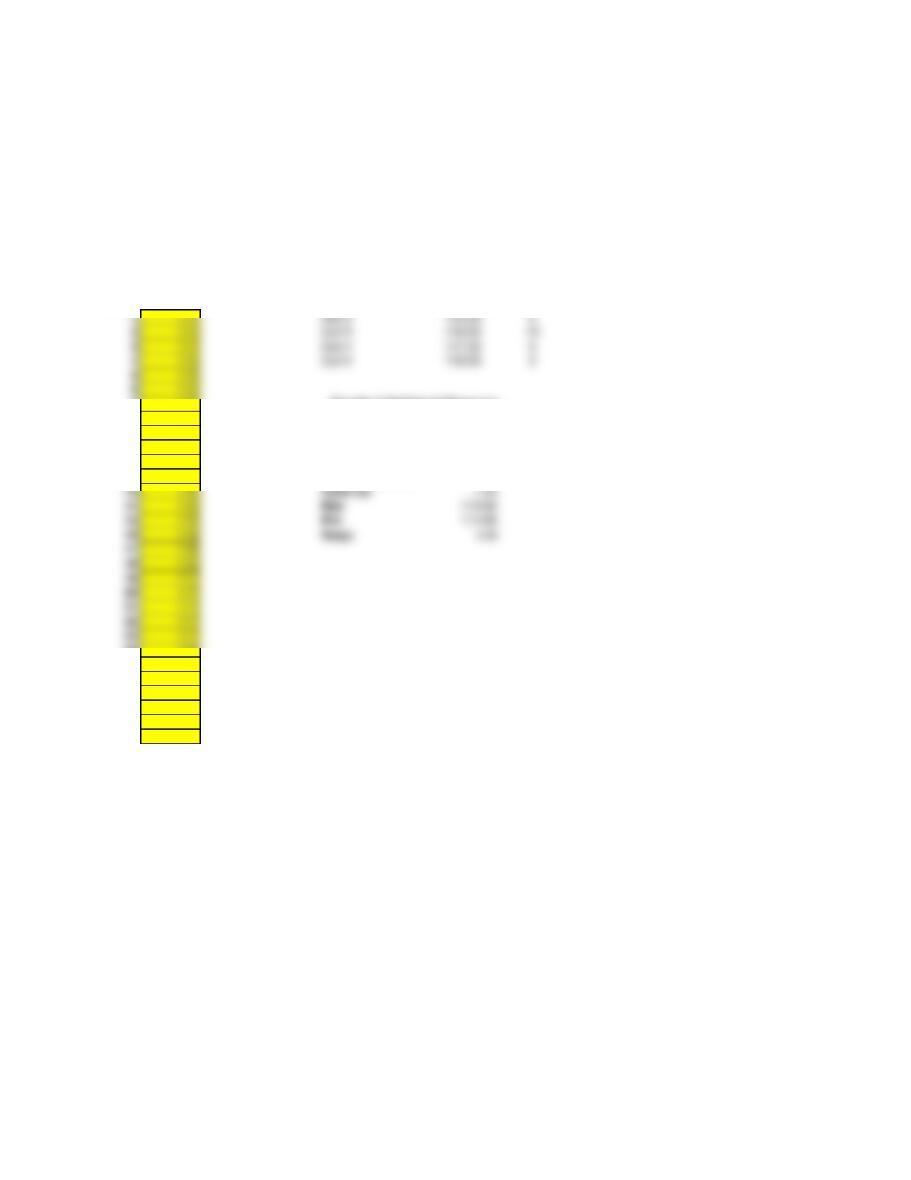
Frequency Table Problem 8-13b
Upper Cell
Boundaries Frequencies
DATA Cell 1 114.00 3
7115
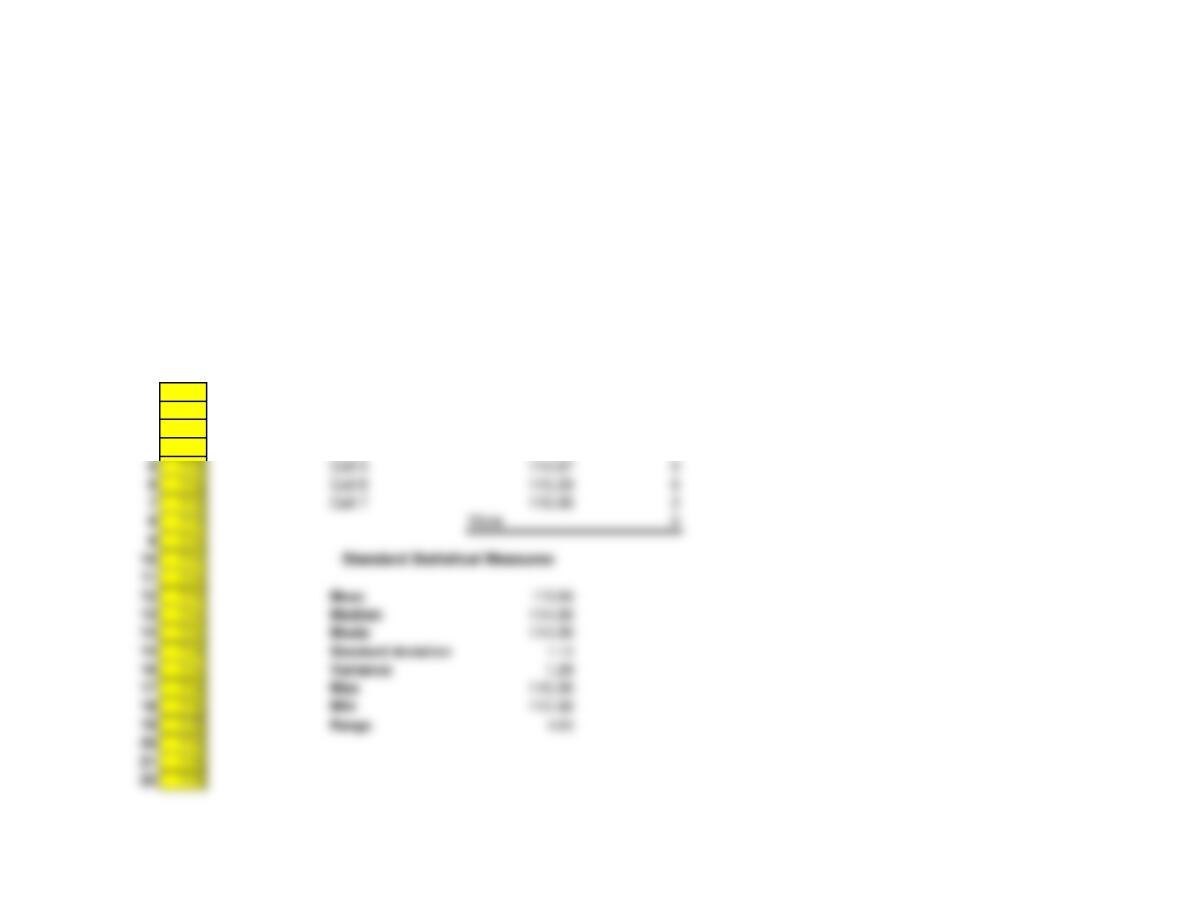
Standard Statistical Measures
8115
9116 Mean 115.92
10 116 Median 116.00
11 116 Mode 116.00
12 116 Standard deviation 1.12
13 116 Variance 1.24
14 116 Max 118.00
15 116 Min 114.00
16 116 Range 4.00
17 116
18 116
19 117
20 117
21 117
22 117
23 117
24 118
25 118
26
27
28
29
30
1114 Cell 2 115.33 5
2114 Cell 3 116.00 10
3114 Cell 4 117.33 5
4115 Cell 5 118.00 2
5115
6115
Problem 8-13b
Australian Restaurant Scales
8
10
12
Frequency Distribution – Problem 8-13b