EXERCISE 8-4 8-21
Therefore, we have:
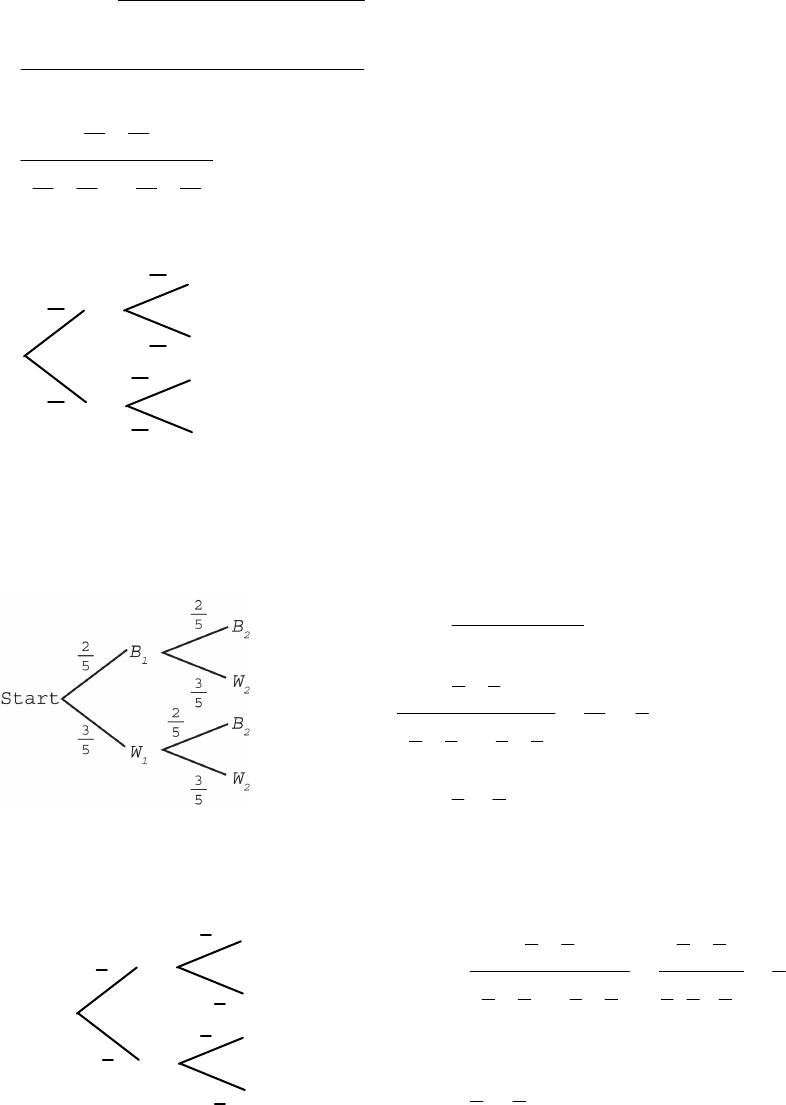
The following tree diagram is to be used for Problems 32 and 34.
1
5= .2
5= .4
W (white)
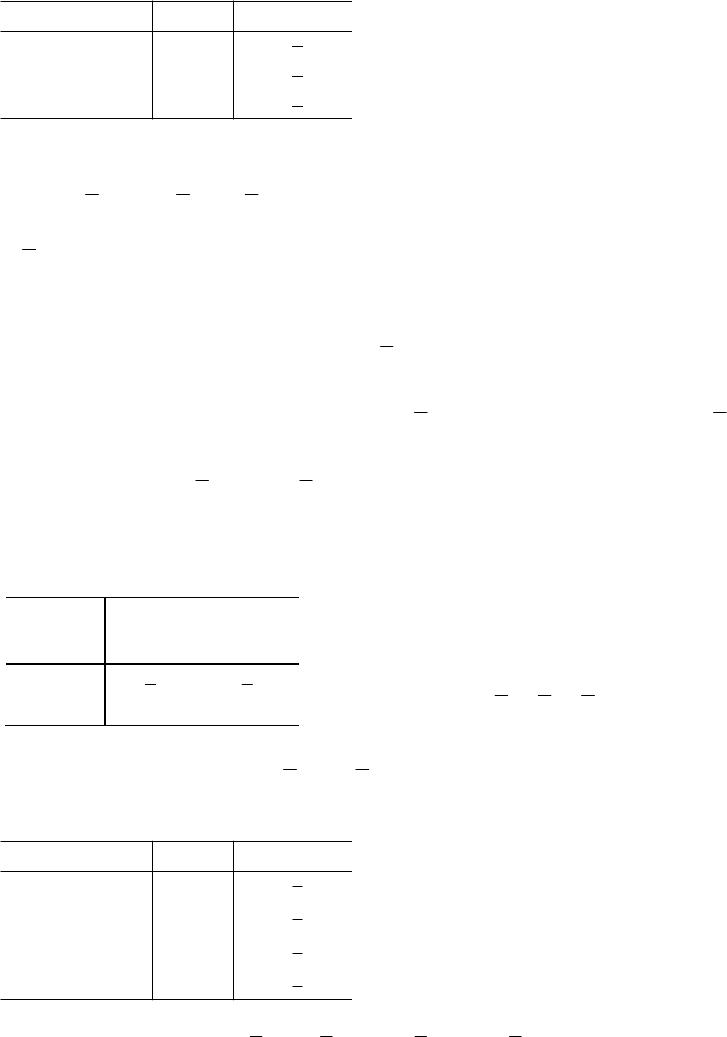
32. P(U2|W) = 22
112 2
()(| )
()(| ) ( )(| )
PU PW U
PU PW U PU PW U
34. P(U1|R) = 11
()(| )
()(| ) ( )(| )
PU P R U
PU P R U PU P R U
36. P(R1|R2) = 121
121 121
()( | )
()( | ) ()( | )
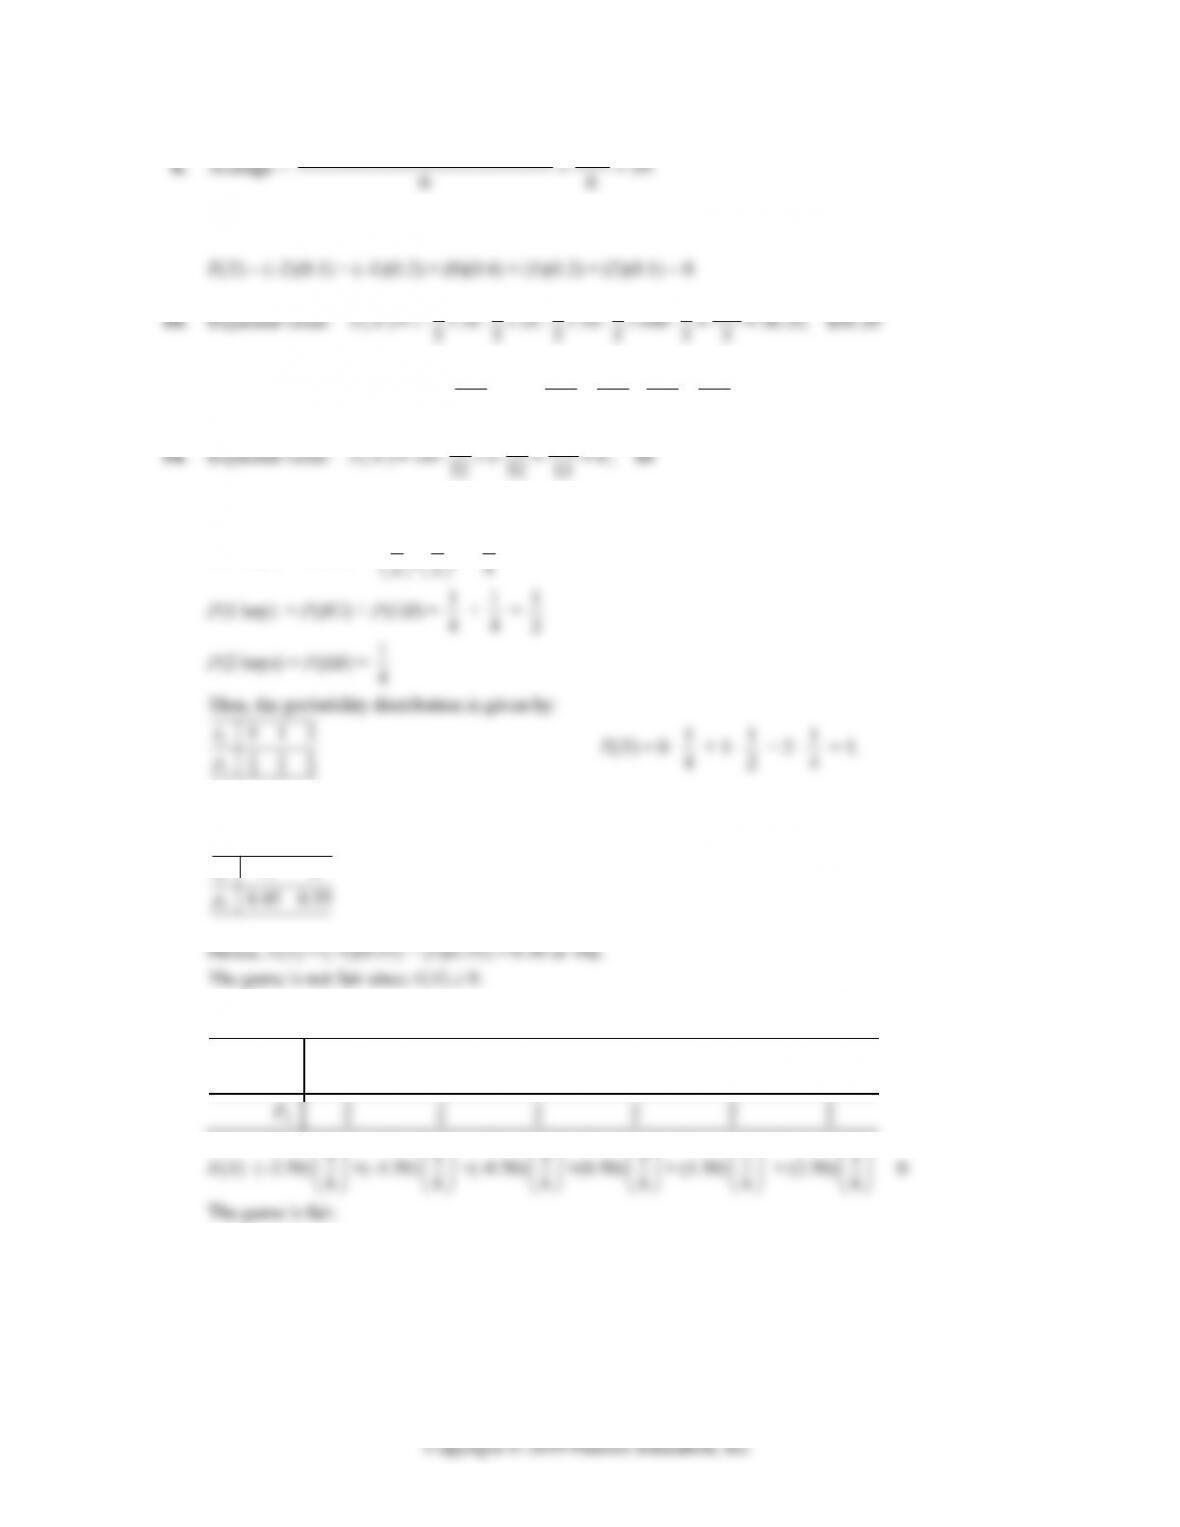
PR PR R
PR PR R PW PR W
8-22 CHAPTER 8: PROBABILITY
38. P(UW1|UW2) = 121
12 12
()( | )
()()
WWW
WW RW
PU PU U
PU U PU U
()( | )
WWW
PU PU U
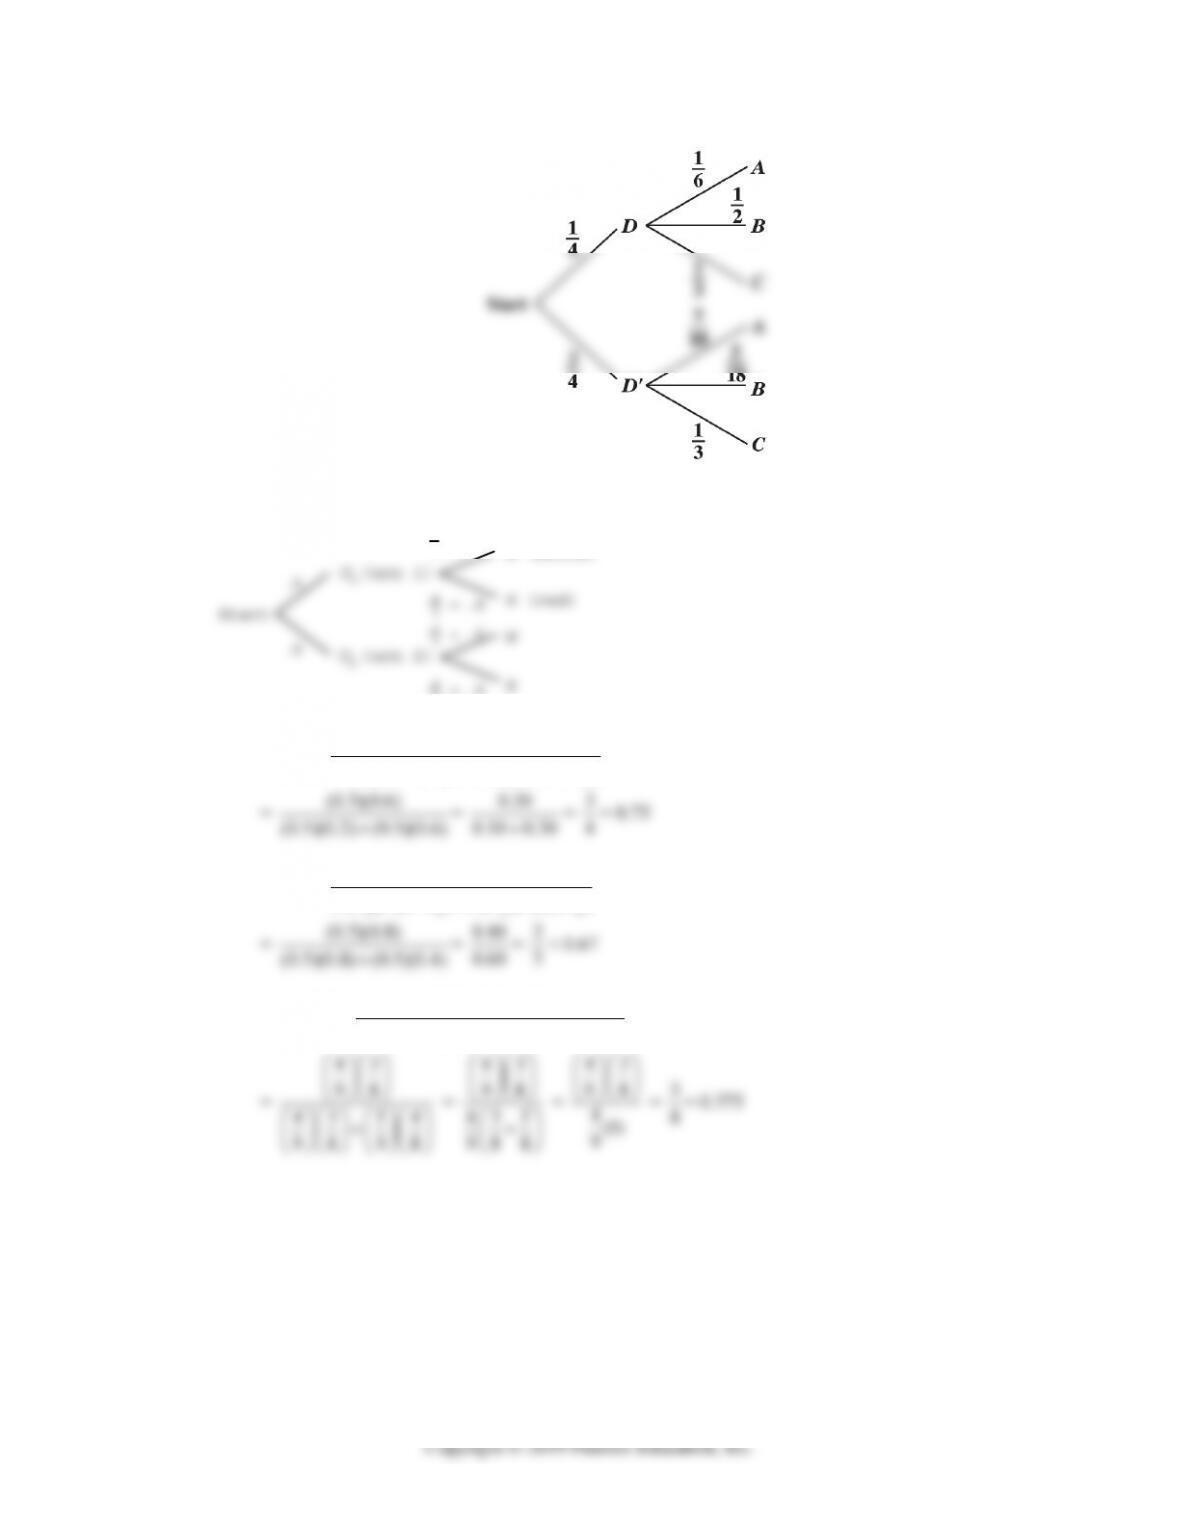
10 10 10 10
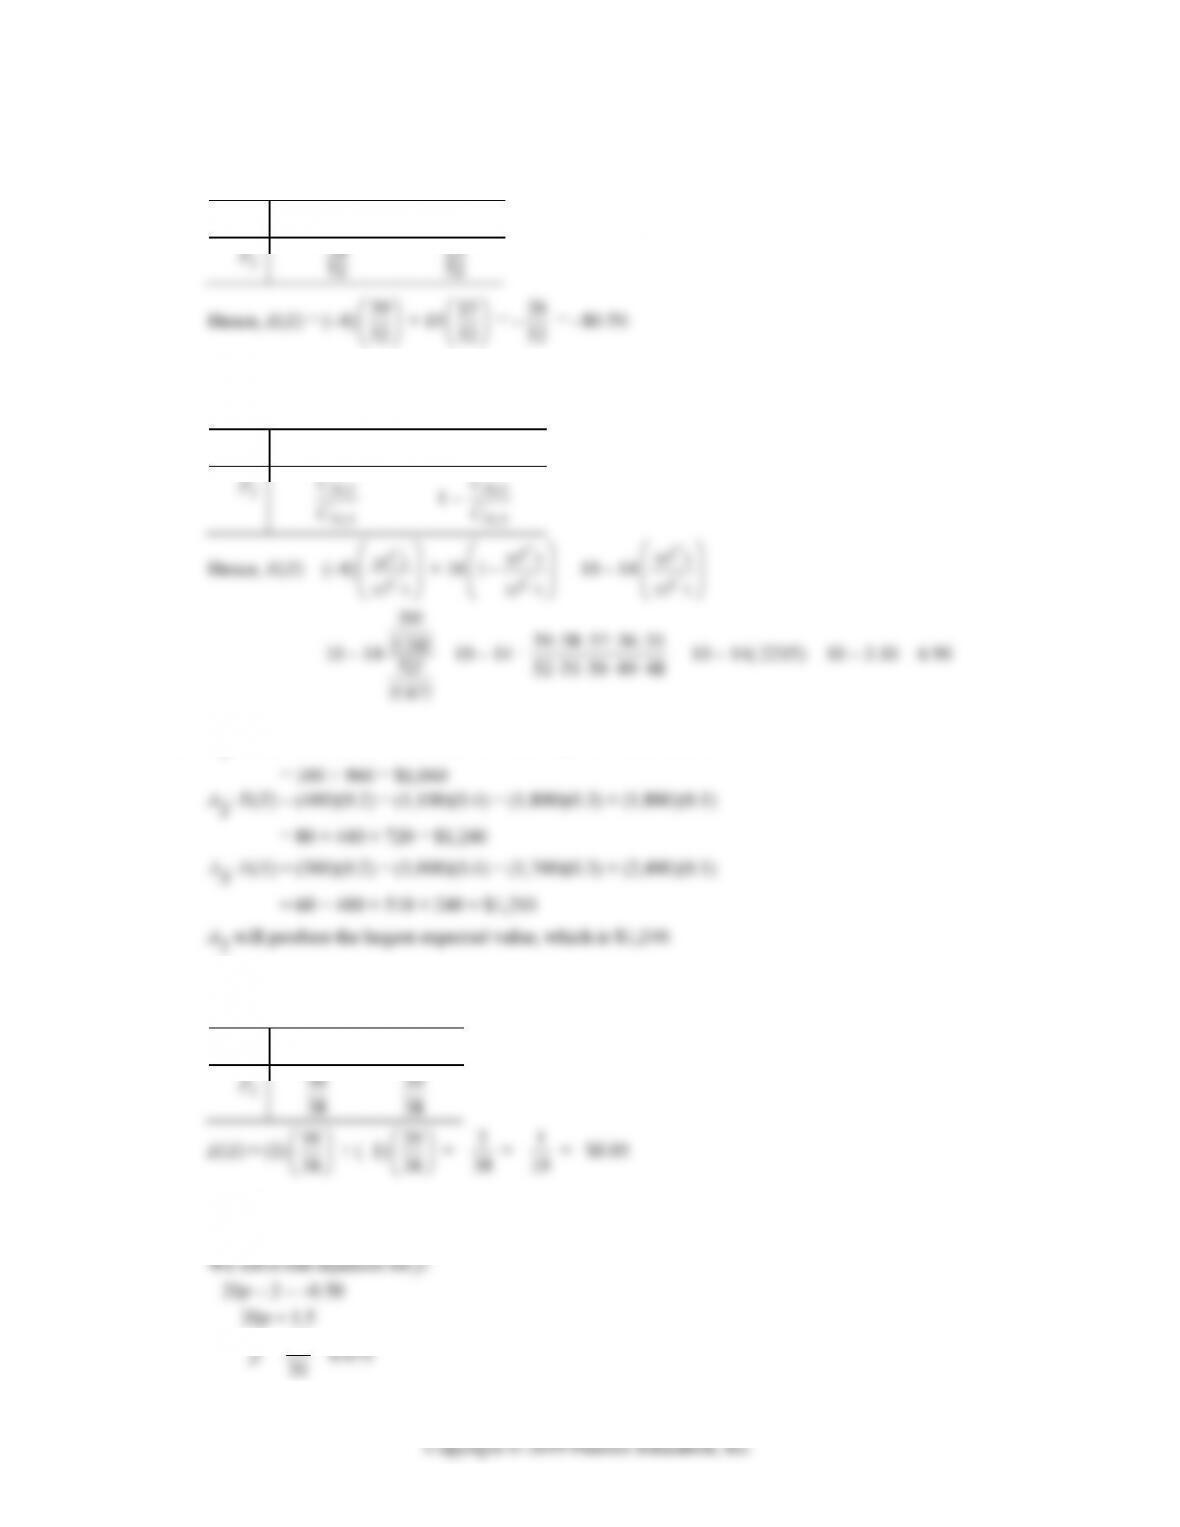
The tree diagram follows:
UW
3
10
5
4
10
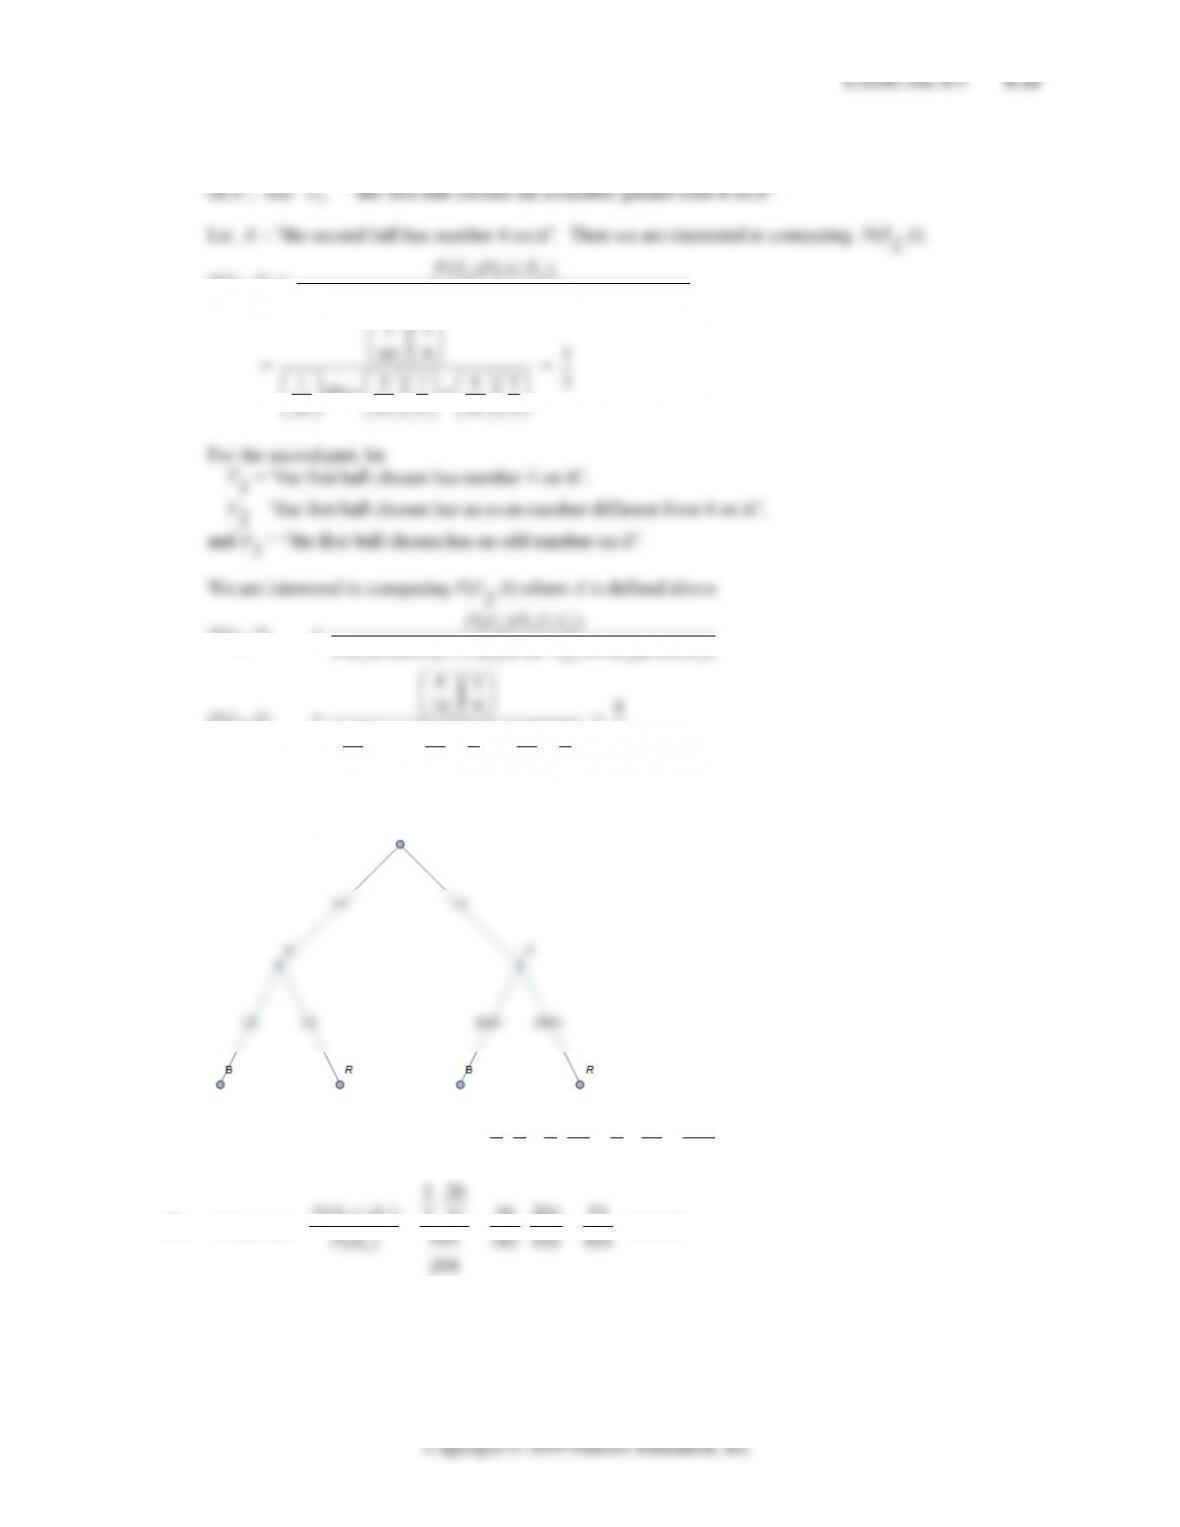
UR
2
UW1 is white from urn 1,
and UW2 is white from urn 2.
40. Since ,(|)0 ();
M
NPMN PM the events are dependent.
42. (A) False:
P(B1|W2) = 121
2
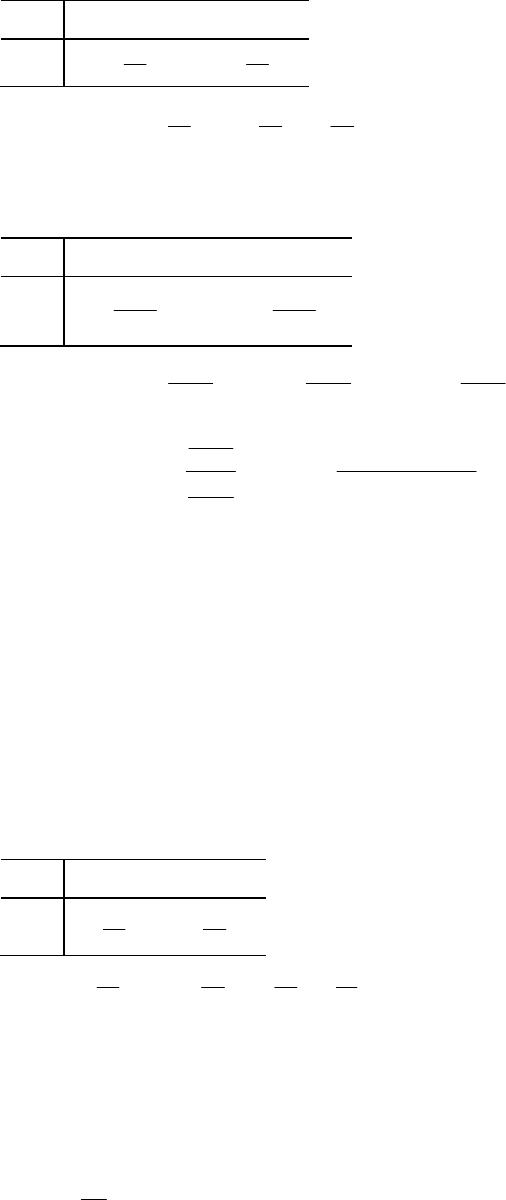
()
PW
23
P(W2|B1) = 3
5 ≠ 2
5
(B) False:
5
23 32
32 2
2
44. Let 1
E
= “the first ball chosen has number 4 on it”, 2
E
= “the first ball chosen has a number less than 4
E
P(E2|A) = 22
112 23 3
()(| ) ()(| ) ()(| )
PE PA E PE PA E PE PA E
(0)
P(F2|A) = 22
P(F2|A) =
14151
(0)
10 10 9 10 9
= 4
9
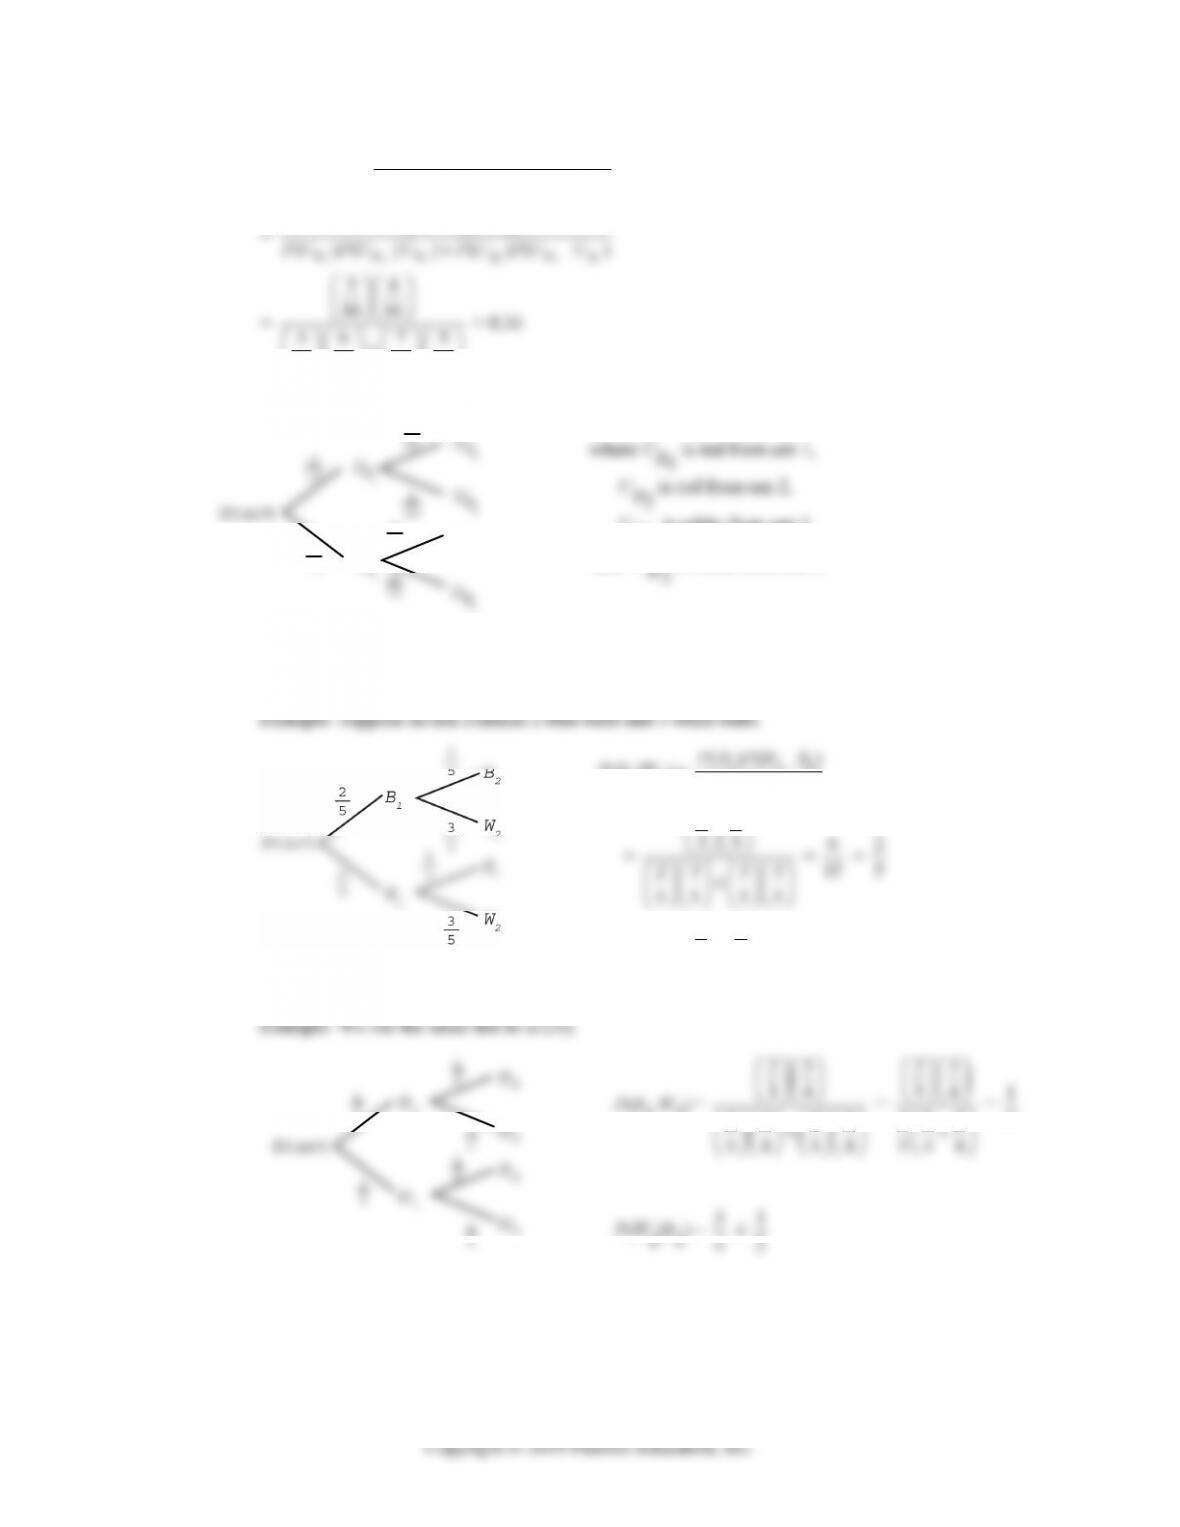
A tree diagram for Problems 46–60
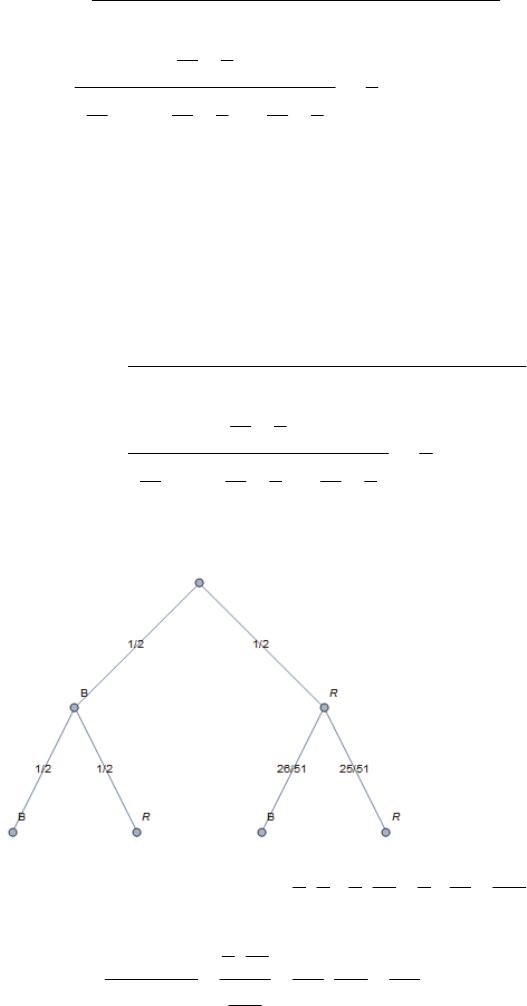
46. 21212
1 1 1 26 1 13 103
( ) ( ) ( ) 0.5049
22 251 4 51 204
PB PB B PR B
48. 12
12
() 26 204 52
251
( | ) 0.5049
PR B
PR B PB
8-24 CHAPTER 8: PROBABILITY
50. 12
12
11
() 1 204 51
22
( | ) 0.4951
PB B
PB B PB
52. By Bayes formula, 1
1
12
(|) .
()()
PU E PU E PU E
Since the sample space is equally likely,
()
nA
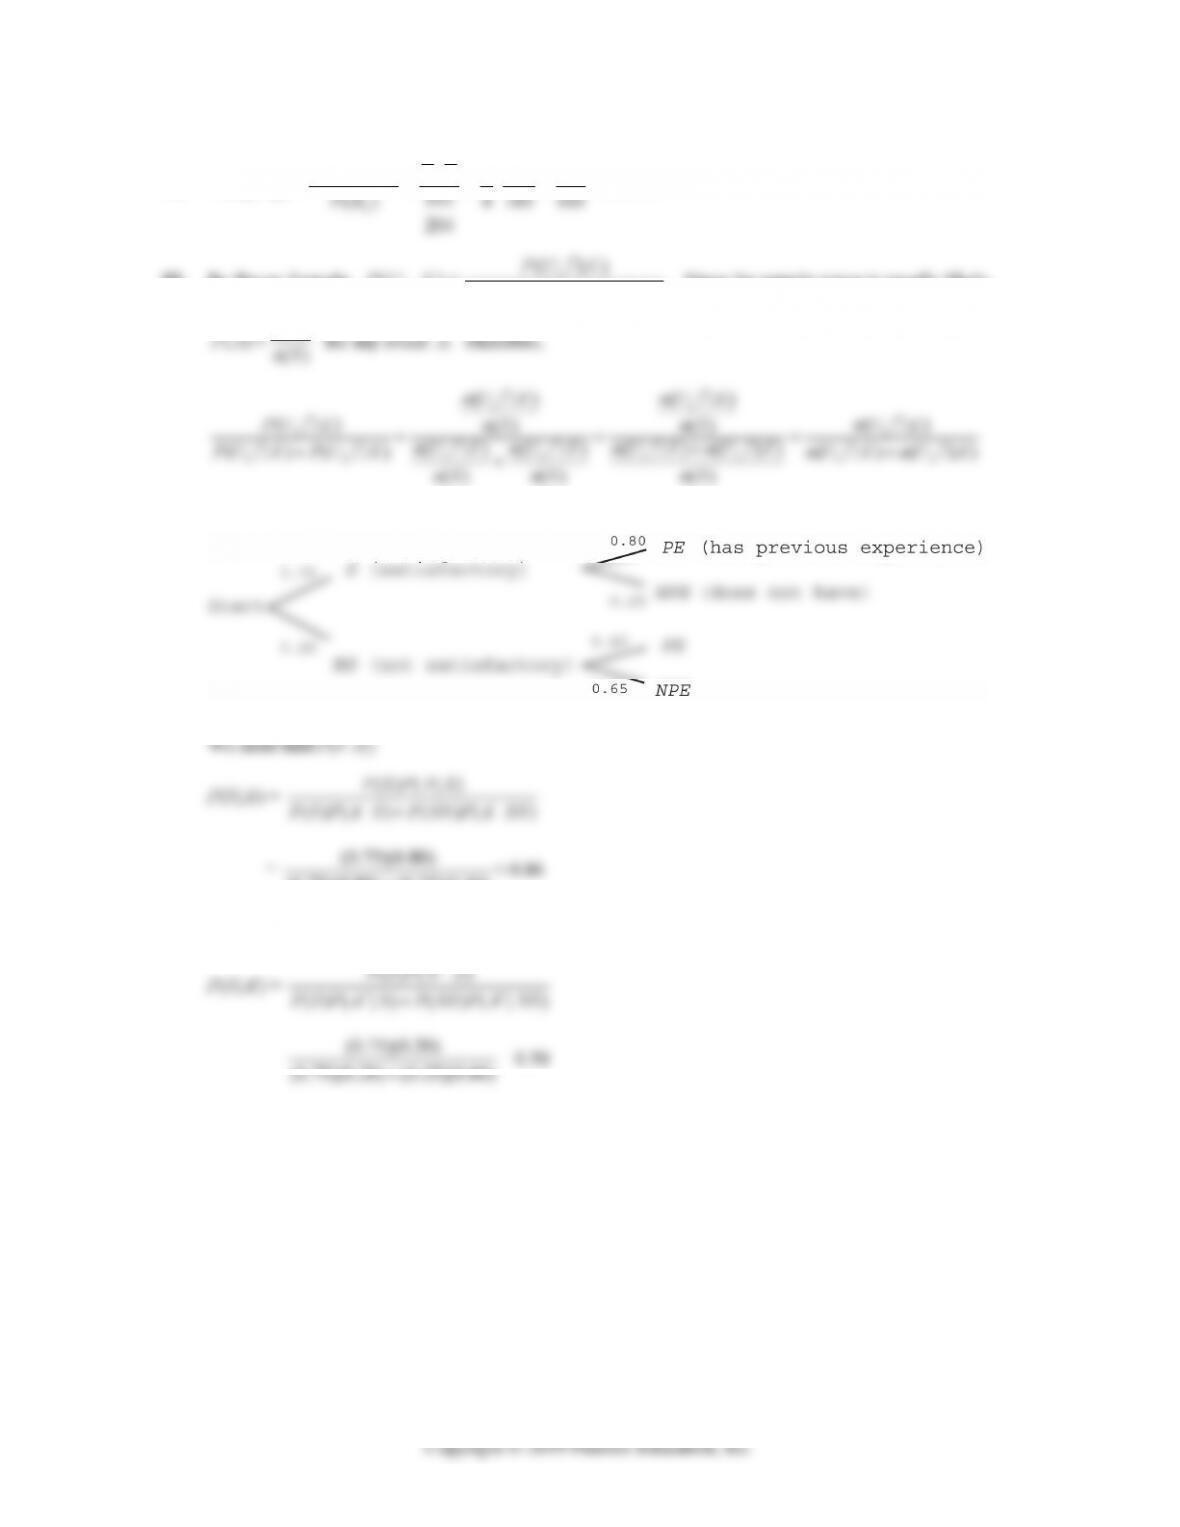
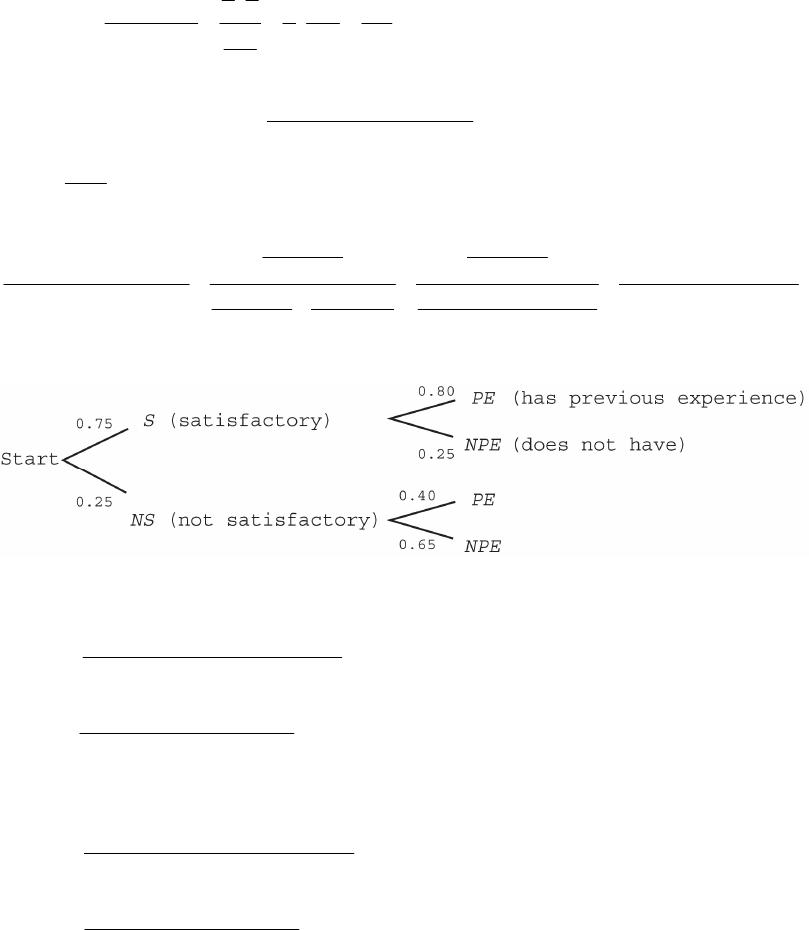
54. Consider the following tree diagram:
Let A = “the person hired has work experience”.
(0.75)(0.80) (0.25)(0.40)≈ 0.86
Now we want to compute P(S | A‘).

EXERCISE 8-4 8-25
56. Consider the following tree diagram:
0.20
R
NR
0.15
0.85
R
NR
0.95
R
NR
A
C
where R = “a flash drive is returned for service during warranty period”.
58. Consider the following tree diagram:
Start
0.5
NP
TP
TNP
0.92
0.08
0.88
TP
TNP
where TP means test shows pregnancy and TNP means test does not show pregnancy.
P(TP) = P(P)P(TP | P ) + P(NP)P(TP | NP)
60. Consider the following tree diagram:
0.03
T
T‘
H3
0.10
0.85
H3
0.08
H1 means the test shows the subject has tuberculosis;
H3 means the test indicates no tuberculosis.


8-26 CHAPTER 8: PROBABILITY
We are asked to compute P(T | H 1).
(0.08)(0.90) (0.92)(0.05)≈ 0.61
Finally,
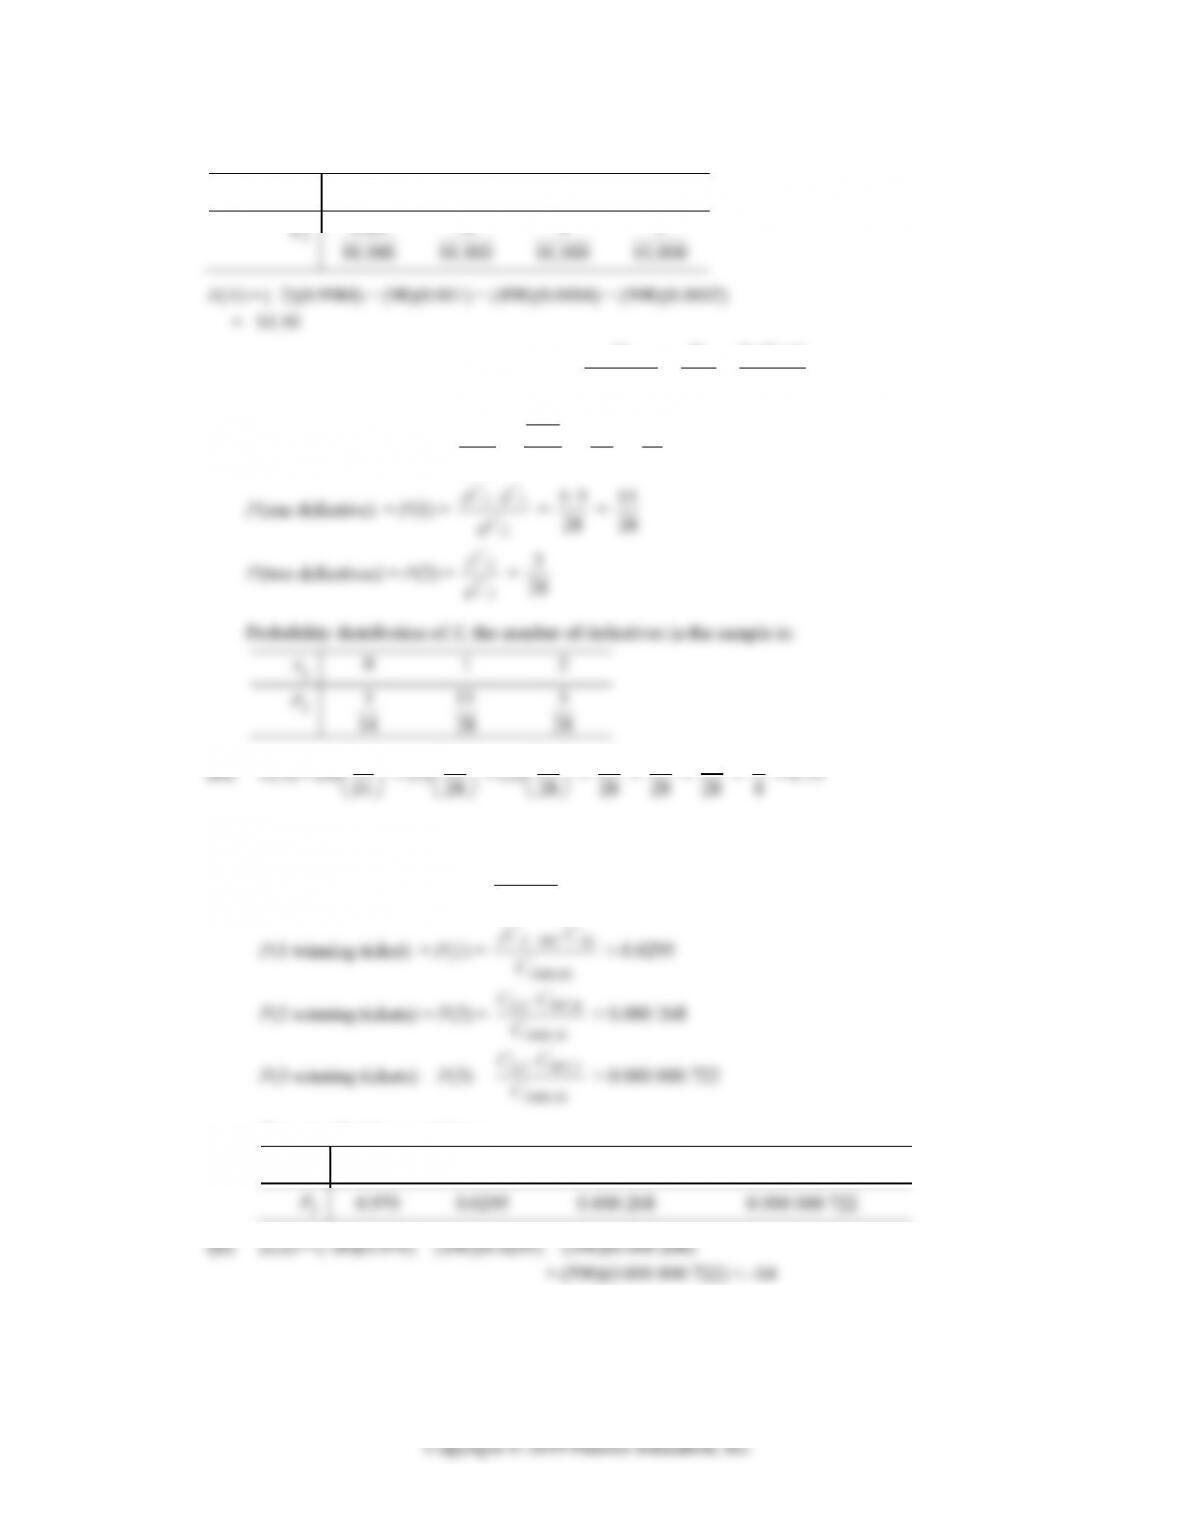
62. Consider the following tree diagram:
Start
0.45
0.30
P
P‘
P
P‘
0.20
P
P‘
D
R
I
0.35
where P means voted in favor of a park and recreation land proposal.
The question is P(R | P ) = ?, P(I | P ) = ?, P(D | P ) = ?
(0.45)(0.70) (0.35)(0.40) (0.20)(0.80) ≈ 0.23;
PIPP I
EXERCISE 8-5
2. Average = 78 64 97 60 86 83 468 78.
4. Average = 75 61 94 57 83 80 450 75.
66
EXERCISE 8-5 8-27
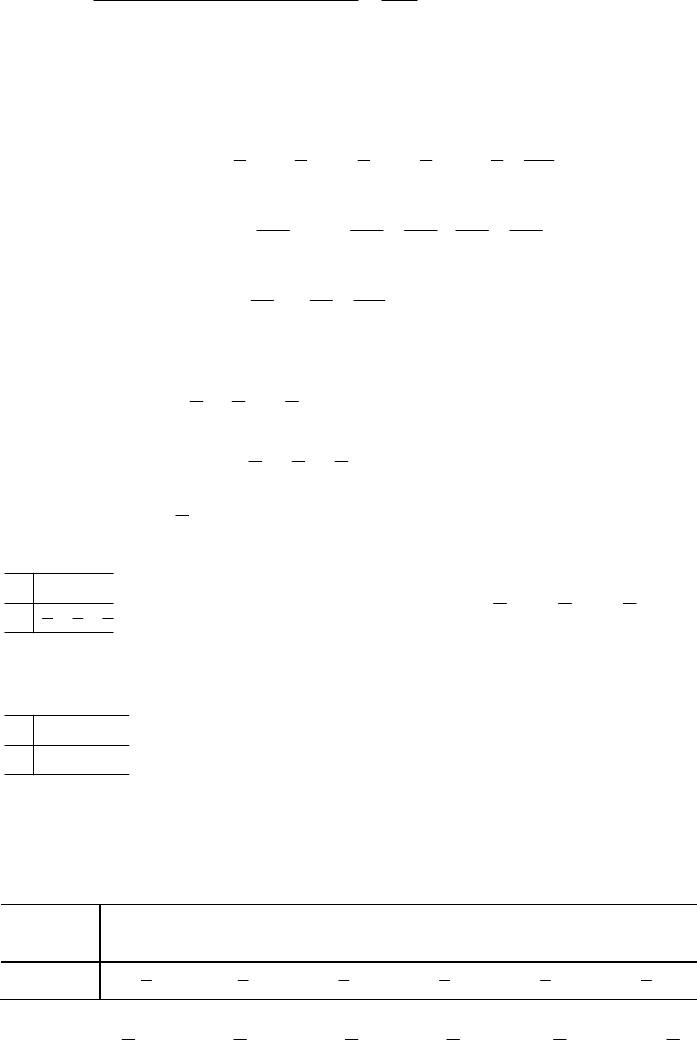
8. Expected value of X:
12. Expected value: 120 80 6 20 26
( ) 0.05 0.25 0.13;
200 200 200 200 200
EX $0.13
16. A family with two children may have 0, 1, or 2 boys.
P(0 boys) = P(GG) = 1
1
= 1
18. Assign a payoff of $1 to the event of observing a head and –$1 to the event of observing a tail. Thus, the
payoff table for X is:
11
x
20. The table shows a payoff or probability distribution for the game.
Net gain
xi –2.50 –1.50 –0.50 0.50 1.50 2.50
22. The probability distribution is:
1
4
1
2
1
4
N
umber of Heads Gain, Probability,
02
1
22
ii
x
p
x
x
then the game will be fair.
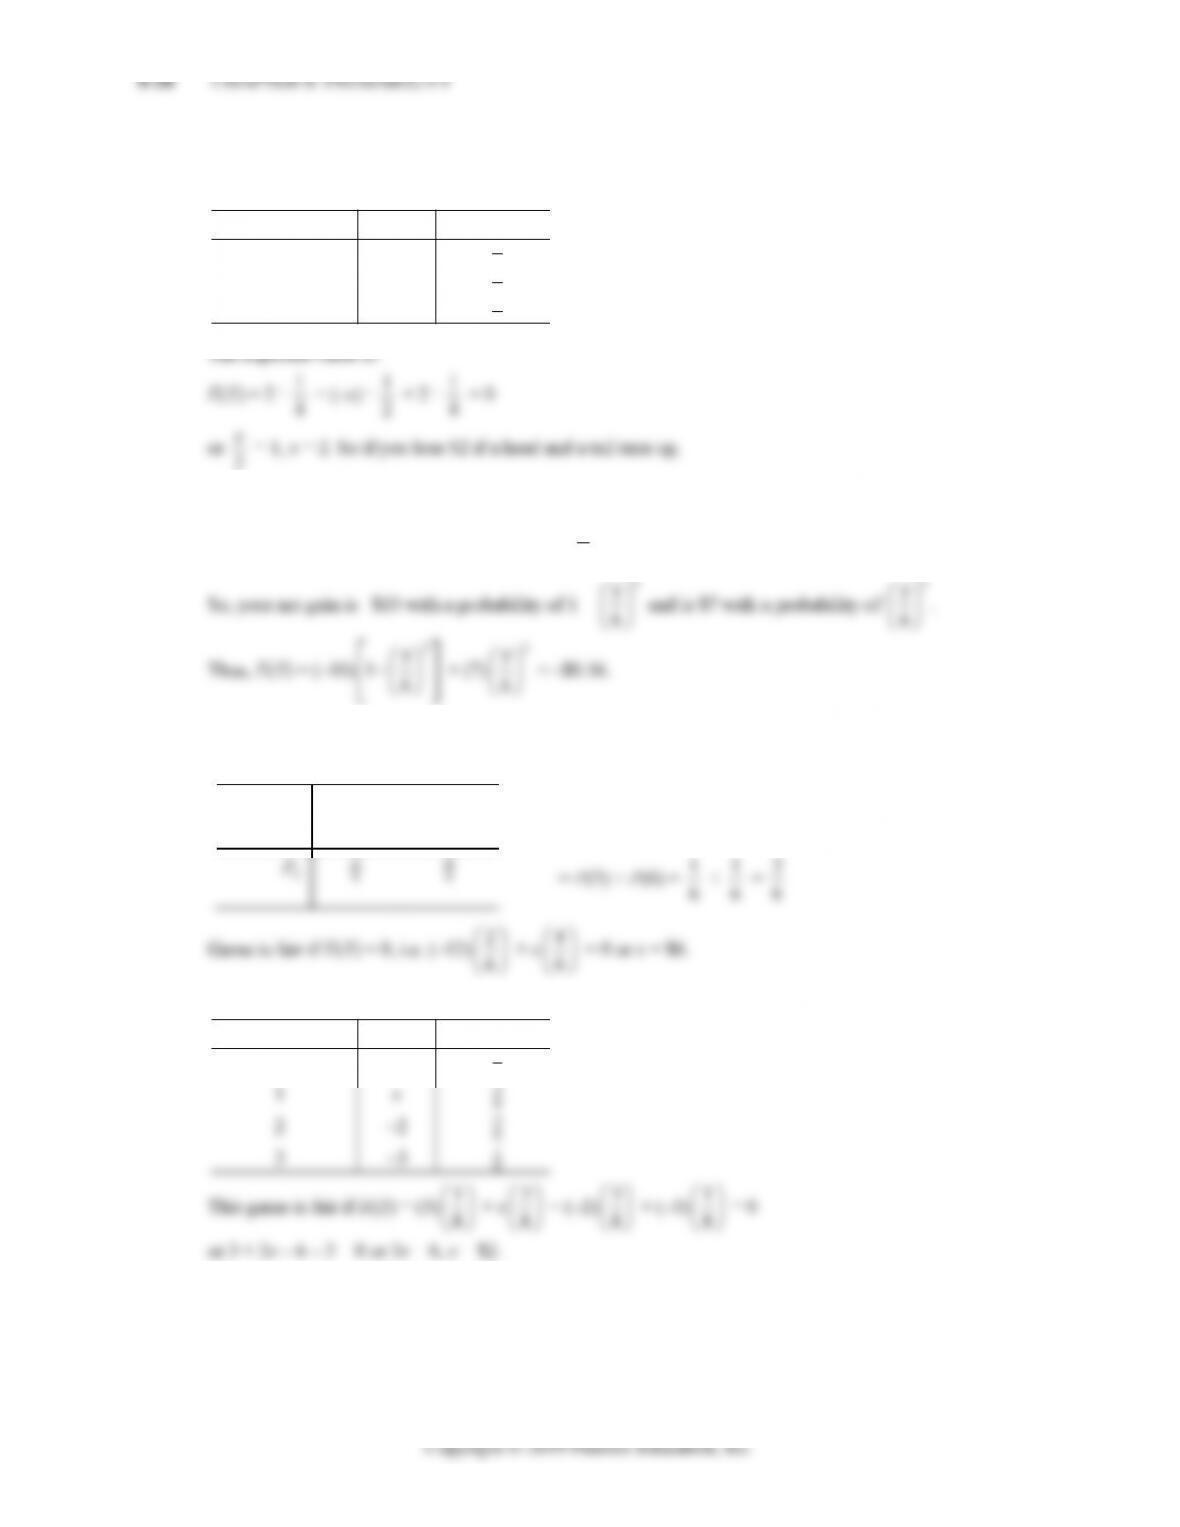
24. P(at least one 5) = 1 – P(no 5 in 3 rolls) = 1 –
3
5
6
26. Let x = amount you should win if a number not divisible by 3 turns up. Payoff table or probability
distribution for this game is:
Net gain
xi –12 x
P(die shows a number divisible by 3)
28. Probability distribution for this game is:
1
8
N
umber of Heads Gain, Probability,
03
ii
x
p
EXERCISE 8-5 8-29
30. Assign a payoff of –$4 to the event of drawing a non-diamond card and $10 to the event of drawing a
diamond card. Thus, the probability distribution for x, your net gain, is:
xi –$4 $10
32. Assign a payoff of –$4 to the event that the hand contains no diamonds and $10 to the event that the hand
contains at least one diamond. Thus, the probability distribution for x, your net gain, is:
xi –$4 $10
34. A1: E(X) = (500)(0.2) + (1,200)(0.4) + (1,200)(0.3) + (1,200)(0.1)
36. The payoff table or probability distribution for the net gain X is:
payoff table
xi $1 –$1
38. Let p = probability of winning. Then
–0.50 = E(X) = (18)(p) + (–2)(1 – p).
8-30 CHAPTER 8: PROBABILITY
40. Let X = net gain, then the probability distribution of x is:
Net gain xi –2 98 498 998
pi 9984
42. (A) Total number of outcomes = n(S) = 82
C = 8!
2!(8 2)!= 8!
2!6! = 876!
26!
= 28
P(zero defective) = P(0) = 52
82
C
C =
5!
2!3!
28 = 10
28 = 5
14
44. (A) The total number of outcomes n(s) = 1000 10
C
P(0 winning ticket) = P(0) = 997 10
1000 10
C
C ≈ 0.970
The payoff table is as follows:
xi –$10 $190 $390 $590
46. The simulated gain or loss depends on the results of the simulation; the expected loss is $21.05.

EXERCISE 8-5 8-31
48. Consider the following table:
Number of 01 23
Kings
0.7826 0.2042 0.0130 0.0002
0.7826 = $29.49
50. The payoff table is as follows:
xi –$199,925 $75
52. The payoff table for site A is as follows:
xi 30 million –3 million
pi 0.2 0.8
pi 0.11 0.89
54. The payoff table is:
xi
pi
0
2
0.25
0.25
E(number of W genes) = (0)(0.25) + (1)(0.50) + (2)(0.25) = 1
56. The payoff table is:
x
i $
–
2 $2 $5 $98 $49,998 $999,998 $399,999,998
CHAPTER 8 REVIEW
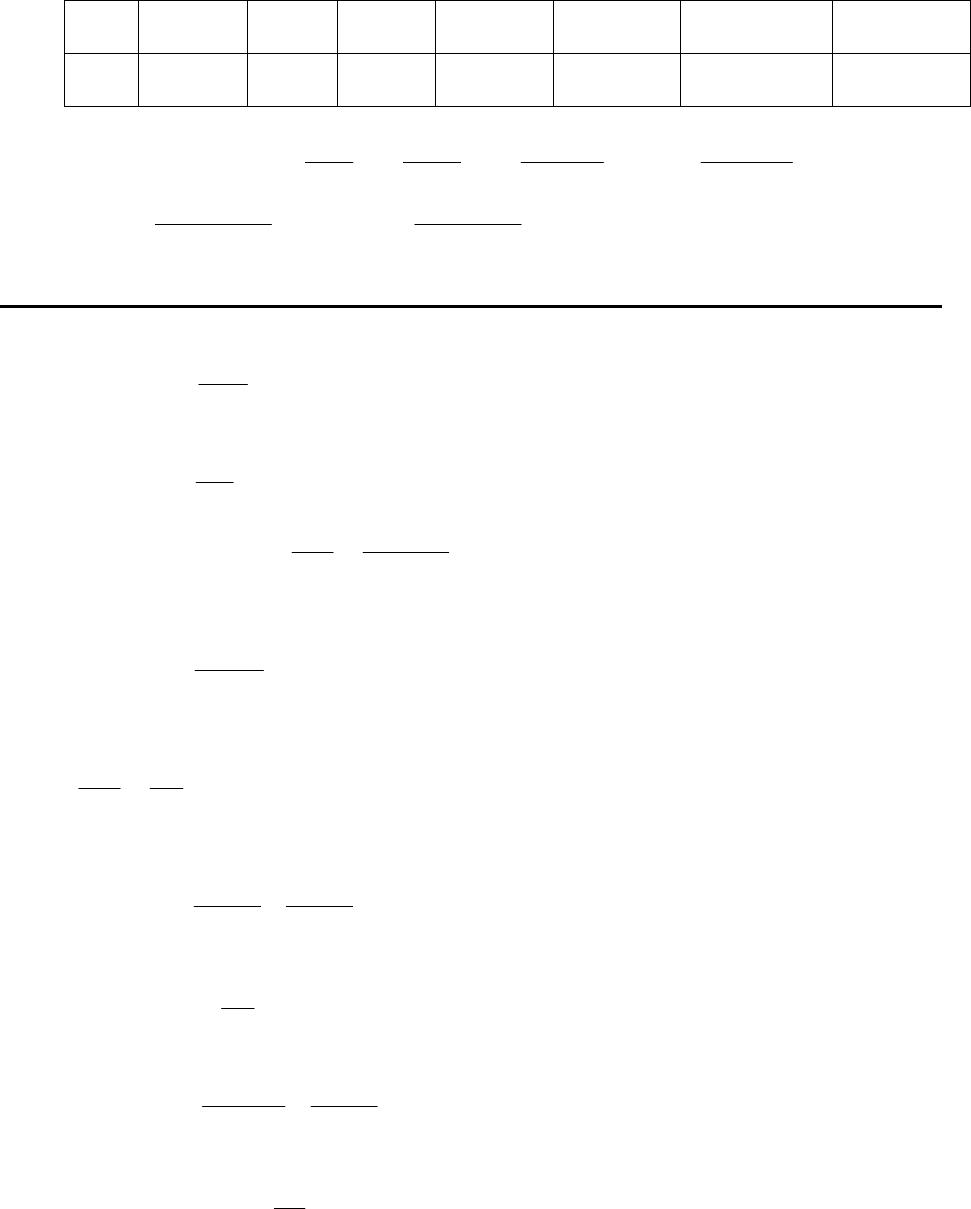
1. First, we calculate the number of 5-card combinations that can be dealt from 52 cards:
n(S) = 52 5
C = 52!
2. n(S) is computed by using the permutation formula:
15!
3. (A) The total number of ways of drawing 3 cards from 10 with order taken into account is given by:
(B) The total number of ways of drawing 3 cards from 10 without regard to order is given by:

f
E
5. The payoff table is as follows:
$2 $1 $0 $1 $2
i
x
6. P(A) = .3, P(B) = .4, P(A B) = .1
7. Since the spinner cannot land on R and G simultaneously, R G = . Thus,
P(R G) = P(R) + P(G) = .3 + .5 = .8
PE
8. If the odds for an event E are a to b, then P(E) = a
PR Z
= .03
PZ R
= .03
(8-3)
PT Z
= .02
17. Yes, because P(S X) = .10 = P(S)·P(X) = (.5)(.2). (8-3)
19. P(B|A) = .2 from the tree diagram. (8-3)
8-34 CHAPTER 8: PROBABILITY
22. P(A‘ B) = P(A‘)P(B|A) = (.6)(.3) = .18 (8-3)
23. P(B) = P(A B) + P(A’ B)
24. P(A|B) = ()
PA B
= ()( | )
PAPB A
PAPB A
(.4)(.2) (.6)(.3) (from the tree diagram)
25. P(A| B’) = ()
PA B
PAPB A
26. Let E = “born in June, July or August.”
(A) Empirical Probability:
P(E) = () 10 5
fE
27. No. The total number of 3-card hands is C52,3. The number of hands containing 3 red cards
28. Yes. The number of hands containing either 2 or 3 red cards equals the number of hands containing 2 or 3
black cards. (8-1)
29. S = {HH, HT, TH, TT}.
The probabilities for 2 “heads,” 1 “head,” and 0 “heads” are, respectively, 1