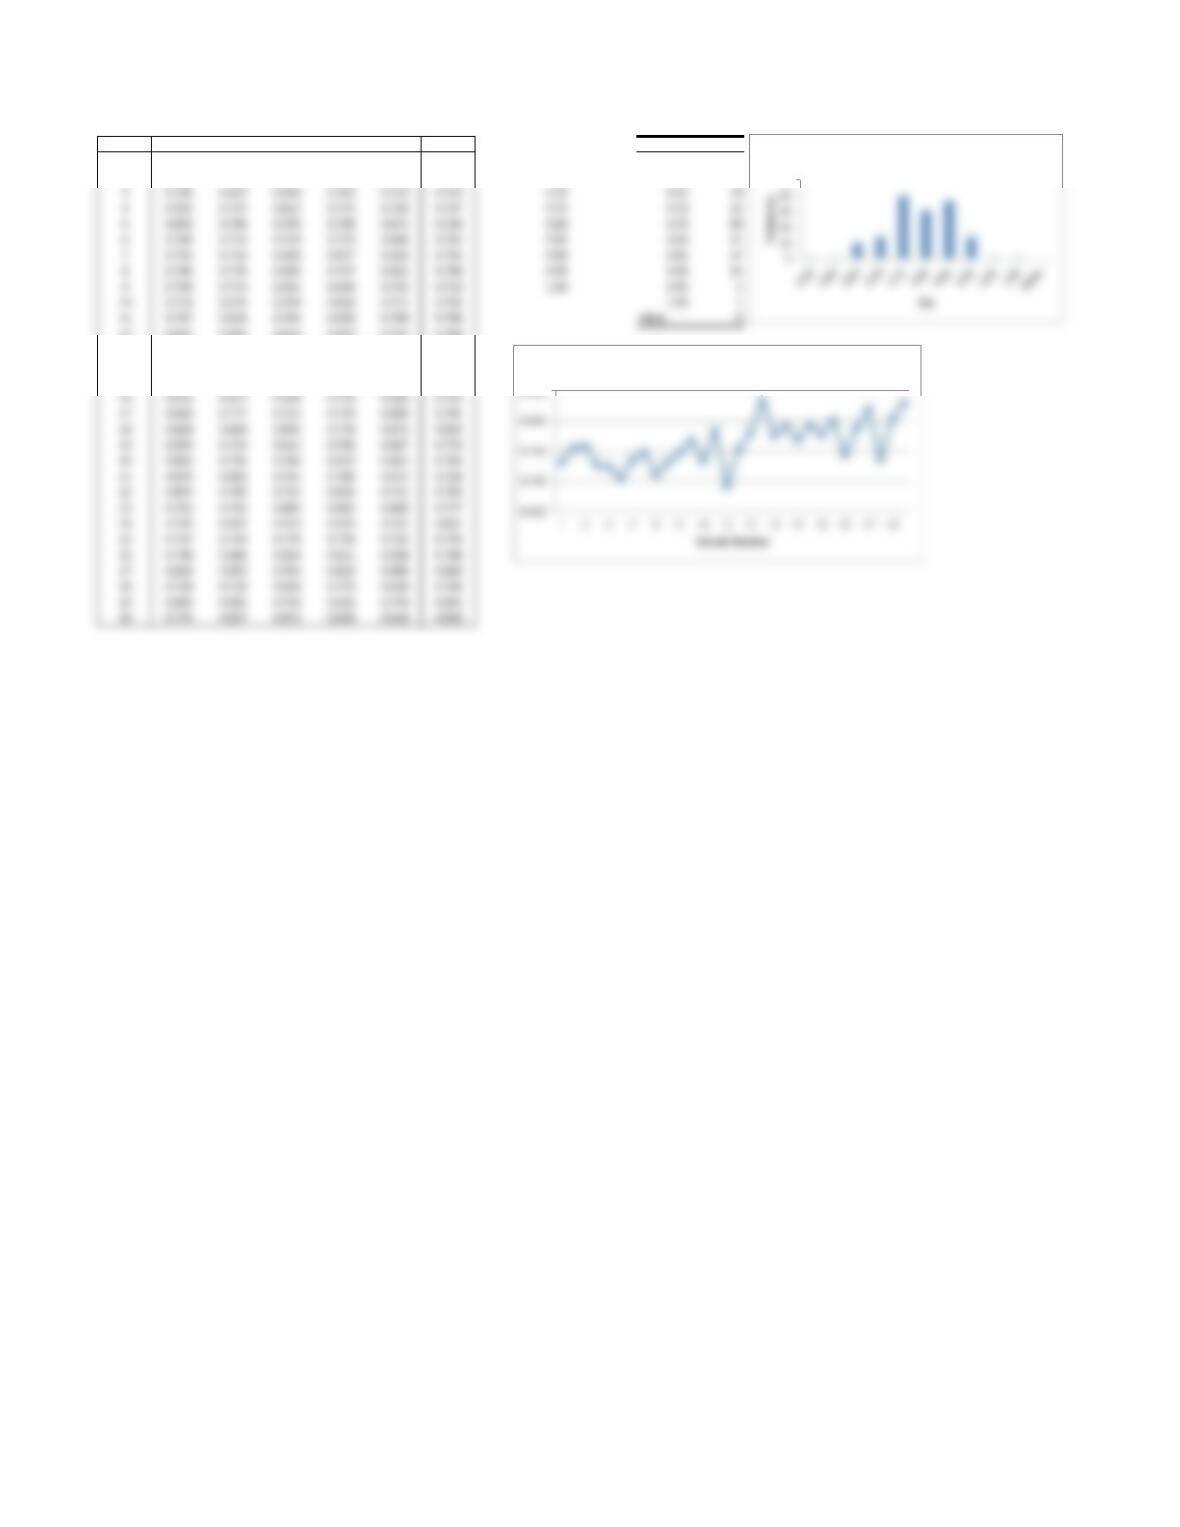
Quality Measurements
Bin
Sample 1 2 3 4 5 Mean 0.55 Bin Frequency
10.682 0.689 0.776 0.798 0.714 0.732 0.60 0.55 1
20.787 0.860 0.601 0.746 0.779 0.755 0.65 0.60 1
12 0.622 0.802 0.818 0.872 0.727 0.768
13 0.657 0.822 0.893 0.544 0.750 0.733
14 0.806 0.749 0.859 0.801 0.701 0.783
15 0.660 0.681 0.644 0.747 0.728 0.692
Observation
50
Histogram
0.850
Sample Means
Example 8.10

Example 8.11 Data These data may be copied and pasted into the Process Capability Excel template
10.650 10.800 10.500 10.800 10.700 10.800 10.750 10.650 10.850 10.650 10.800 10.650
10.750 10.850 10.800 10.800 10.700 10.700 10.850 10.700 10.800 10.550 10.700 10.850
10.750 10.700 10.650 10.800 10.650 10.650 10.750 10.650 10.500 10.800 10.750 10.800

Example 8.16 Data
These data may be copied and pasted into the Xbar&S Excel template
1 -2 0 1 -3 -6 -3 0 2 0 -3 -1 -1 -3 -1 -1 -2 0 0 1 1 -1 0 1 2
-3 -1 -1 1 -1 2 -1 -2 0 0 -2 2 -3 -2 -1 -2 2 4 -3 2 0 0 0 0 -2
4 0 0 0 0 0 0 -3 -1 -2 2 0 0 2 -1 -2 -1 0 3 1 2 2 -1 0 1

Example 8.17 Data These data may be copied and pasted into the X&MR Excel template
3.75
3.8
3.7
4
4
3.5
3
3.8
3.4
3.6
3.1
3.55
3.65
3.45
3.75
3.5
3.4
3.2
3.5
3.05
3.5
3.25
3.6
3.1

Example 8.18 Data These data may be copied and pasted into the p-chart Excel template
Sample
Value Size
3100
1100
0100
0100
4100
0100
2100
1100
3100
4100
1100
1100
2100
5100
3100
4100
1100
0100
1100
2100
5100
3100
6100
1100
Example 8.19 Data These data may be copied and pasted into the p-chart Excel template
Sample
Value Size
18 137
20 158
14 92
14 110
12 142
8140
13 179
5196
15 163
25 140
12 135
16 186
12 193
15 181
6122
11 86
22 187
6156
9117

Example 8.21 Data These data may be copied and pasted into the np-Chart Excel template
3
1
4
0
2
1
3
4
1
1
2
5
2
3
1
0
1
1
0
0
2
5
3
6
Example 8.22 Data These data may be copied and pasted into the c-Chart.xlsx template
2
3
0
1
3
5
3
1
2
2
0
1
0
2
4
1
2
0
3
2
1
0
0
3

Example 8.23 Data These data may be copied and pasted into the u-Chart Excel template
Sample
Number of Unit
Nonconformances
Size
892
15 69
686
480
270
11 73
13 89
6129
678
388
9101
892
270
954
583
5137
879
676
7147
480
13 85
5123
587
374
883
4103
660
7136