Chapter 8 – Measuring and Controlling Quality 61
Minimum
–1.310
Maximum
1.290
Sum
2.710
Count
250
Bin
Frequency
–1.35
0
–0.95
13
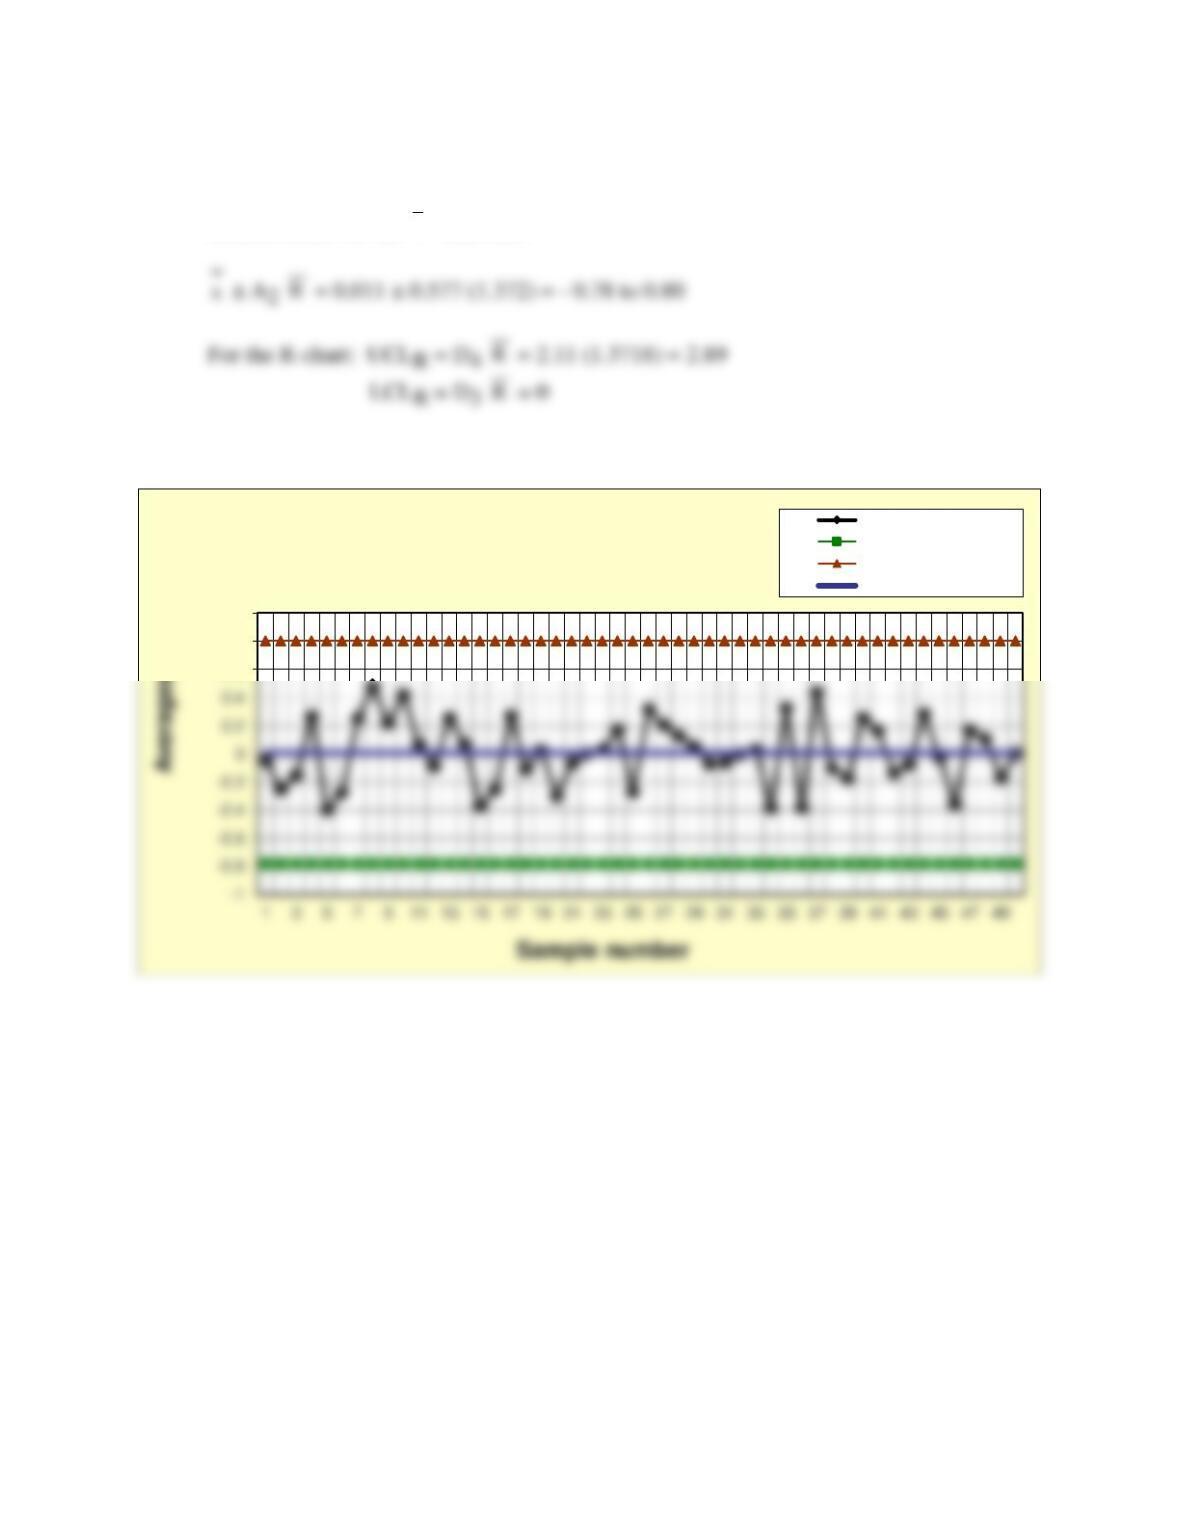
b) Analysts at Hermitage DNA Labs, LLC, calculated the following control limits. They
concluded from the x-bar and R charts that the process is probably in control, because the
points seem to be randomly distributed in both charts. See spreadsheet Prob08-28XR.xlsx
in the Instructor materials for more details.
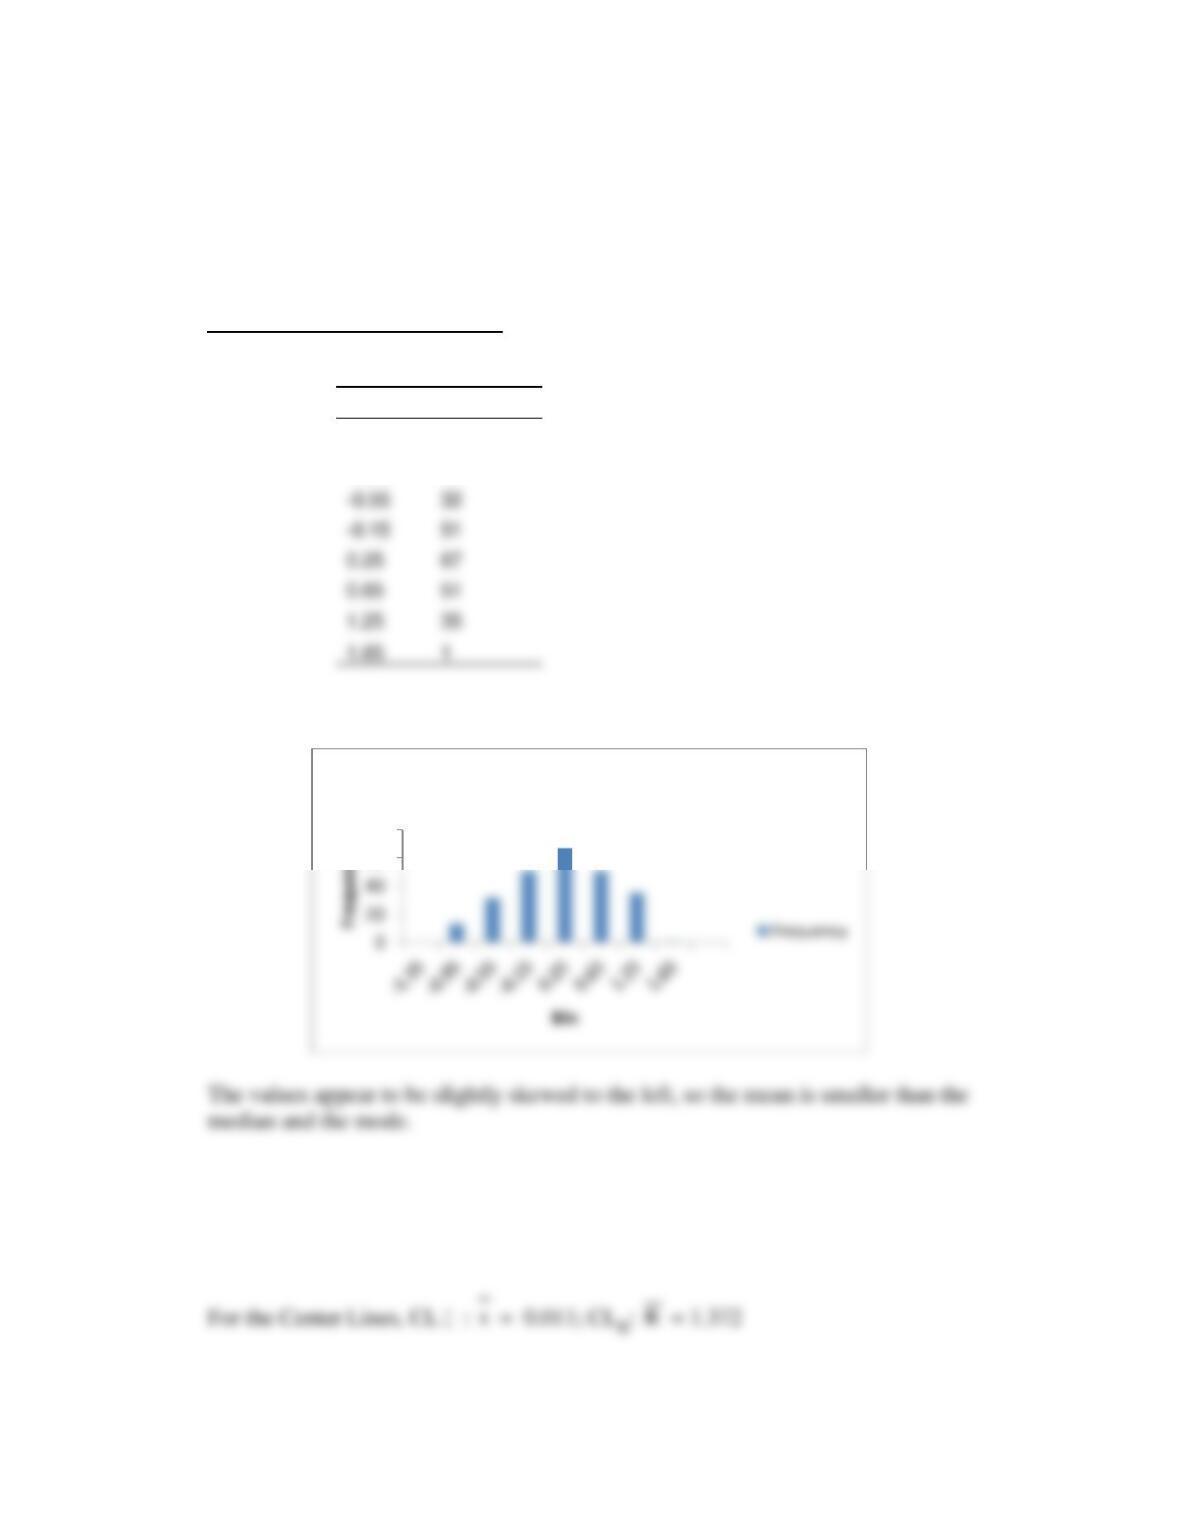
60
80
Histogram
–0.55
32
–0.15
51
0.25
67
0.65
51
1.25
35
1.65
1
Chapter 8 – Measuring and Controlling Quality 62
Control limits for the
x
– chart are:
0.6
0.8
1
Prob. 8-28 X-bar Chart
Averages
Lower control limit
Upper control limit
Center line
Chapter 8 – Measuring and Controlling Quality 63
29. The data for 30 samples of 3 items each, from the study at Hawkeye Magnetronics (from
Prob. 8-24, above) was further analyzed in an effort to use it for process control.
a. Compute the mean and range of each sample, calculate the control limits, and plot
them on
x
and R control charts.
b. Does the process appear to be in statistical control? Why or why not?
Answer
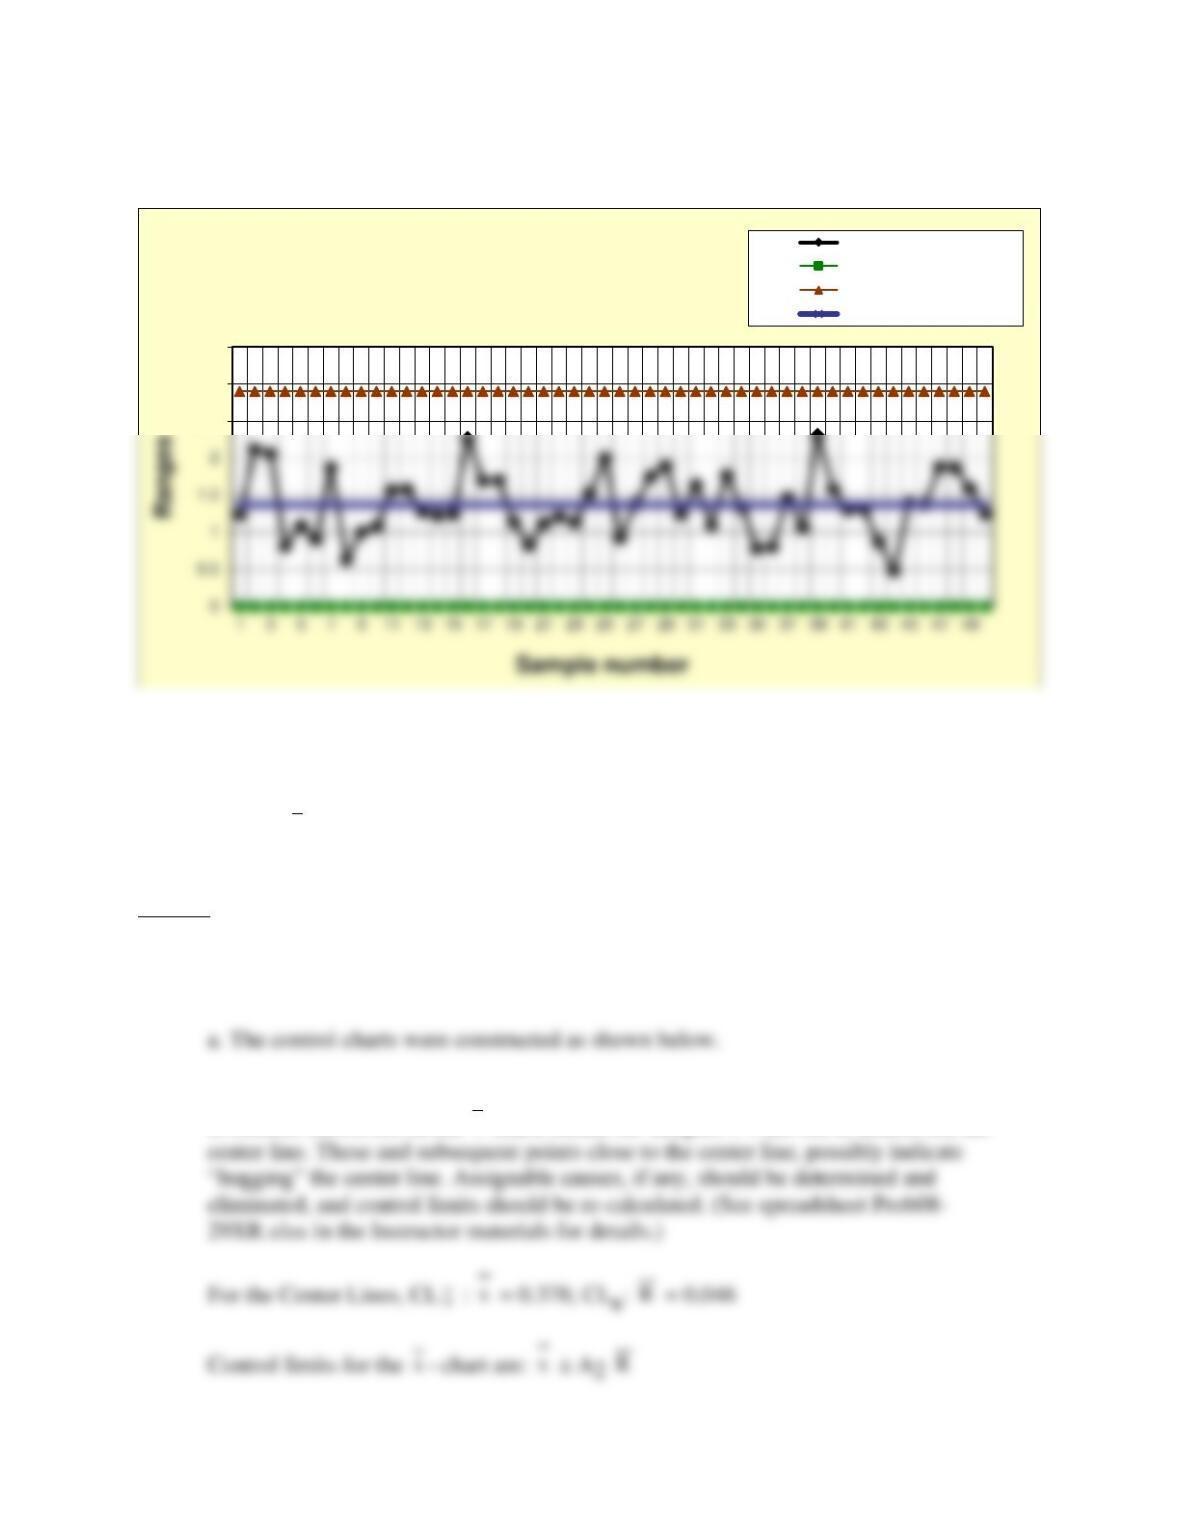
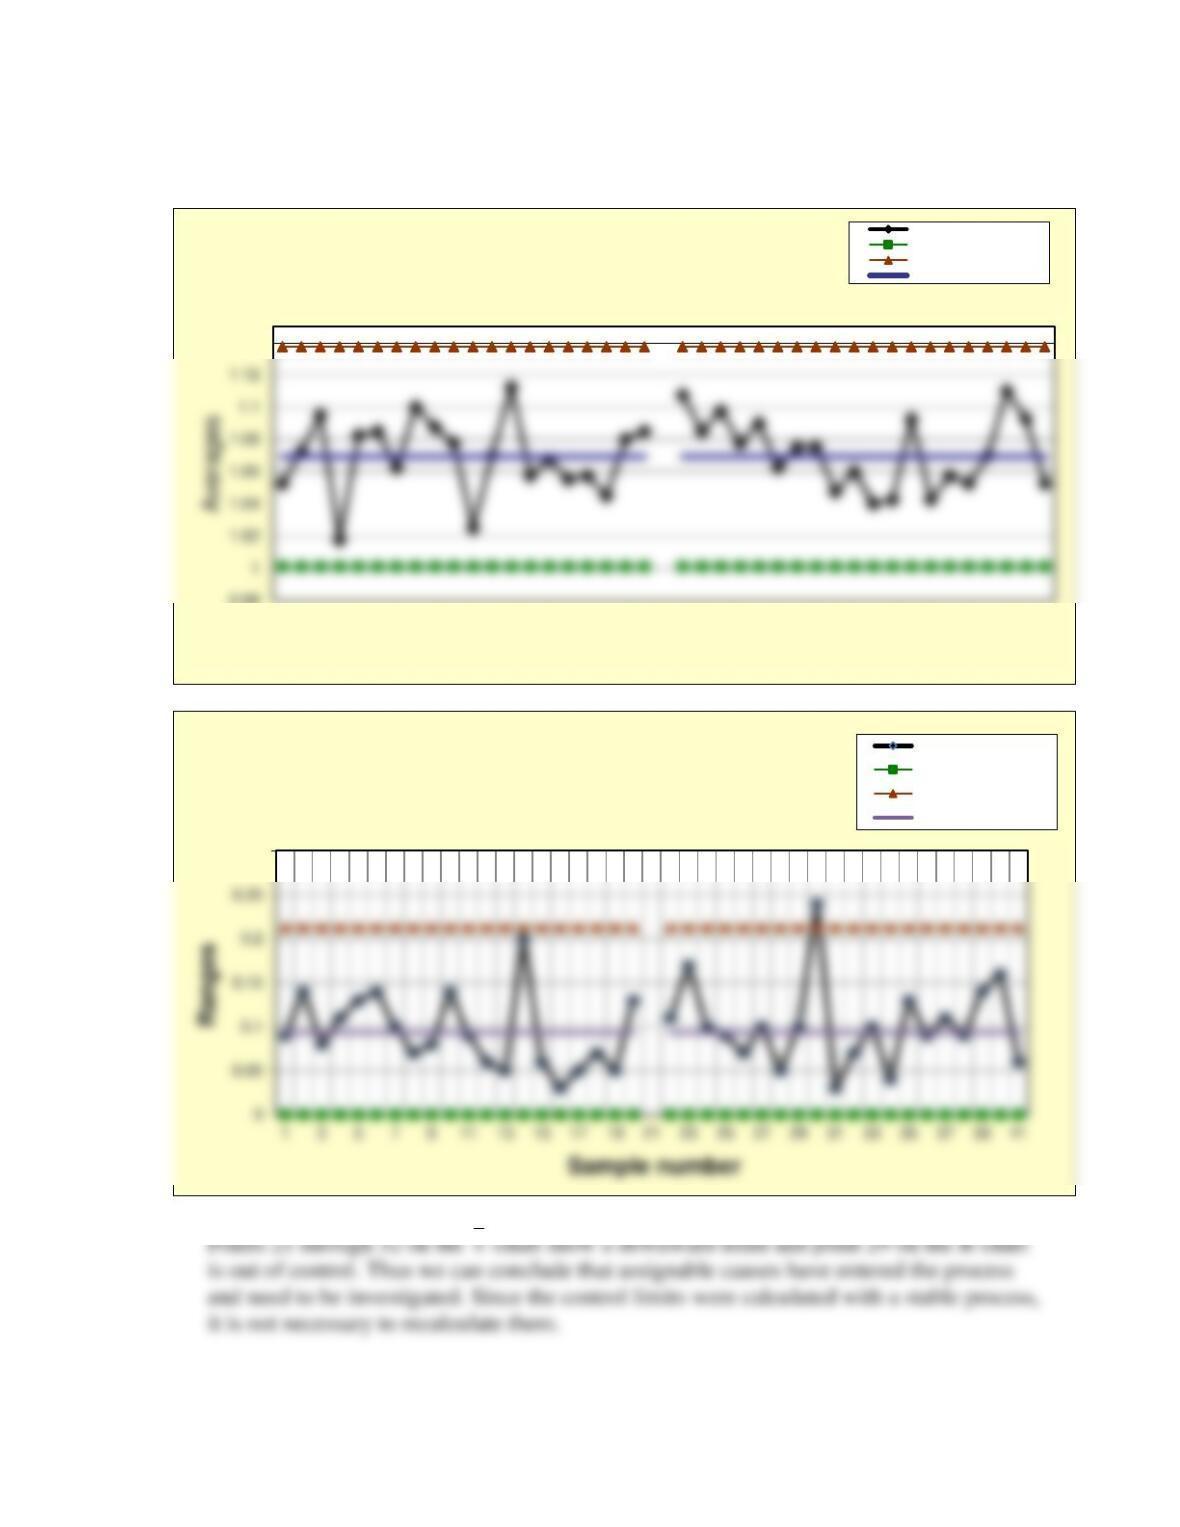
29. Results from 30 samples of 3 for Hawkeye Magnetronic’s induction readings were
calculated.
b. The induction readings on the control charts do not clearly show that the process is out
of control. However, on the
x
chart, means for samples 1-4 are on, or almost on, the
2.5
3
3.5
Prob. 8-28 R-Chart
Ranges
Lower control limit
Upper control limit
Center line
Chapter 8 – Measuring and Controlling Quality 64
For the R-chart:
0.42
0.44
1 3 5 7 9 11 13 15 17 19 21 23 25 27 29 31 33 35 37 39 41 43 45 47 49
Sample number
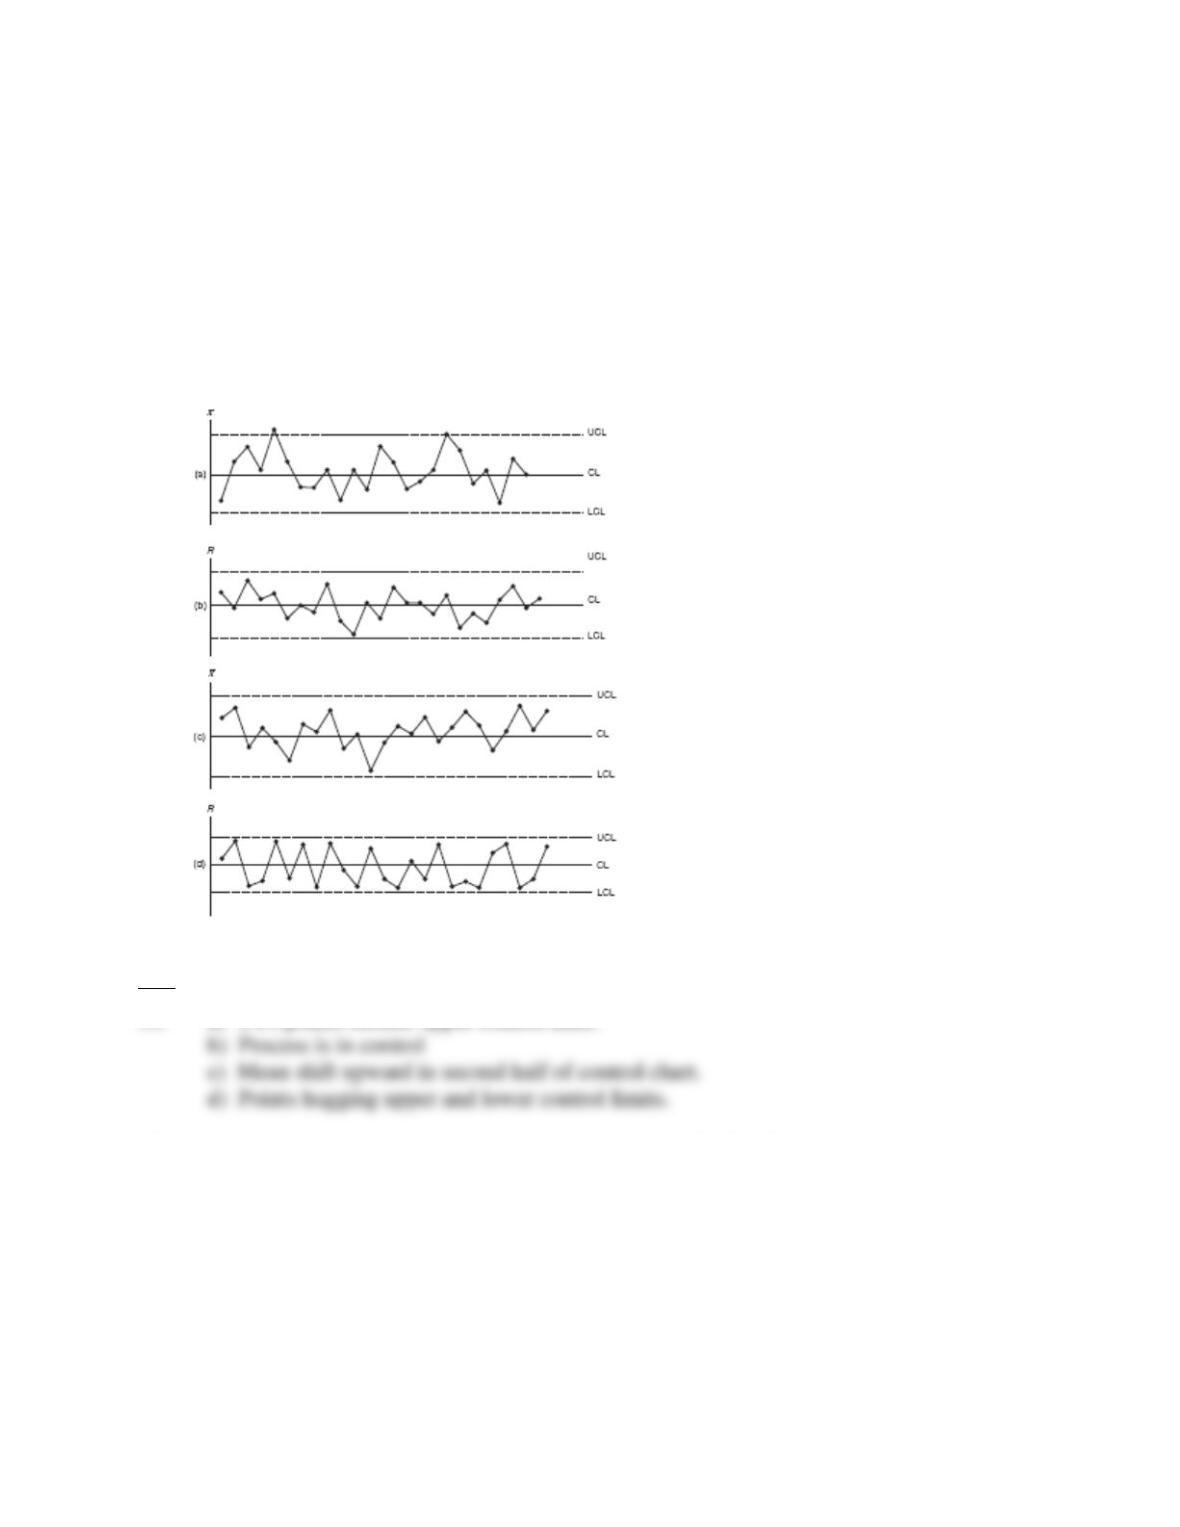
Prob. 8-29 X-bar Chart
Averages
Lower control limit
Upper control limit
Center line
Chapter 8 – Measuring and Controlling Quality 65
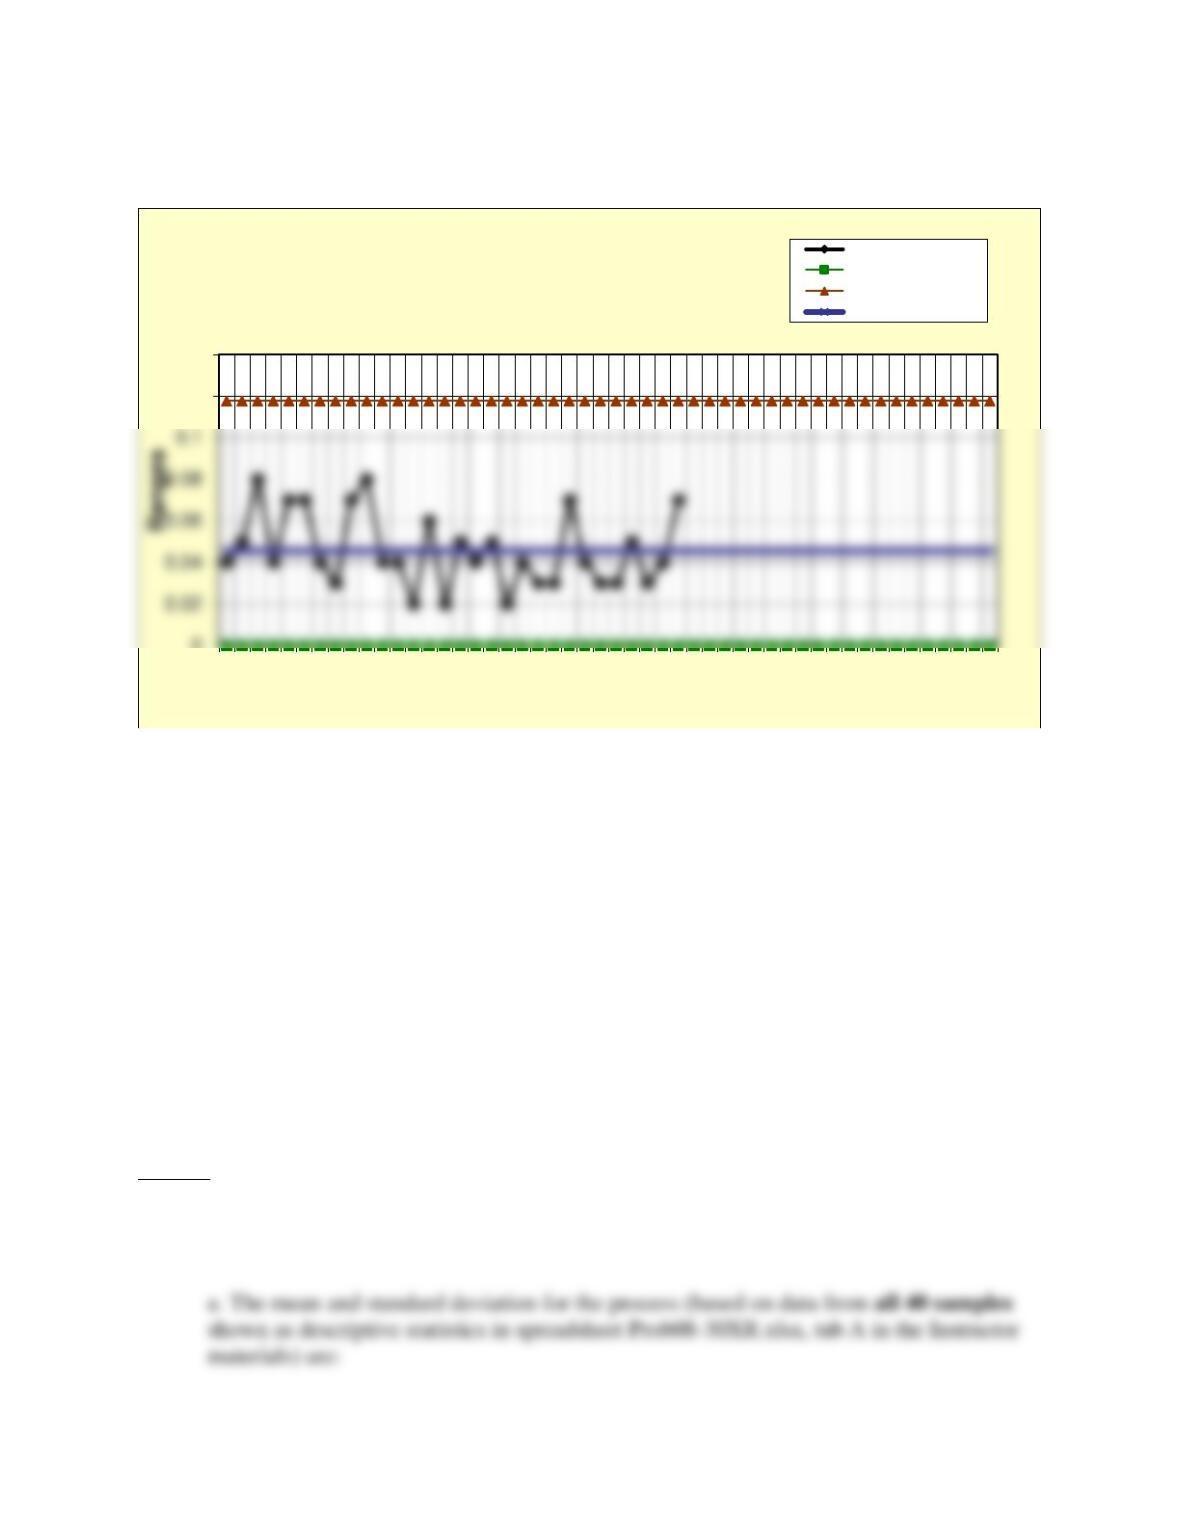
30. The data in worksheet Prob.8-30 in the C08Data.xlsx file represent processing time
values for 40 samples of size 4 that were taken from Rapid Check Kiters, Inc.’s check
processing firm over a 20-hour period.
a. Compute the mean and standard deviation of all 40 samples for the sample data.
b. Calculate the control limits and construct the 𝑥̅ and R-charts, using the first 20
samples. Is the process under control at that point?
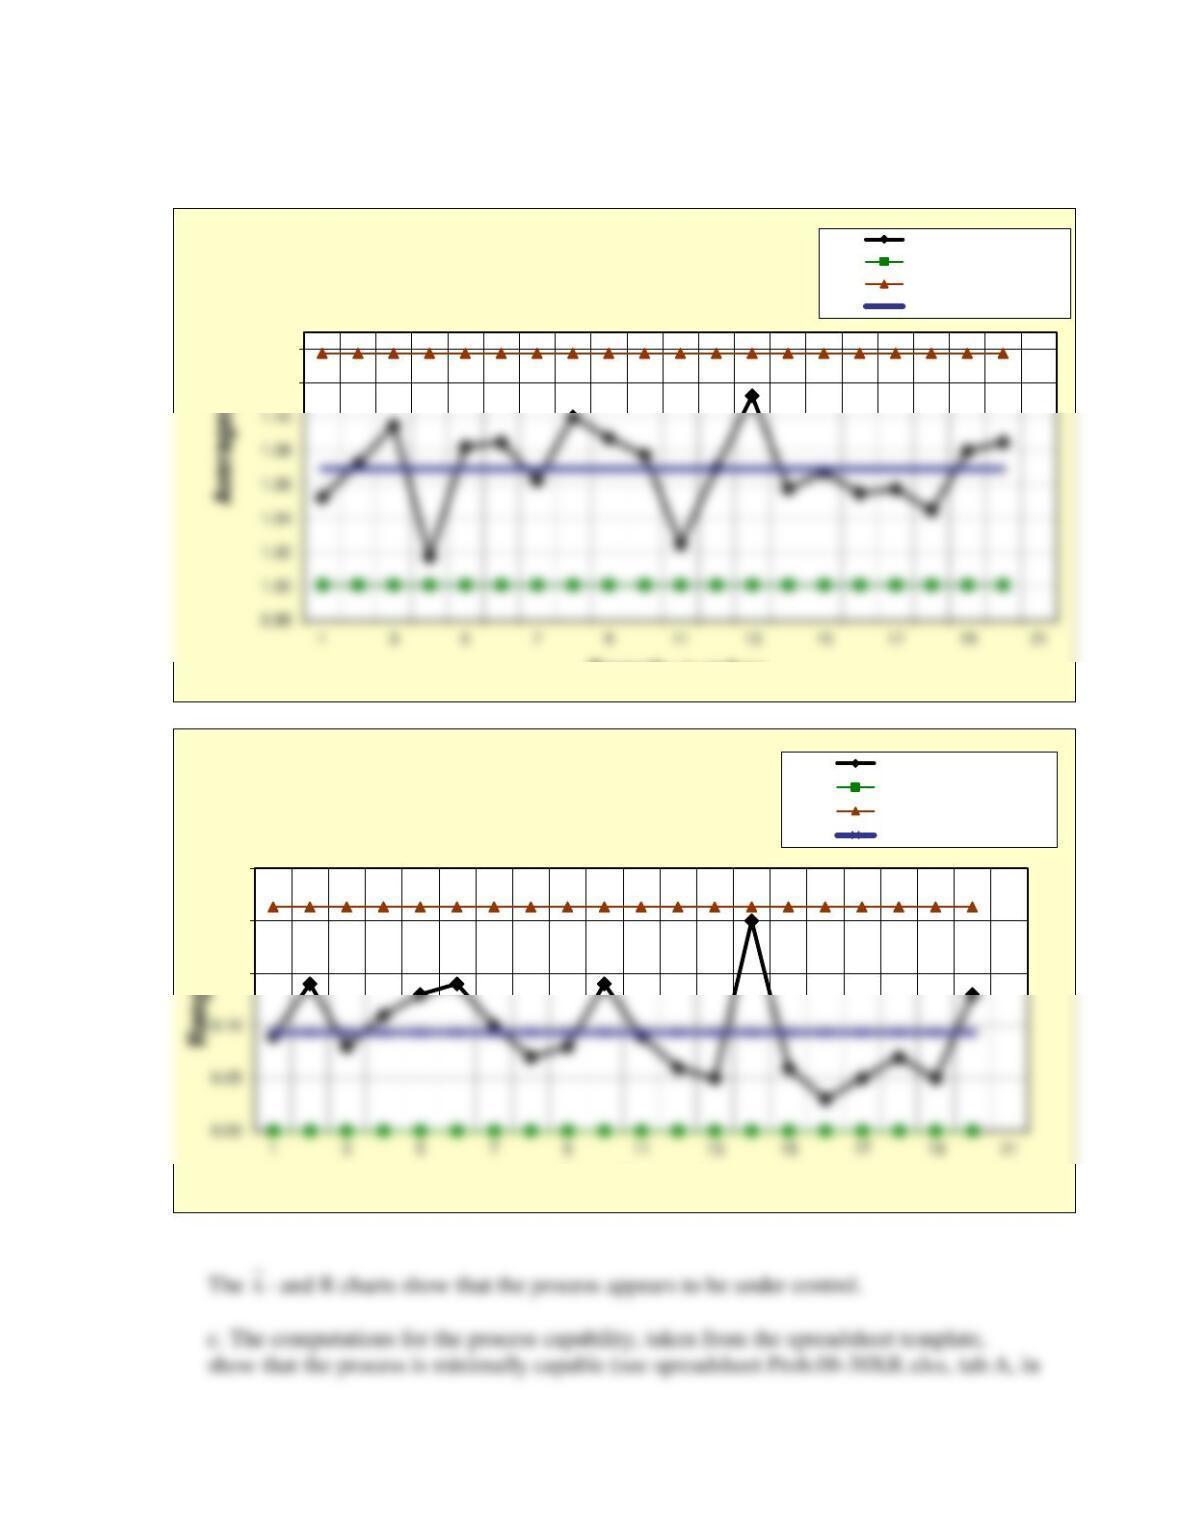
c. Specifications for the process are 1.065 ± 0.14. If the process is under control, calculate
the capability indexes, Cpu, Cpl, Cp, and Cpk using the part of the 𝑥̅ and R-charts Excel
template that calculates the process capability. What do the indexes indicate?
d. After calculating the control limits, the last 20 samples were collected. When plotted
using the control limits calculated earlier, does the process appear to be in statistical
control? Why or why not? What should be done if it is not under control?
Answer
30. The data in worksheet Prob. 8-30 list processing time values for 40 samples of size 4 that
were taken from Rapid Check Kiters, Inc.’s were analyzed.
0
0.12
0.14
1 3 5 7 9 11 13 15 17 19 21 23 25 27 29 31 33 35 37 39 41 43 45 47 49
Sample number
Prob 8-29 R-Chart
Ranges
Lower control limit
Upper control limit
Center line
Chapter 8 – Measuring and Controlling Quality 66
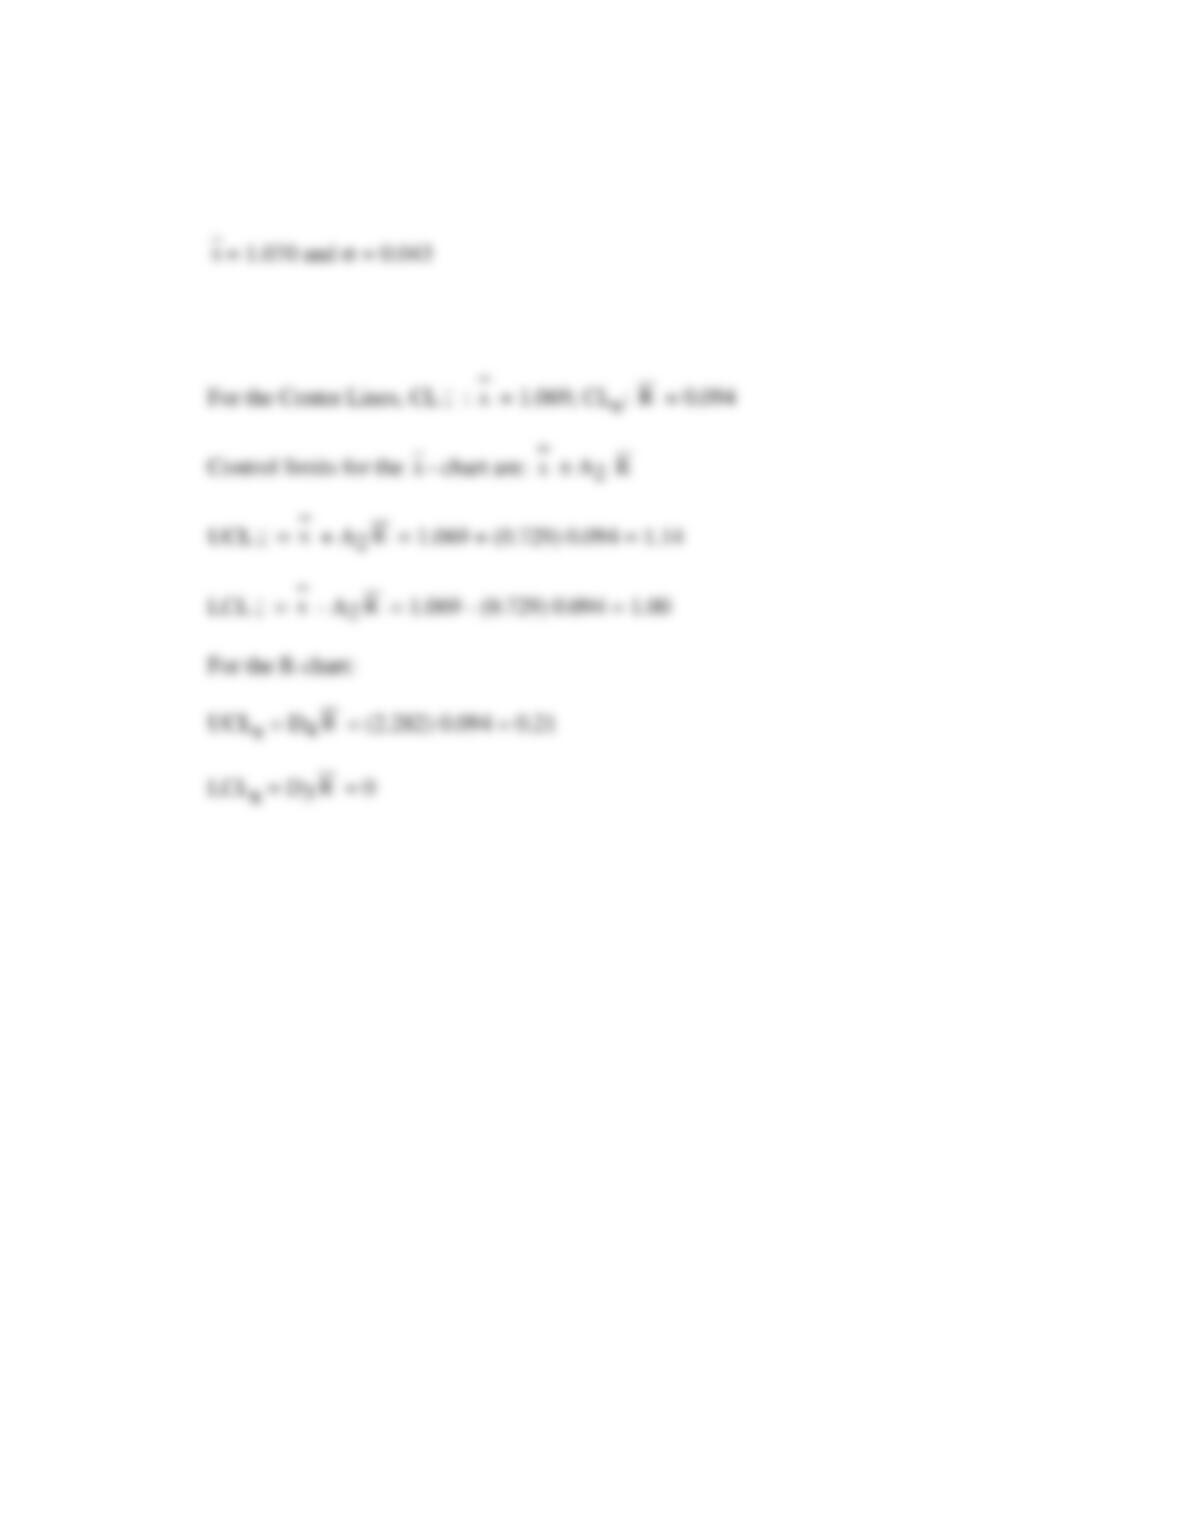
b. The control limits (based on the first 20 samples – (see spreadsheet Prob08-
30XR.xlsx, tab A, in the Instructor materials for details) are:
Chapter 8 – Measuring and Controlling Quality 67
1.12
1.14
Sample number
Prob. 8-30A X-bar Chart
Averages
Lower control limit
Upper control limit
Center line
0.15
0.20
0.25
Sample number
Prob. 8-30 A R-Chart
Ranges
Lower control limit
Upper control limit
Center line
Chapter 8 – Measuring and Controlling Quality 68
d. After calculating the control limits, the last 20 samples were plotted using the same
Chapter 8 – Measuring and Controlling Quality 69
0.98
1.14
1 3 5 7 9 11 13 15 17 19 21 23 25 27 29 31 33 35 37 39 41
Sample Number
Prob. 8-30B X-bar Chart
Averages
Lower control limit
Upper control limit
Center line
0.3
Prob. 8-30B R-Chart
Ranges
Lower control limit
Upper control limit
Center line
Chapter 8 – Measuring and Controlling Quality 70
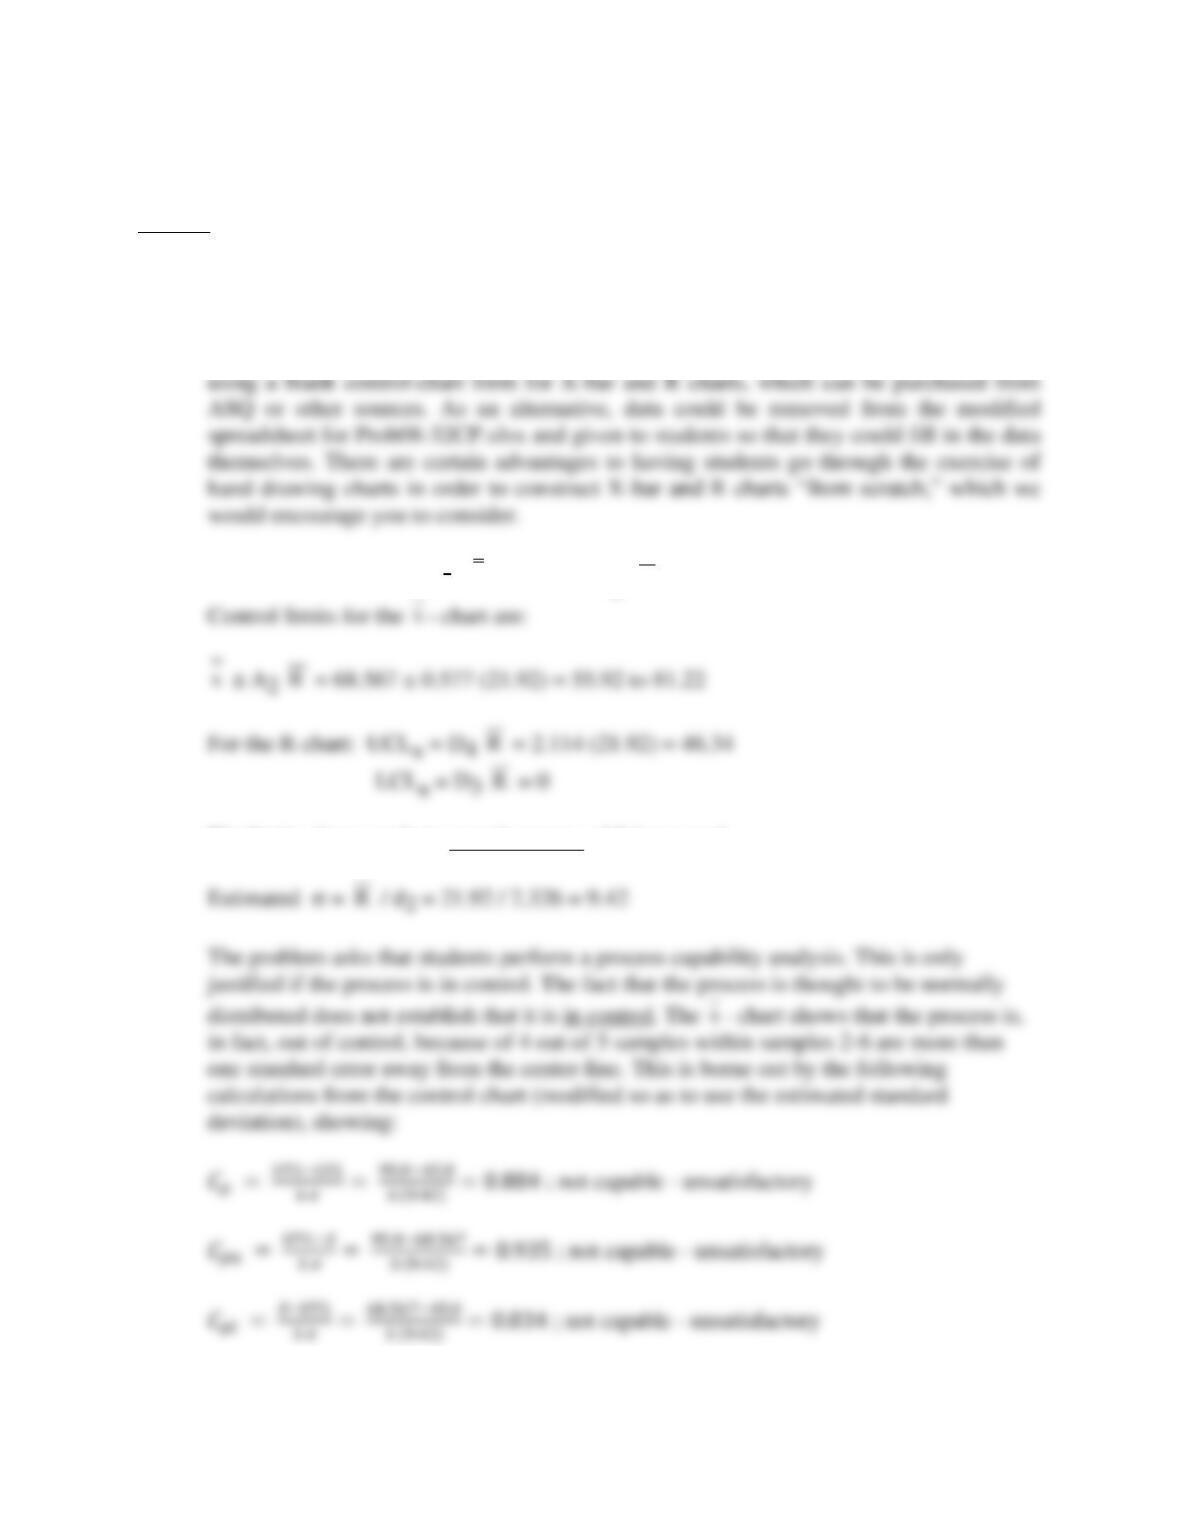
31. For each of the following control charts, assume that the process has been operating in
statistical control for some time. What conclusions should the operators reach at this
point?
Ans
31. a) Two points outside upper control limit.
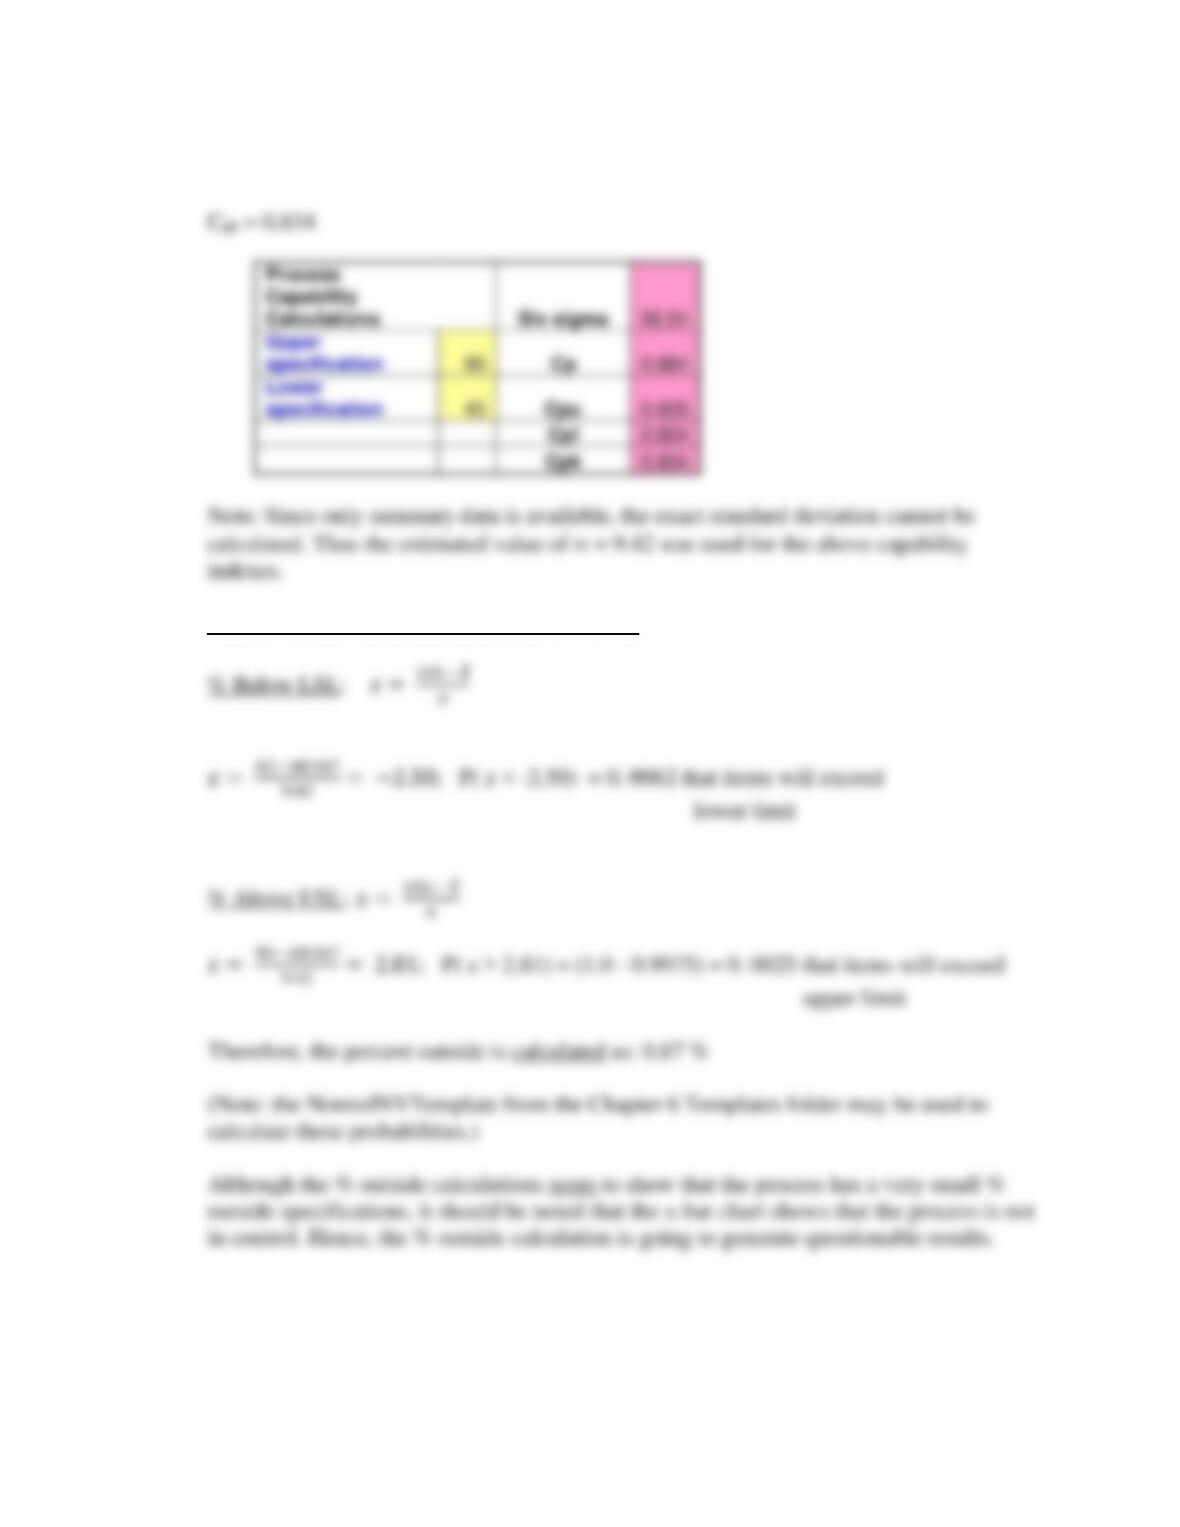
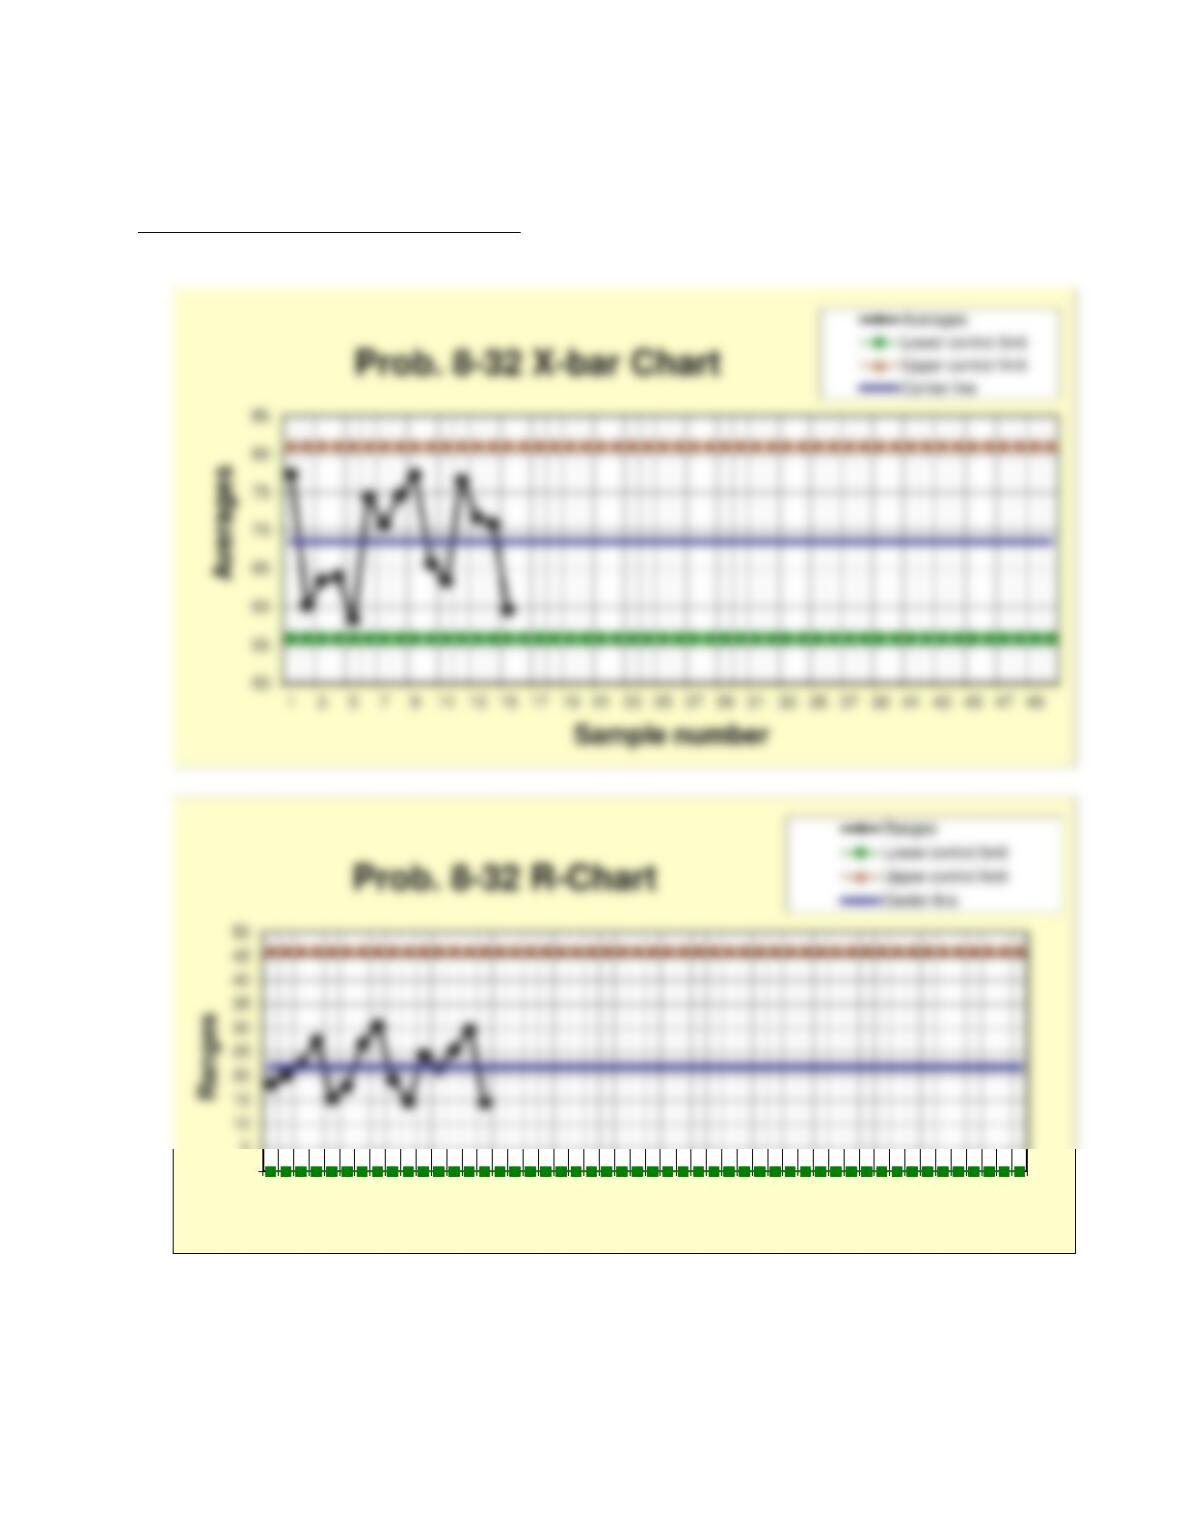
32. PCDrives has a manufacturing process that is normally distributed and has the sample
means and ranges for 15 samples of size 5, found in the worksheet Prob. 8-32 in the
C08Data.xlsx file on the Student Companion Site for this chapter. Note that only sample
statistics have been given, instead of the raw data from the samples. Determine process
capability indexes by estimating the standard deviation using formula (8.34). If
specifications are determined to be 70 ± 25, what percentage will be out of specification?
Chapter 8 – Measuring and Controlling Quality 71
Answer
32. (See spreadsheet Prob08-32CP.xlsx in the Instructor materials for details.)
NOTE: Since only summary data (sample means and ranges) are provided in the
C08Data.xlsx spreadsheet, student will have to “hand–draw” the control chart, perhaps by
For the Center Lines, CL
x
:
x
= 68.567; CLR:
R
= 21.92
R
The limits above apply to sample groups of 5 items each.
Chapter 8 – Measuring and Controlling Quality 72
Percent outside Specification Limits (45 to 95)
Chapter 8 – Measuring and Controlling Quality 73
Charts showing out-of-control conditions
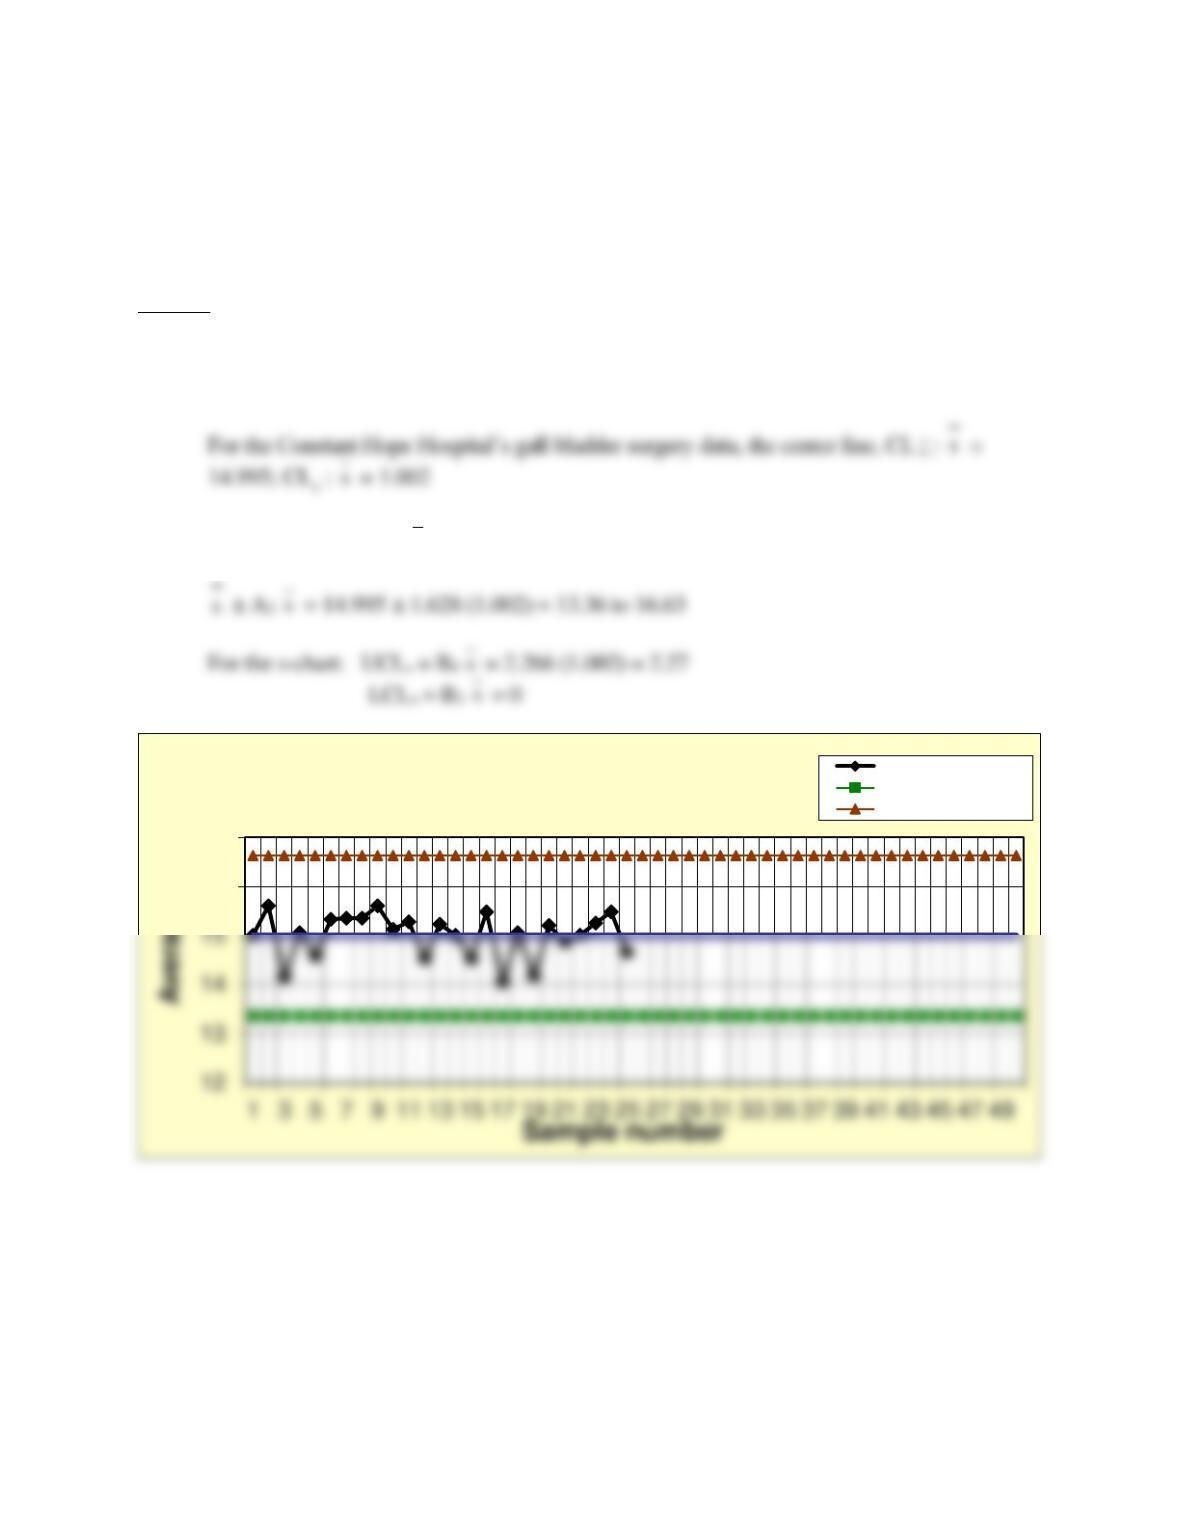
33. Constant Hope Hospital wants to set up a control chart for the time required to perform a
critical step in gall bladder surgery. Use the data, consisting of 25 samples of size 4 found
in the worksheet Prob. 8-33 in the C08Data.xlsx file to construct 𝑥̅ and s-charts. What
0
5
1 3 5 7 9 11 13 15 17 19 21 23 25 27 29 31 33 35 37 39 41 43 45 47 49
Sample number
Chapter 8 – Measuring and Controlling Quality 74
conclusions do you reach concerning the state of the process? Is it under control? Why or
why not?
Answer
33. See data and control charts below and spreadsheet Prob08-33XS.xls in the Instructor
materials for details.
Control limits for the
x
– s charts are:
16
17
Prob. 8-33 X-bar Chart Averages
Lower control limit
Upper control limit
Chapter 8 – Measuring and Controlling Quality 75
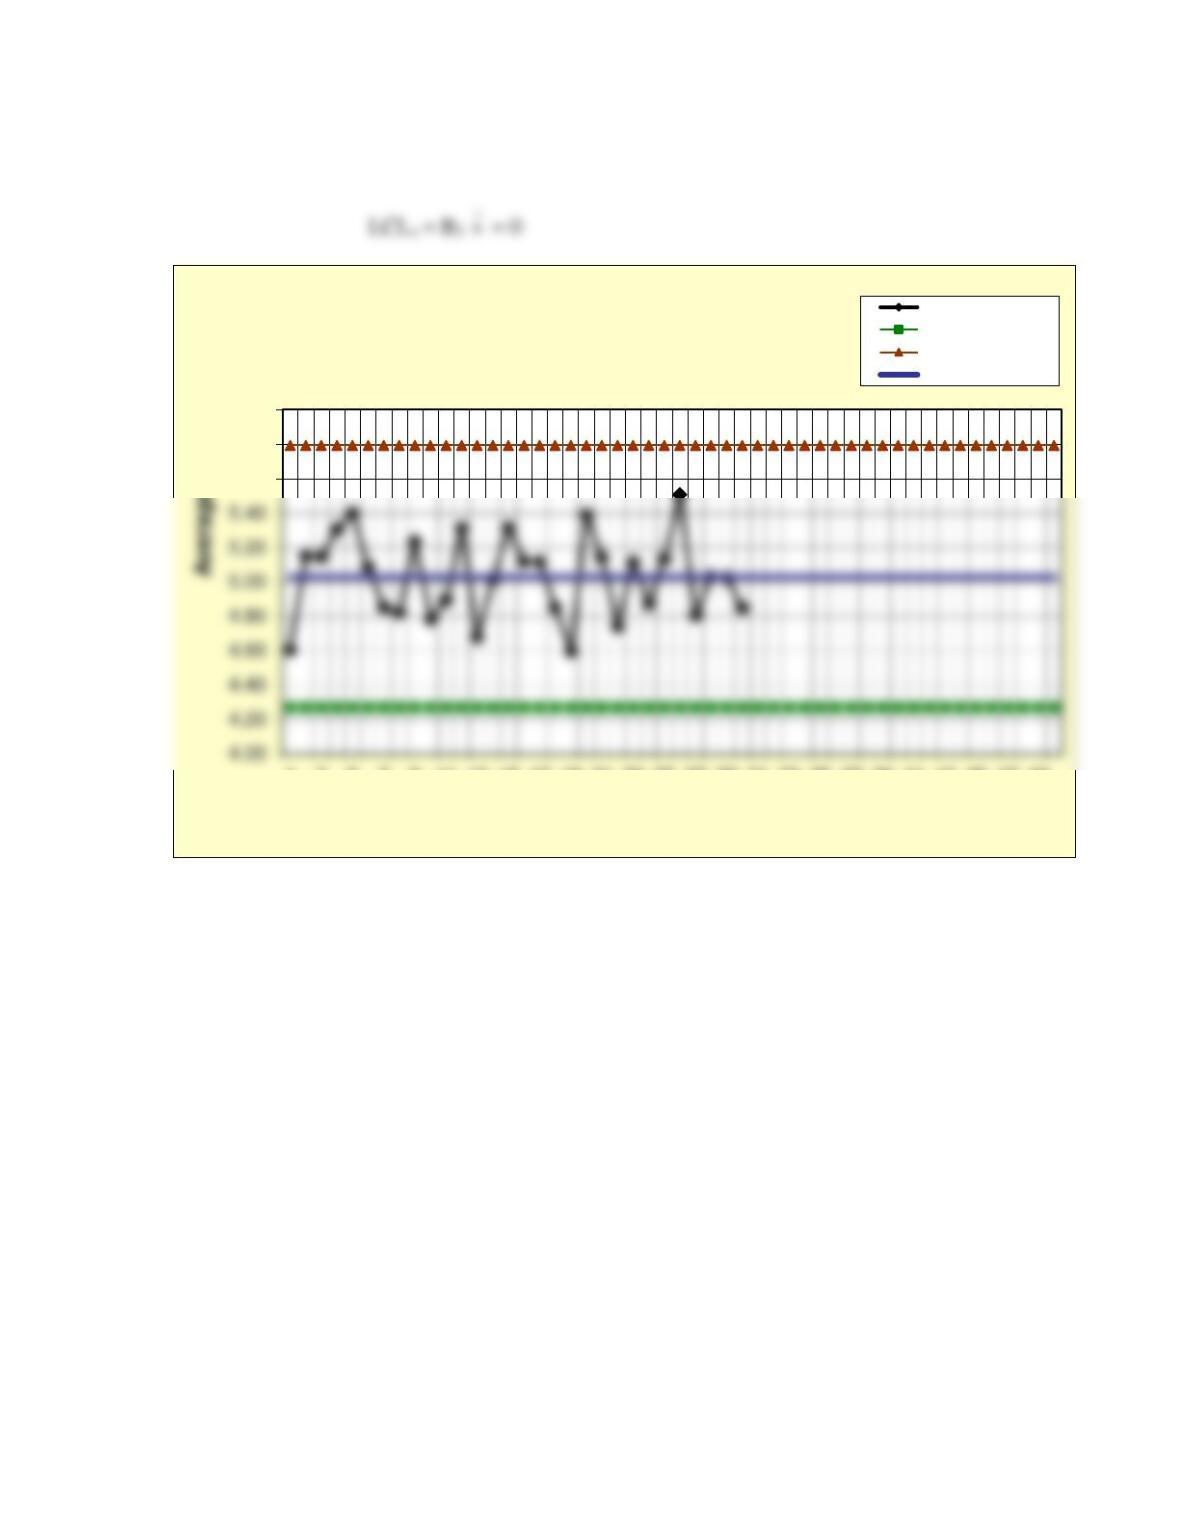
34. Fujiyama Electronics needs to construct x– and s-charts for circuit boards that are
purchased from an outside supplier. A critical dimension is the distance between two
holes on the board that are supposed to be 5 cm apart. Use the data, consisting of 30
samples of size 4 found in the worksheet Prob. 8-34 in the C08Data.xlsx file. What
conclusions do you reach concerning the state of the process? Is it under control? Why or
why not?
Answer
34. See data and control charts below and spreadsheet Prob08-34XS.xlsx in the Instructor
materials for details.
2
2.5
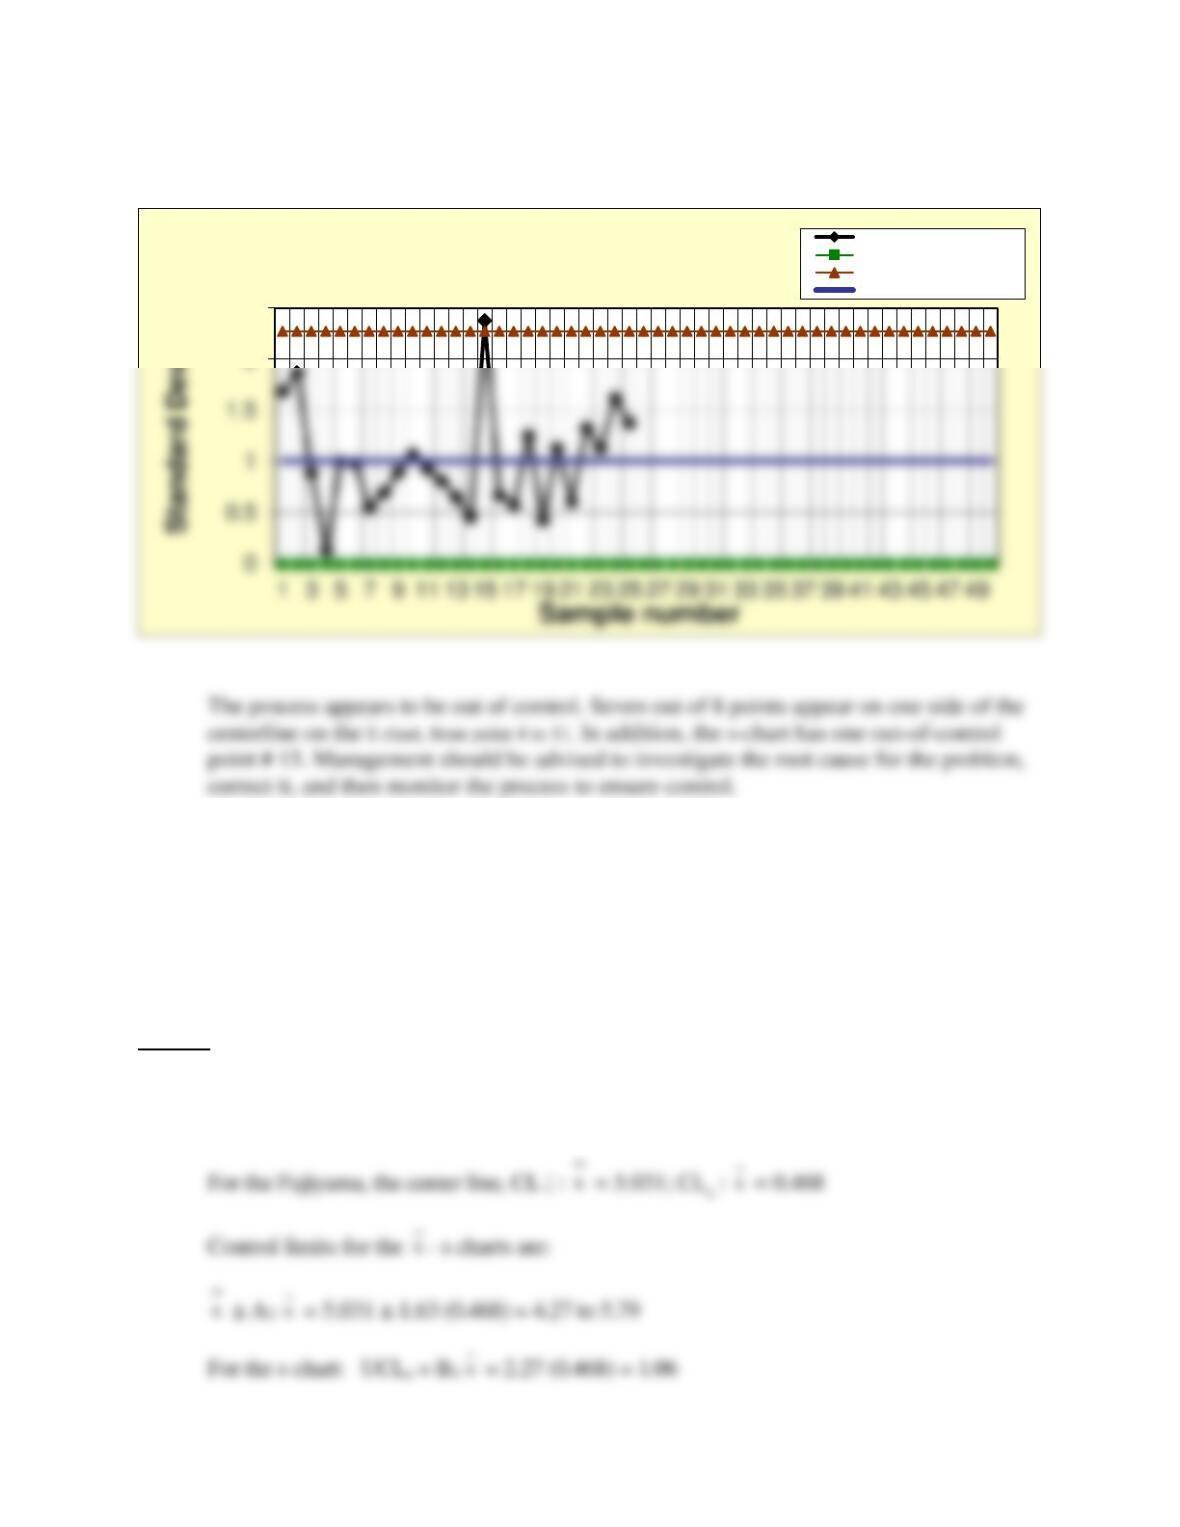
Prob. 8-33 s-Chart
Standard Deviations
Lower control limit
Upper control limit
Center line
Chapter 8 – Measuring and Controlling Quality 76
5.60
5.80
6.00
1 3 5 7 9 11 13 15 17 19 21 23 25 27 29 31 33 35 37 39 41 43 45 47 49
Sample number
Prob. 8-34 X-bar Chart
Averages
Lower control limit
Upper control limit
Center line
Chapter 8 – Measuring and Controlling Quality 77
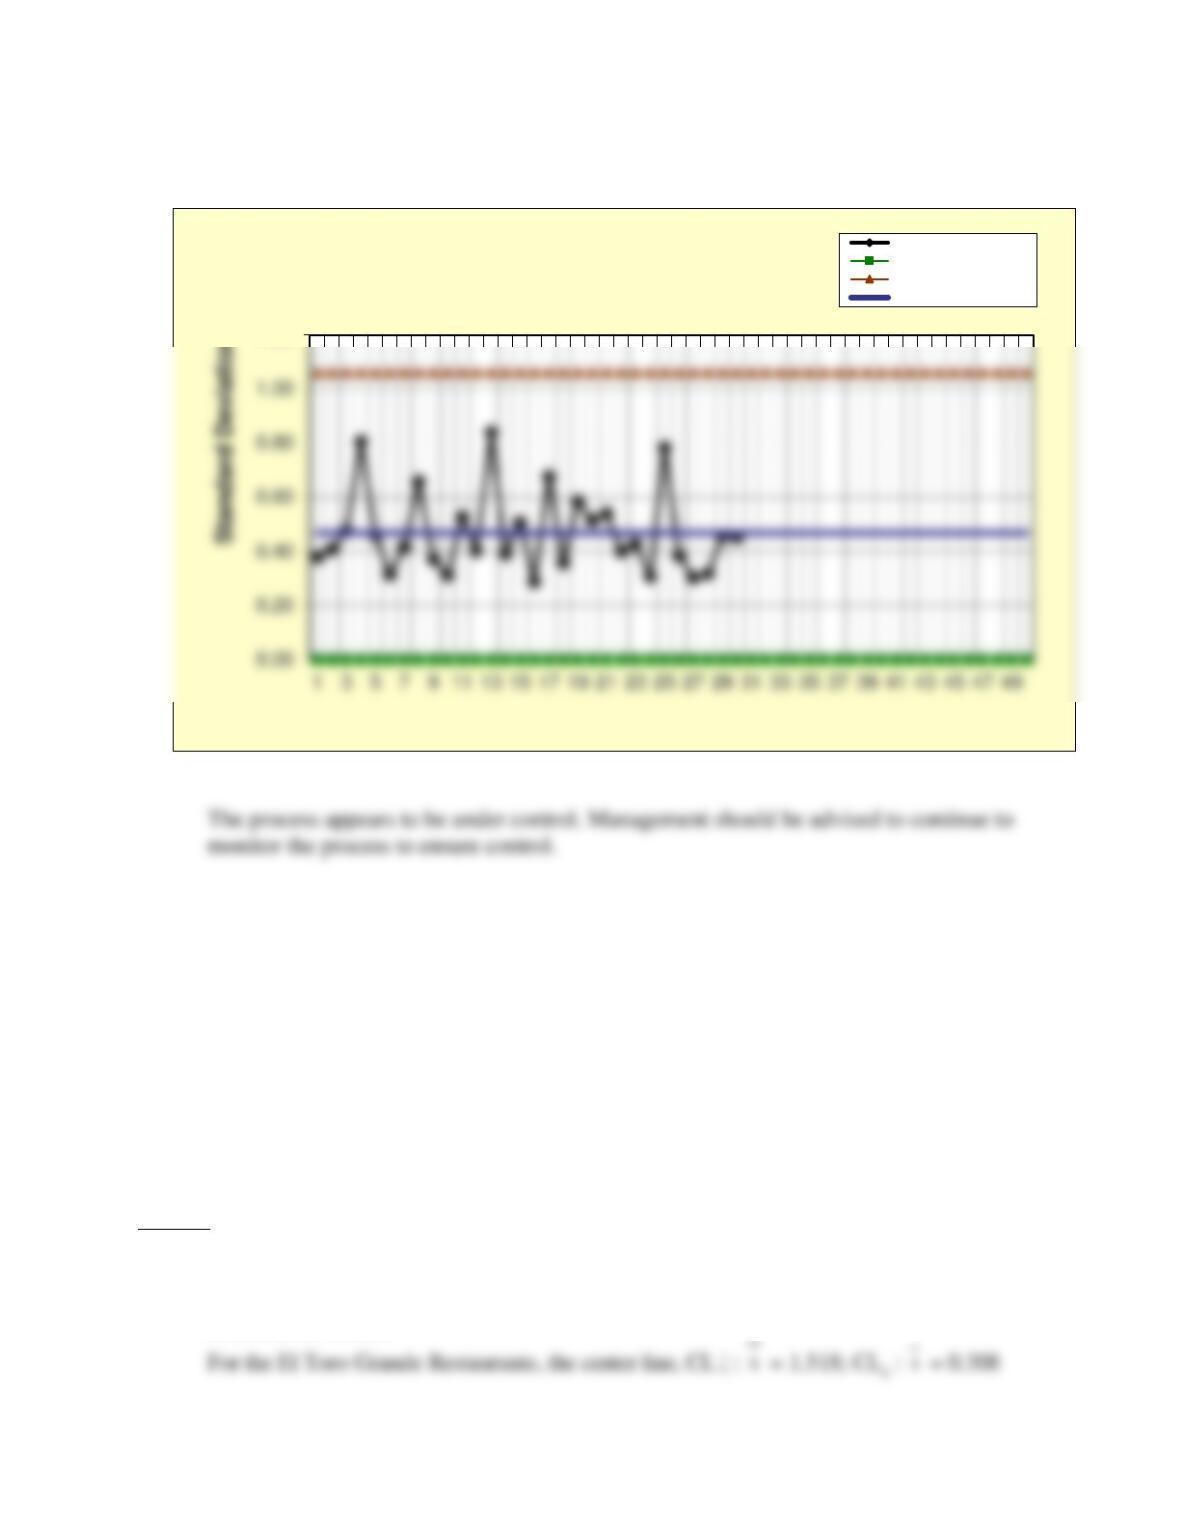
35. El Toro Grande Restaurante advertises that customers will have their orders taken within
three minutes after being seated. Management wants to monitor average times, as it is
such an important guarantee for business. Construct 𝑥̅– and s-charts for the data given in
the worksheet Prob. 8-35 in the C08Data.xlsx file on the Student Companion Site for this
chapter.
a. compute the sample means and the average standard deviation, calculate the control
limits, and plot them on control charts.
b. Does the process appear to be in statistical control? Why or why not?
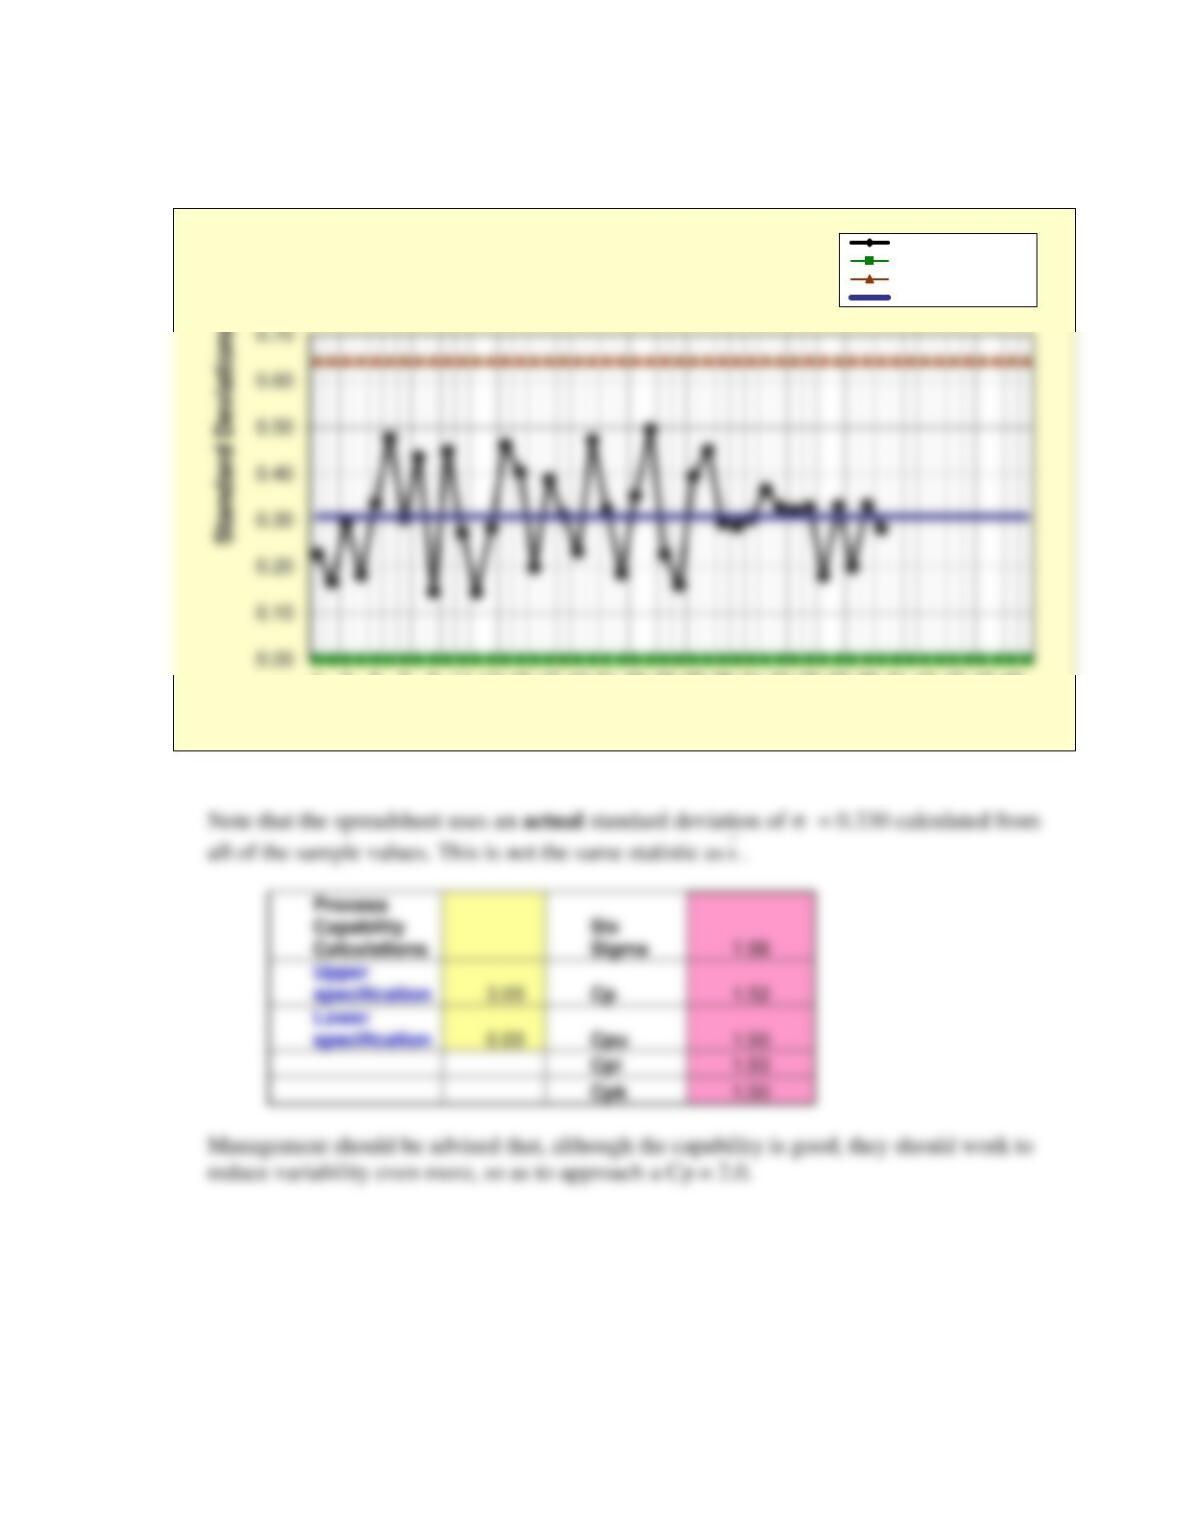
c. Calculate the process capability statistics, using three minutes as the upper tolerance
limit and zero as the lower tolerance limit. What recommendation would you make to
management concerning the process, based on these findings?
Answer
35. See data and control charts below and spreadsheet Prob08-35XS.xlsx in the Instructor
materials for details.
1.20
Sample number
Prob. 8-34 s-Chart
Standard Deviations
Lower control limit
Upper control limit
Center line
Chapter 8 – Measuring and Controlling Quality 78
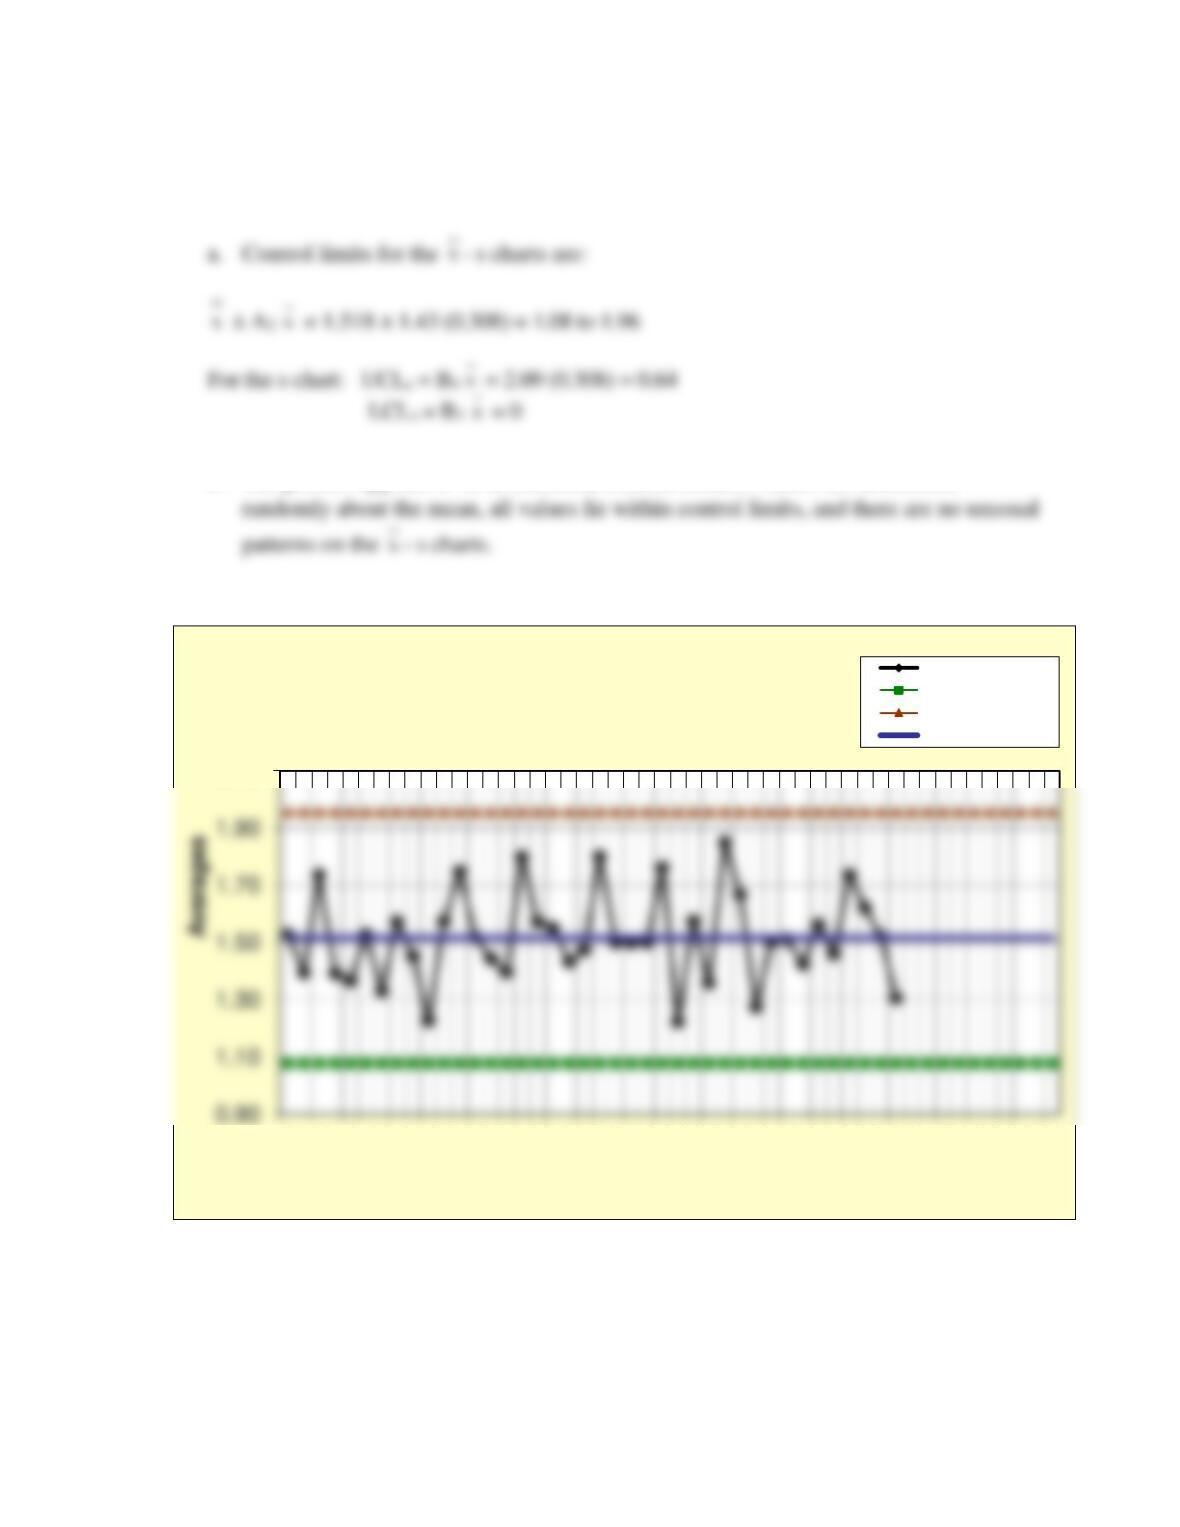
b. The process appears to be in statistical control, because values are distributed
2.10
1 3 5 7 9 11 13 15 17 19 21 23 25 27 29 31 33 35 37 39 41 43 45 47 49
Sample number
Prob. 8-35 X-bar Chart
Averages
Lower control limit
Upper control limit
Center line
Chapter 8 – Measuring and Controlling Quality 79
c. The process appears to be capable.
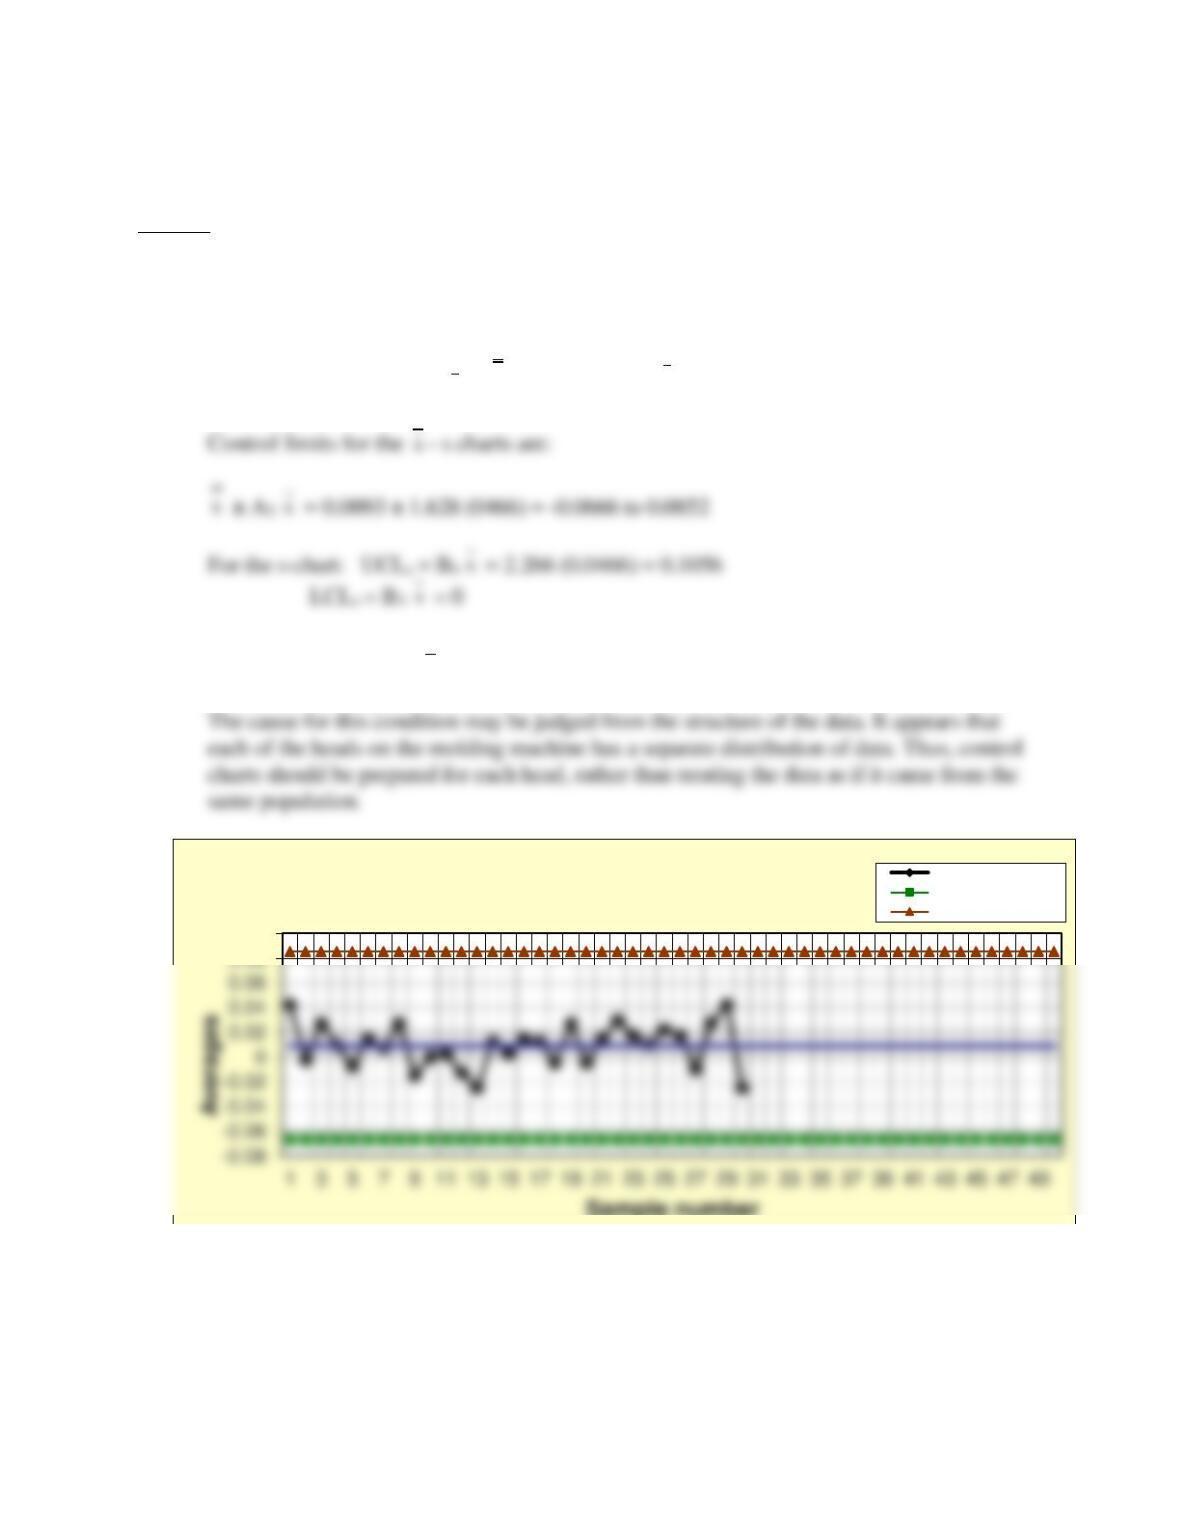
36. An injection molding machine at the Moby Molding Co. used to make plastic bottles has
four molding heads. The outside diameter of the bottle is an important measure of process
performance. The table in the worksheet Prob.8-36 in the C08Data.xlsx file shows the
results of 30 samples in which the data are coded by subtracting the actual value from the
nominal dimension. Construct x– and s-charts and discuss the results.
1357911 13 15 17 19 21 23 25 27 29 31 33 35 37 39 41 43 45 47 49
Sample number
Prob. 8-35 s-Chart
Standard Deviations
Lower control limit
Upper control limit
Center line
Chapter 8 – Measuring and Controlling Quality 80
Answer
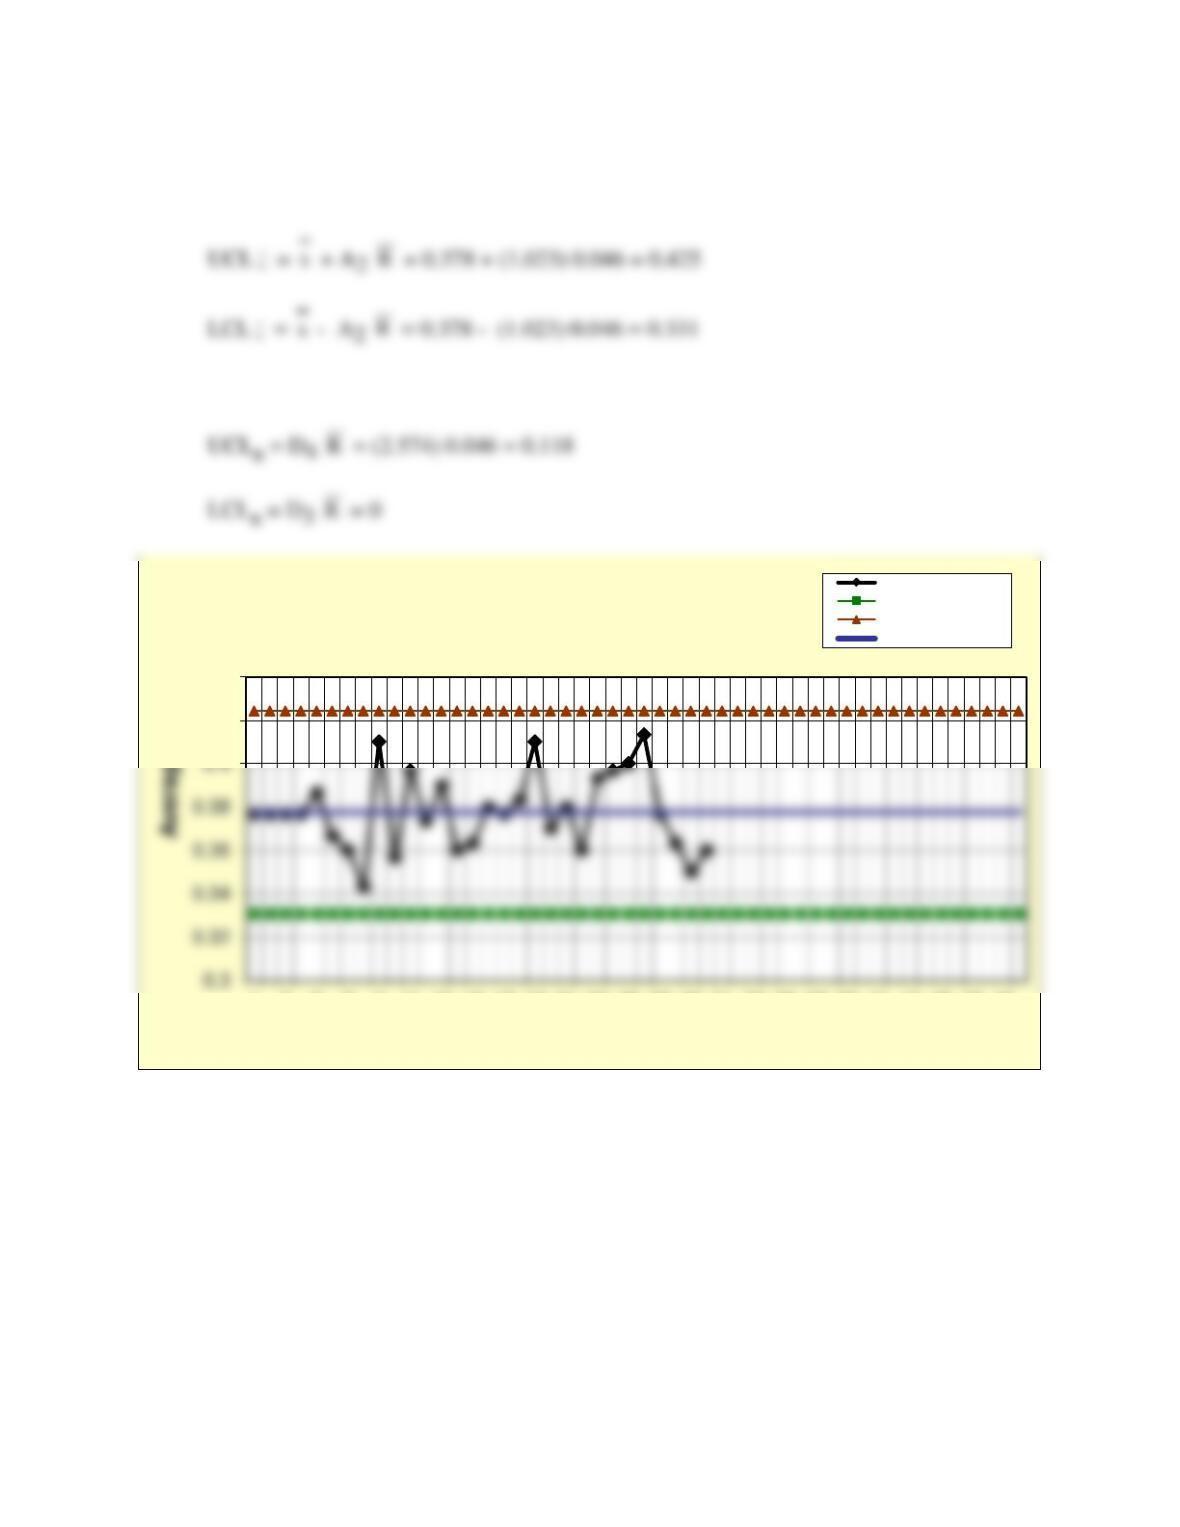
36. See data and control charts below and spreadsheet Prob08-36XS.xlsx in the Instructor
materials for details on the Moby Molding Co.’s plastic molding process.
a) For the Center Line, CL
x
:
x
= 0.0093; CLs :
s
= 0.0466
b) We can see from the
x
– chart (and possibly the s–chart) that the process is “hugging the
centerline” creating an out of control condition on the means and their standard deviations.
0.1
Sample number
Prob. 8-36 X-bar Chart
Averages
Lower control limit
Upper control limit
x
s
s