Chapter 8 – Measuring and Controlling Quality 21
Answer
6. Original Data:
Cost Element Amount
Customer complaint remakes $ 27,000
Printing plate revisions 28,000
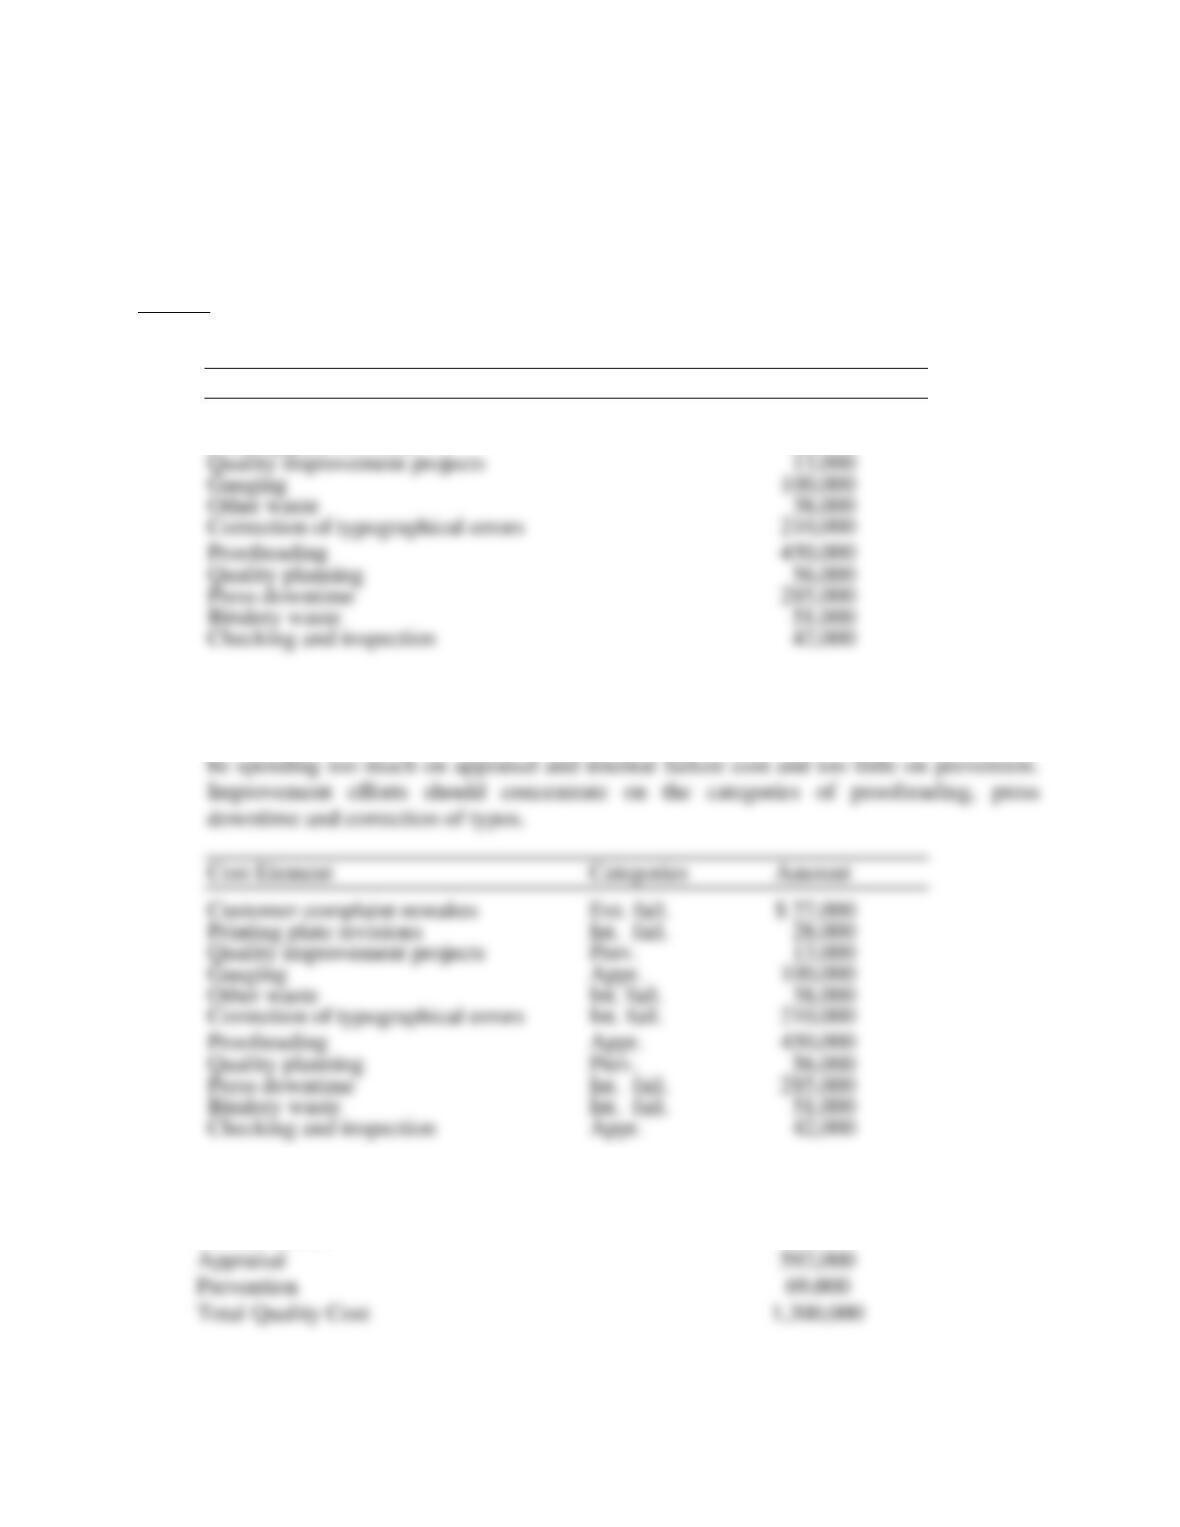
The spreadsheet data and pie chart (see spreadsheet Prob08-06.xlsx in the Instructor
materials for details) for the Great Press Printing Company show that the company may
GREAT PRESS PRINTING COMPANY
$000’s QUALITY COSTS
External failure
27,000
Internal failure
612,000
Appraisal
592,000
Prevention
69,000
Total Quality Cost
Chapter 8 – Measuring and Controlling Quality 22
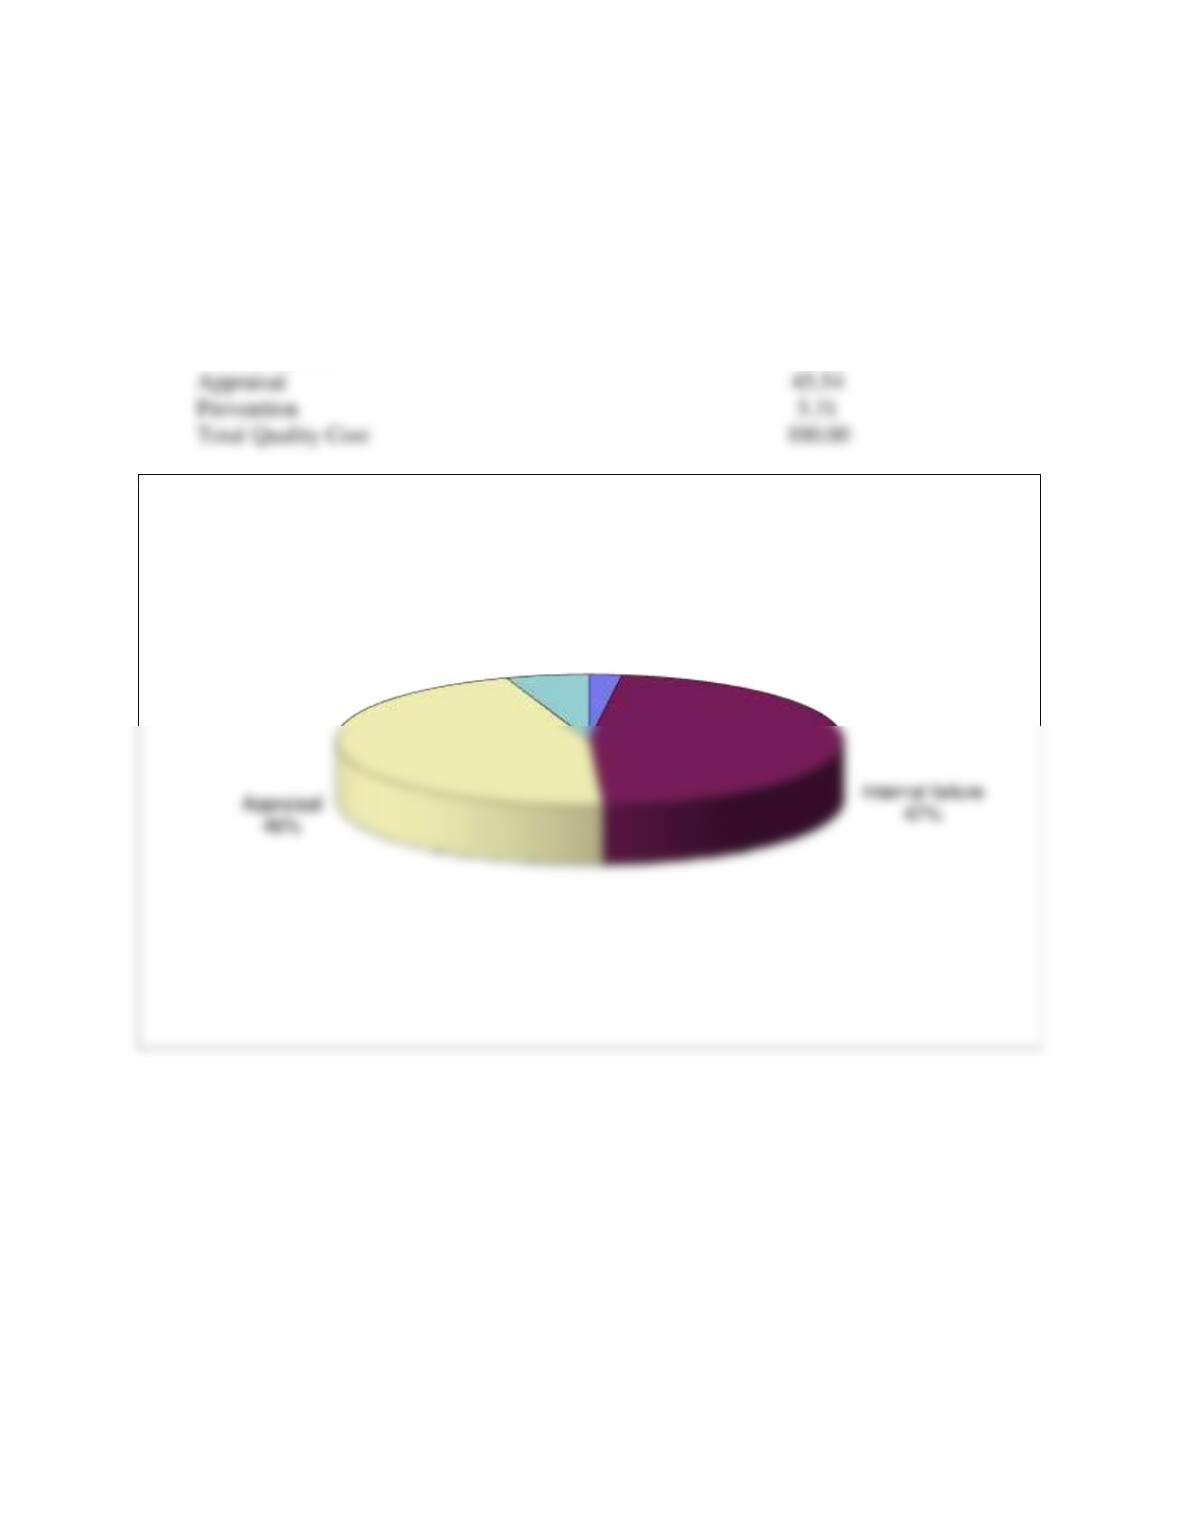
PERCENTAGE OF COSTS
External failure
2.08
Internal failure
47.08
7. Compute a labor cost base index for Miami Valley Aircraft Service Co. to analyze the
quality cost information and prepare a memo to management explaining your
conclusions. See the data in the Excel workbook C08Data.xlsx. . [See the file on Indexes
on the Student Companion Site for an explanation].
External failure
2%
Prevention
5%
Great Press Printing Company % Quality Costs
Appraisal
45.54
Prevention
5.31
Total Quality Cost
Chapter 8 – Measuring and Controlling Quality 23
Answer
7. Original data:
Quarterly Costs (in thousands of dollars)
1 2 3 4
External failure 1000 900 950 725
Internal failure 3,500 3,250 2,900 2,200
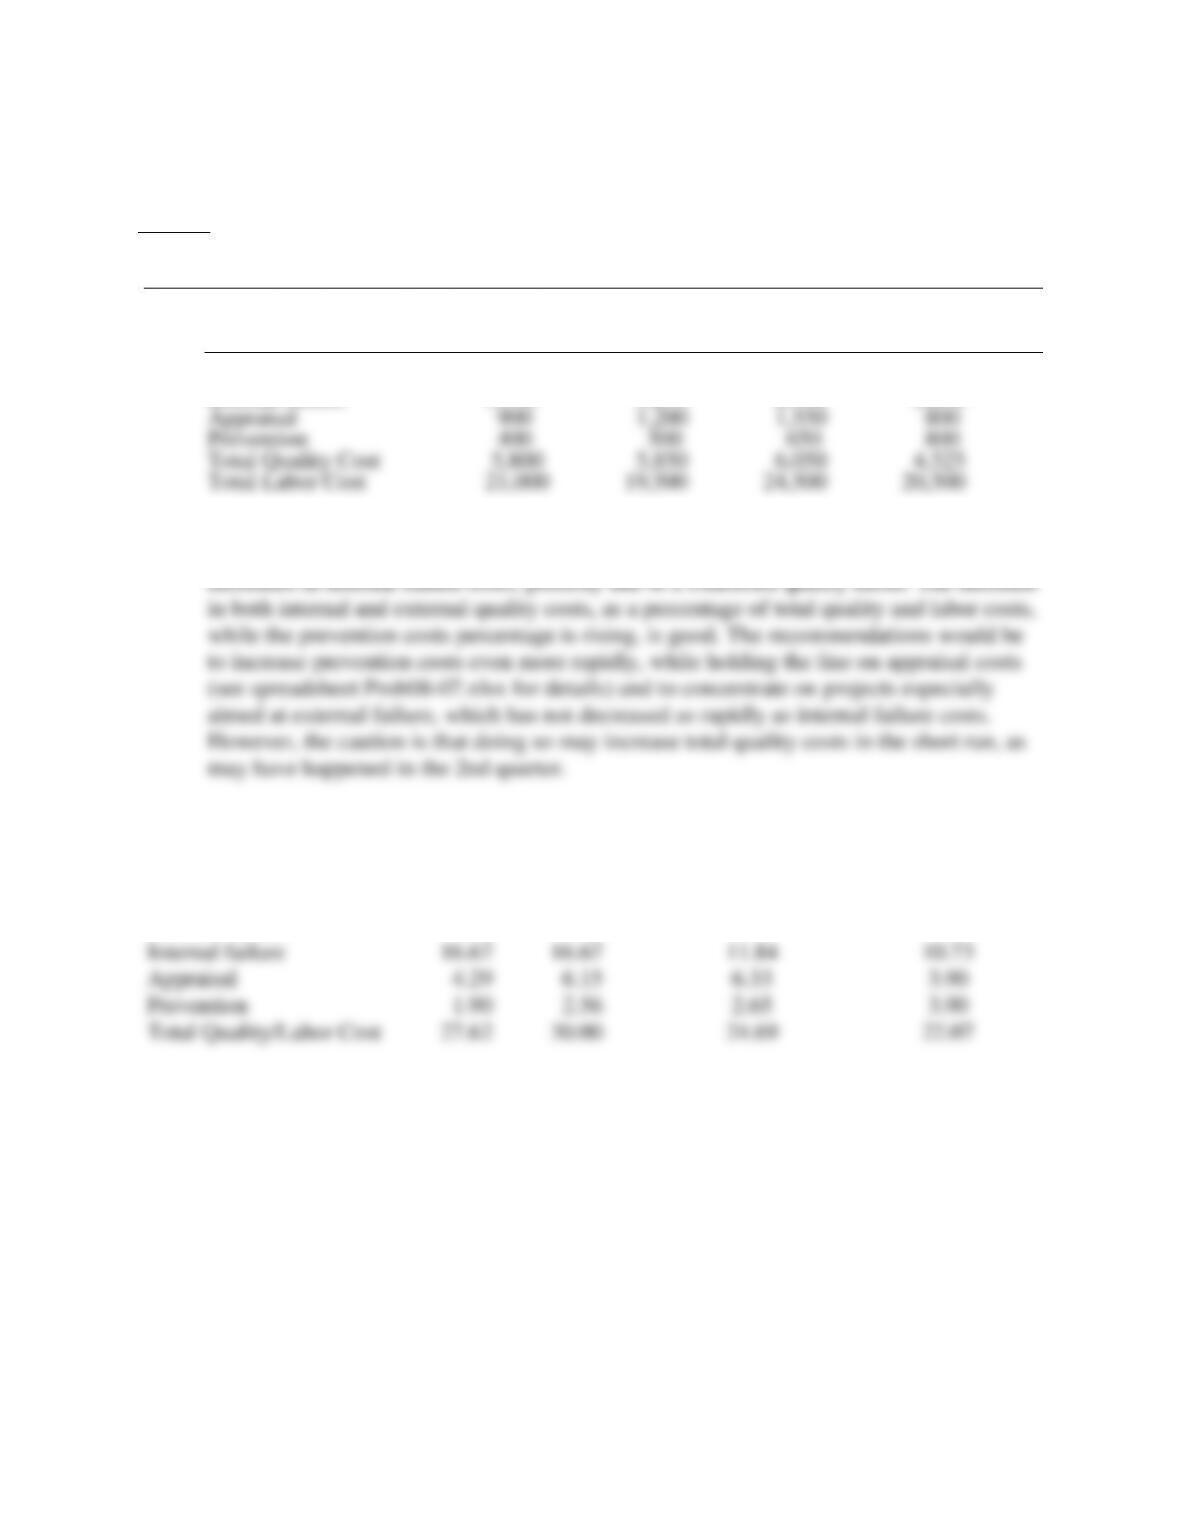
Miami Valley Aircraft Service Company’s data show a decreasing total quality cost index
as a percent of labor costs (except for a slight rise in the 2nd quarter), with significant
PERCENTAGES QTRLY. QUALITY/LABOR COSTS
PERCENTAGES QTRLY. QUALITY/LABOR COSTS
1 Qtr.
2 Qtr.
3 Qtr.
4 Qtr.
External failure
4.76
4.62
3.88
3.54
Internal failure
16.67
Appraisal
4.29
6.15
6.33
3.90
Prevention
1.90
2.56
2.65
3.90
Total Quality/Labor Cost
30.00
Chapter 8 – Measuring and Controlling Quality 24
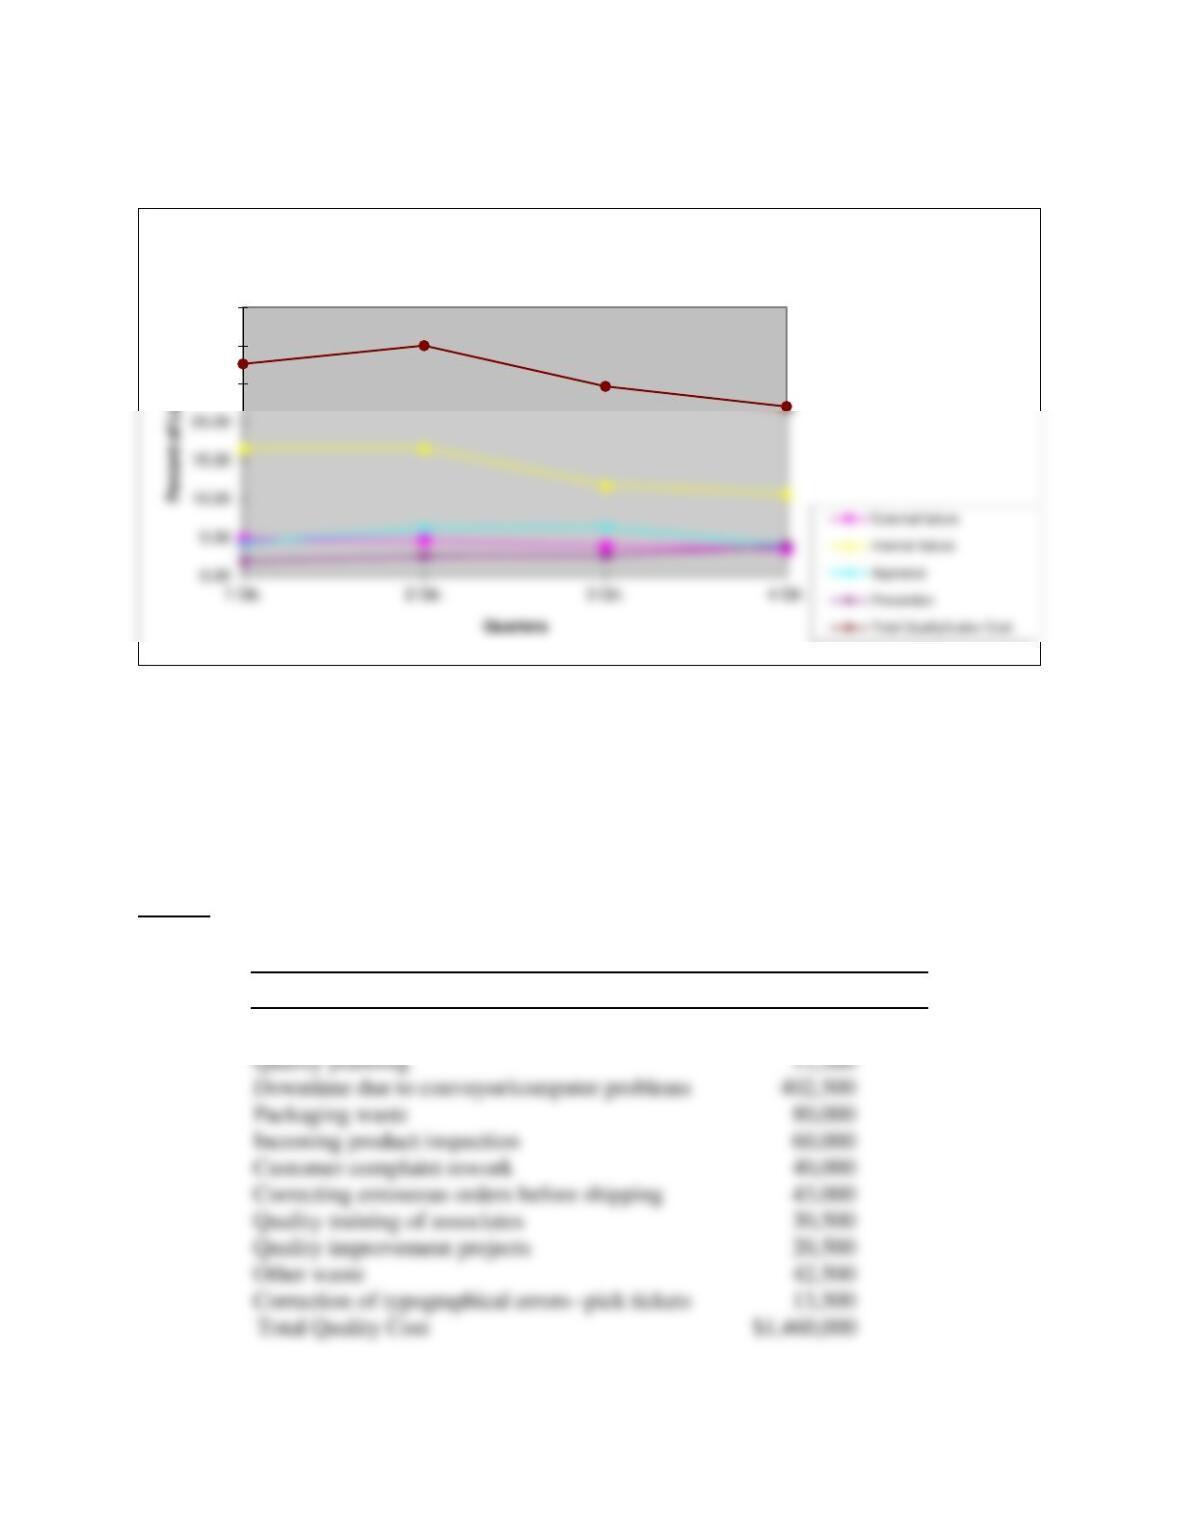
8. Repack Solutions, Inc. has a distribution center in Cincinnati where it receives and breaks
down bulk orders from suppliers’ factories, and ships out products to retail customers.
Prepare a chart showing the different quality cost categories and percentages for the
company’s quality costs that were incurred over the past year. See the Excel workbook
C08Data.xlsx for the data.
Answer
8. Original Data:
Cost Element Amount
Checking outbound boxes for errors $715,000
25.00
30.00
35.00
Miami Valley Aircraft Service Co. – Cost of Quality
Chapter 8 – Measuring and Controlling Quality 25
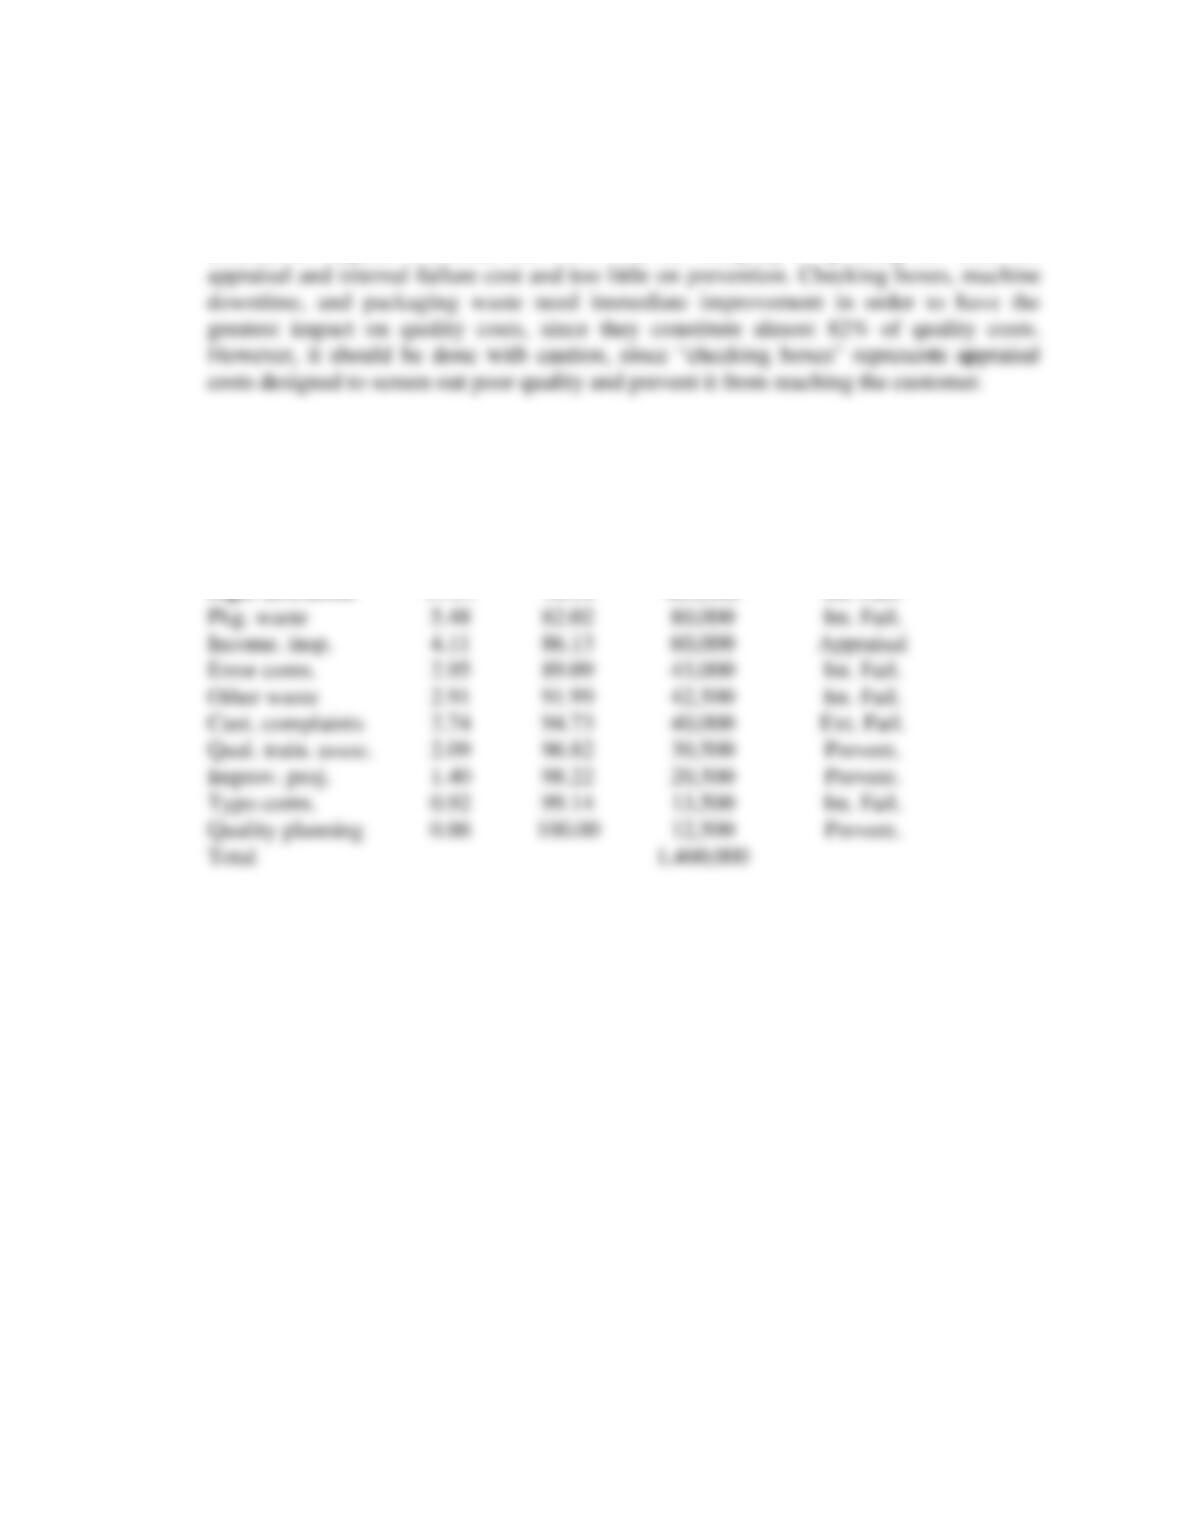
Spreadsheet data and the Pareto chart (see Prob08-08.xlsx in the Instructor materials for
details) for Repack Solutions, Inc. show that the company is spending too much on
REPACK SOLUTIONS, INC.
QUALITY COST &
PERCENTAGES
Quality Cost
Percent
Cumulative %
Cost
Category
Checking boxes
48.97
48.97
715,000
Appraisal
Eqpt. downtime
27.57
76.54
402,500
Int. Fail.
Pkg. waste
5.48
82.02
Int. Fail.
Income. insp.
4.11
86.13
Appraisal
Error corrn.
2.95
89.09
Int. Fail.
Other waste
2.91
91.99
Int. Fail.
Cust. complaints
2.74
94.73
Ext. Fail.
Qual. train. assoc.
2.09
96.82
Improv. proj.
1.40
98.22
Typo corrn.
0.92
99.14
Int. Fail.
Quality planning
0.86
Total
Chapter 8 – Measuring and Controlling Quality 26
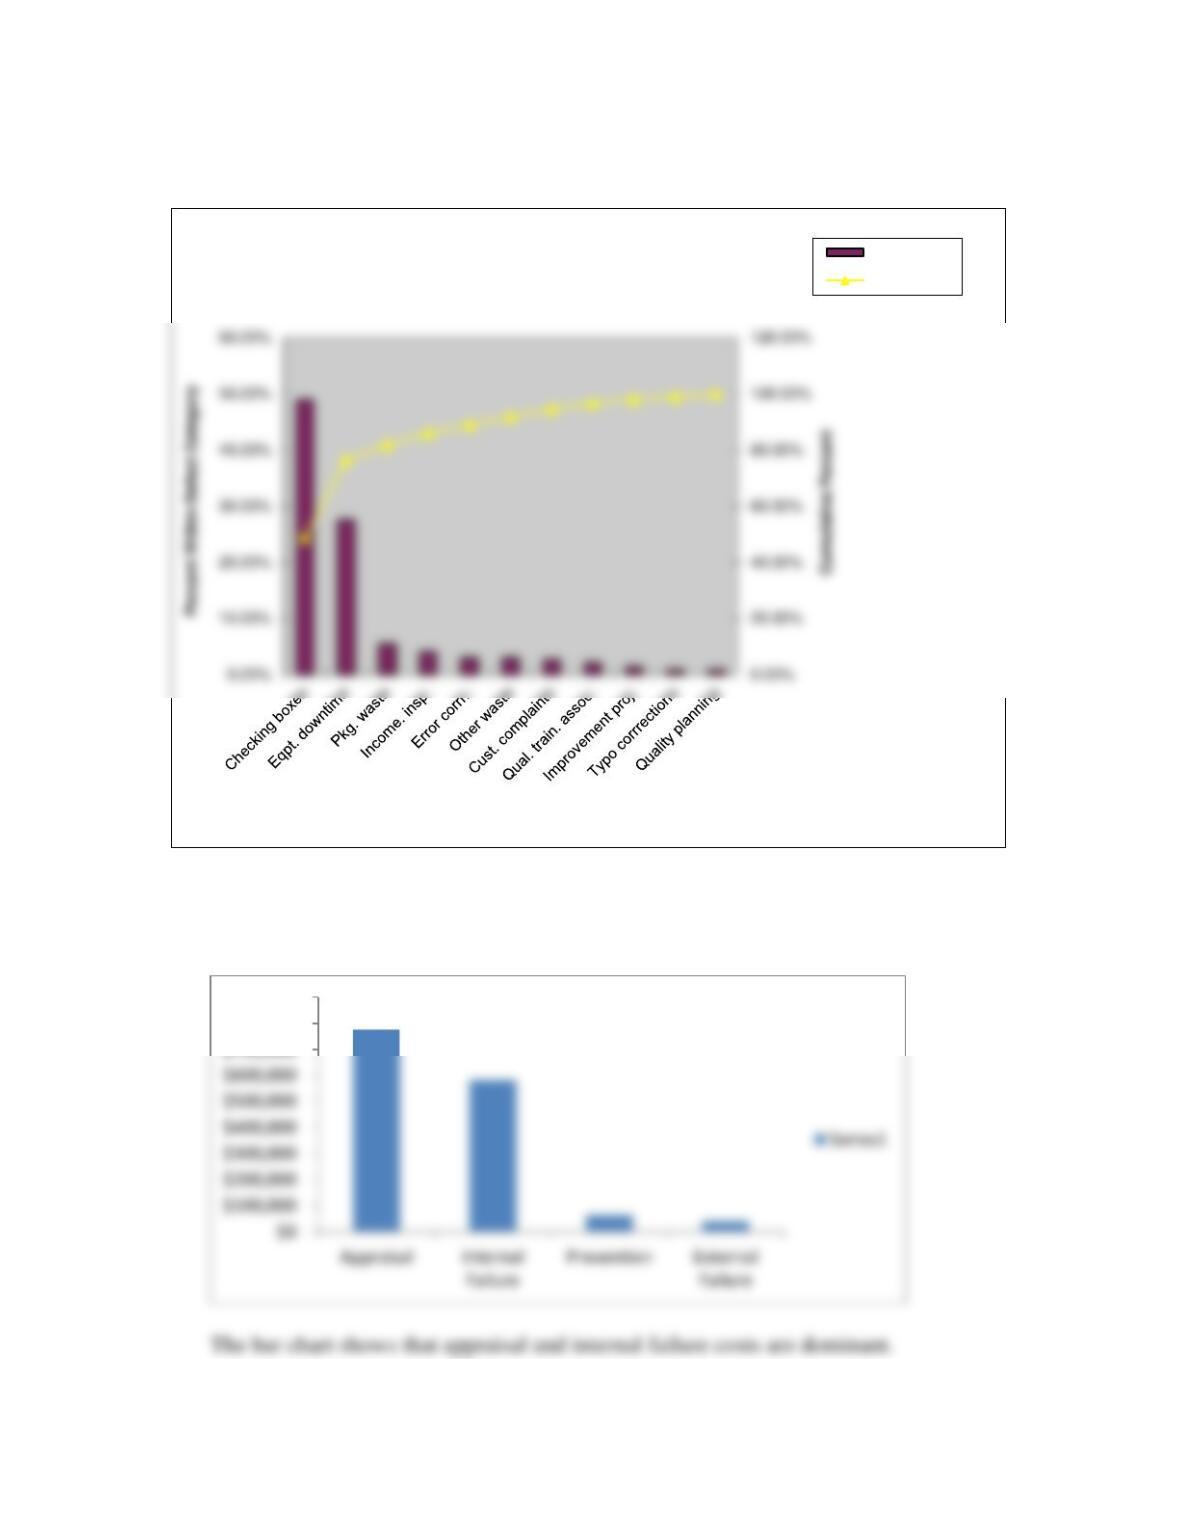
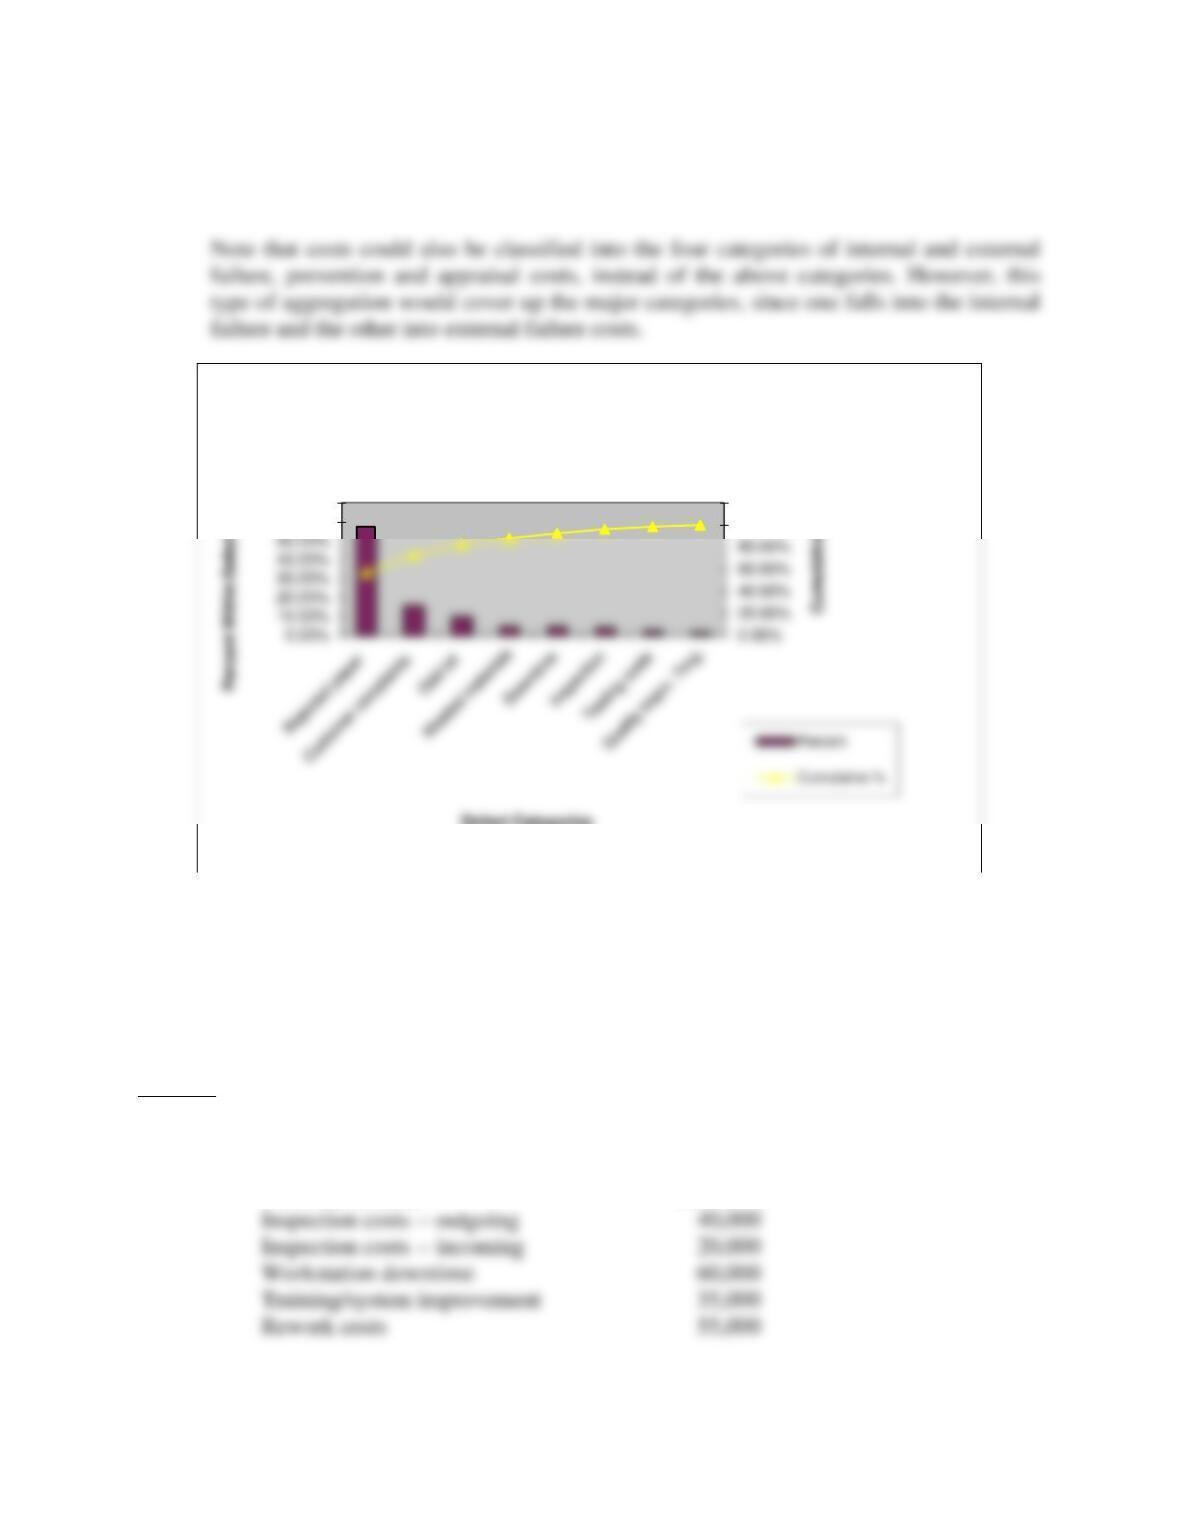
Note that costs could also be classified by aggregating them into the four categories of
internal and external failure, prevention and appraisal costs, instead of the above
categories, as shown on the following chart.
Defect Categories
Repack Solutions, Inc.
Percent
Cumulative %
$700,000
$800,000
$900,000
Quality Costs
Chapter 8 – Measuring and Controlling Quality 27
9. Use Pareto analysis to investigate the quality losses at Nosoco Paper Mill. What
conclusions do you reach? See the Excel workbook C08Data.xlsx for the data.
Answer
9. Original Data
Category Annual Loss
Downtime $ 30,000
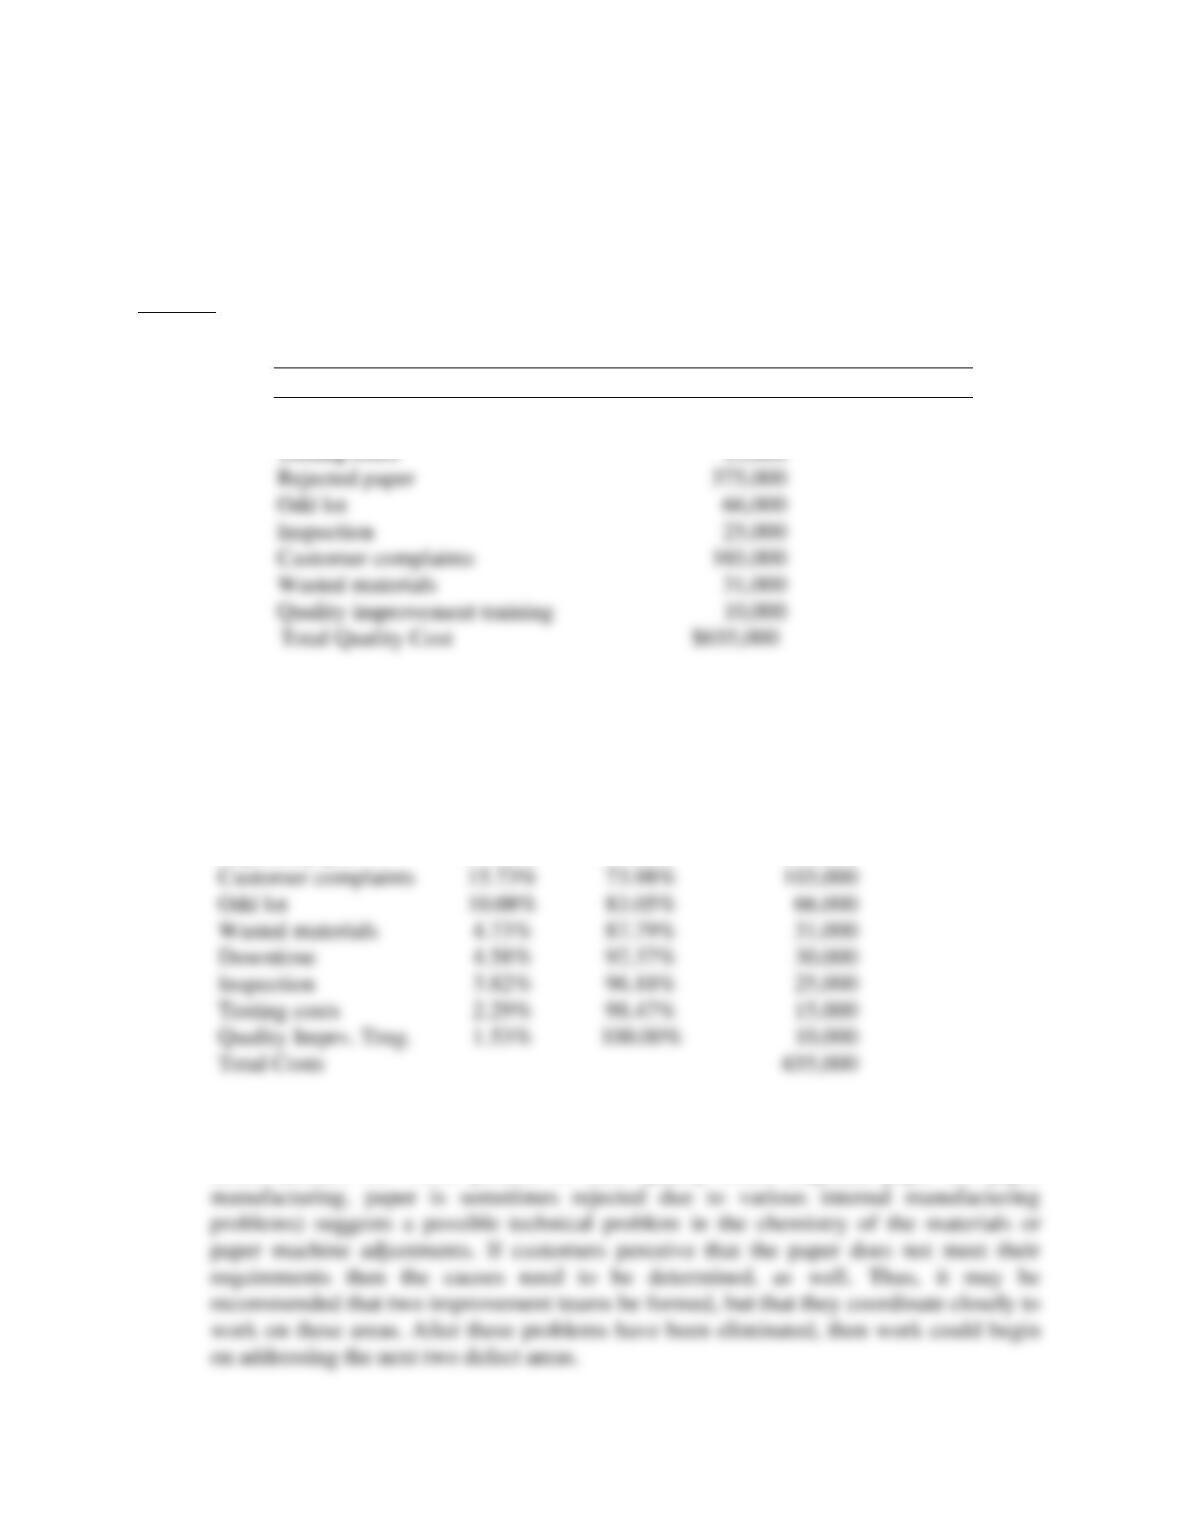
See the following table and figure for Pareto analysis of Nosoco’s quality cost categories.
(See spreadsheet Prob08-09.xlsx in the Instructor materials for details.)
Nosoco Paper Company
Quality Costs and Percentages
Percent
Cumulative %
Cost
Rejected paper
57.25%
57.25%
375,000
Customer complaints
15.73%
73.98%
103,000
Odd lot
10.08%
83.05%
Wasted materials
87.79%
Downtime
92.37%
Inspection
96.18%
Testing costs
98.47%
Quality Imprv. Trng.
Total Costs
655,000
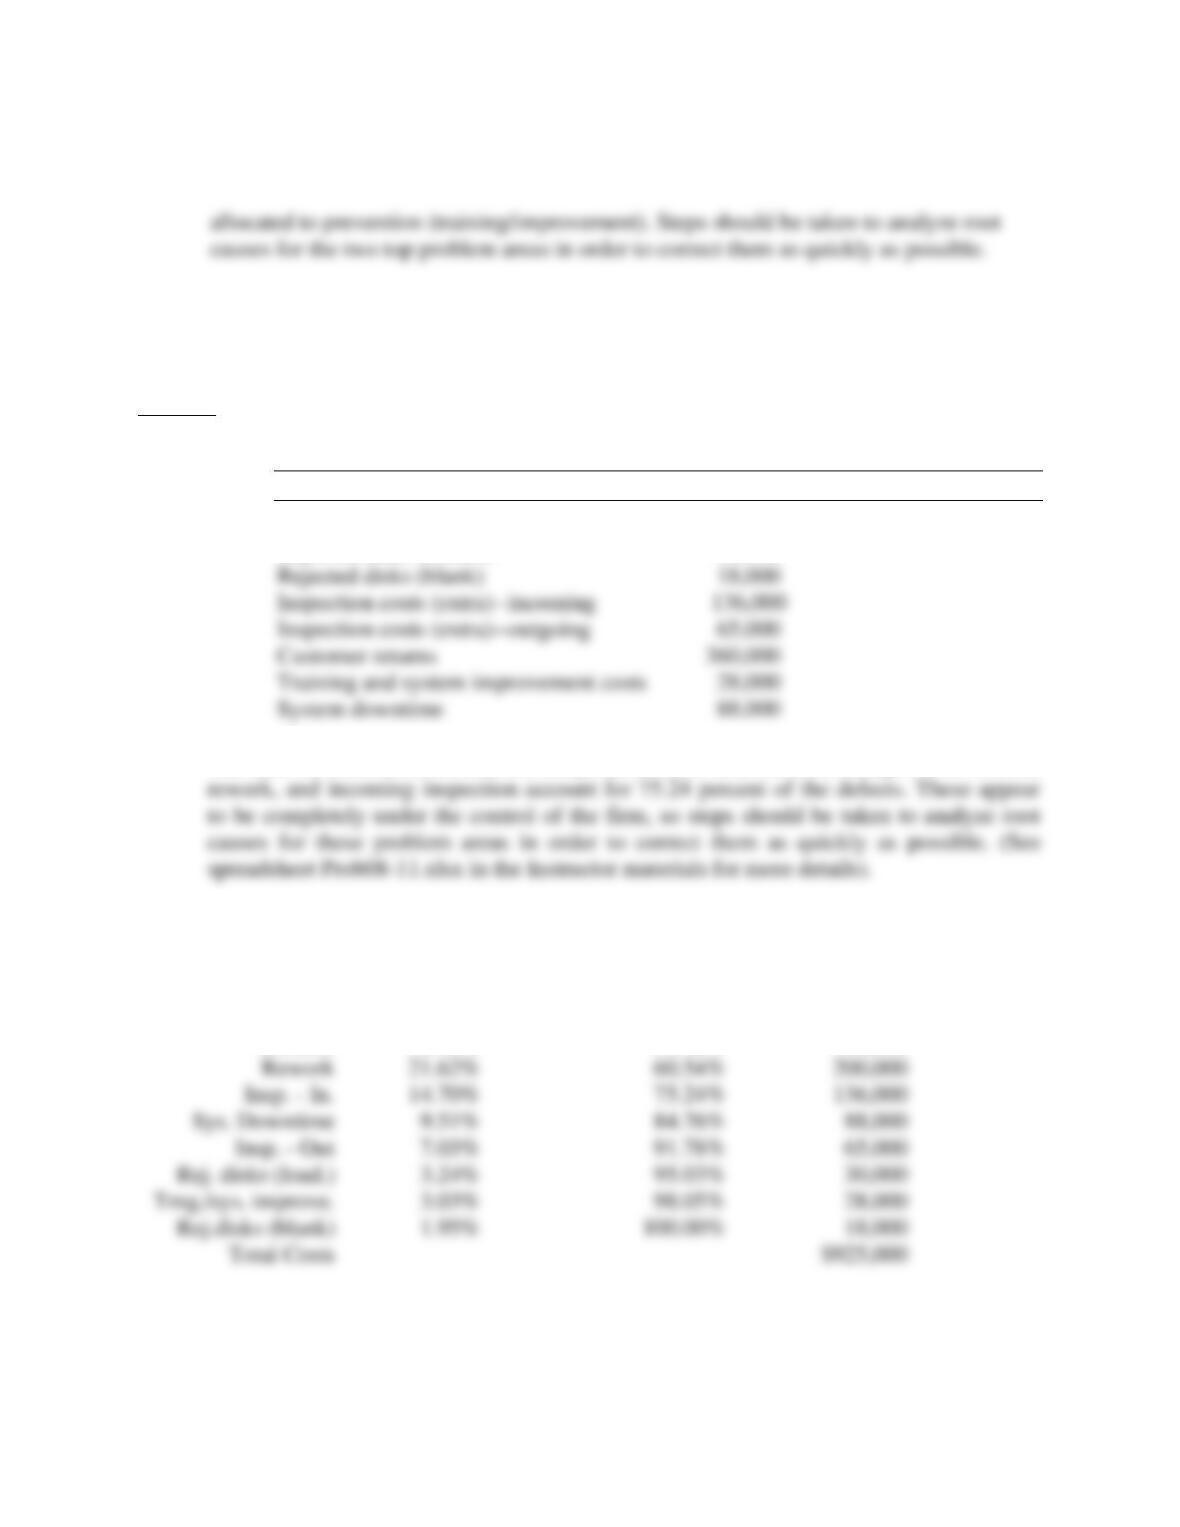
Conclusion: Nosoco Paper Co. is experiencing problems in two major categories:
rejected paper and customer complaints. These categories, which could be related to each
other, account for 73.98 percent of their quality costs. Rejected paper (in paper
Chapter 8 – Measuring and Controlling Quality 28
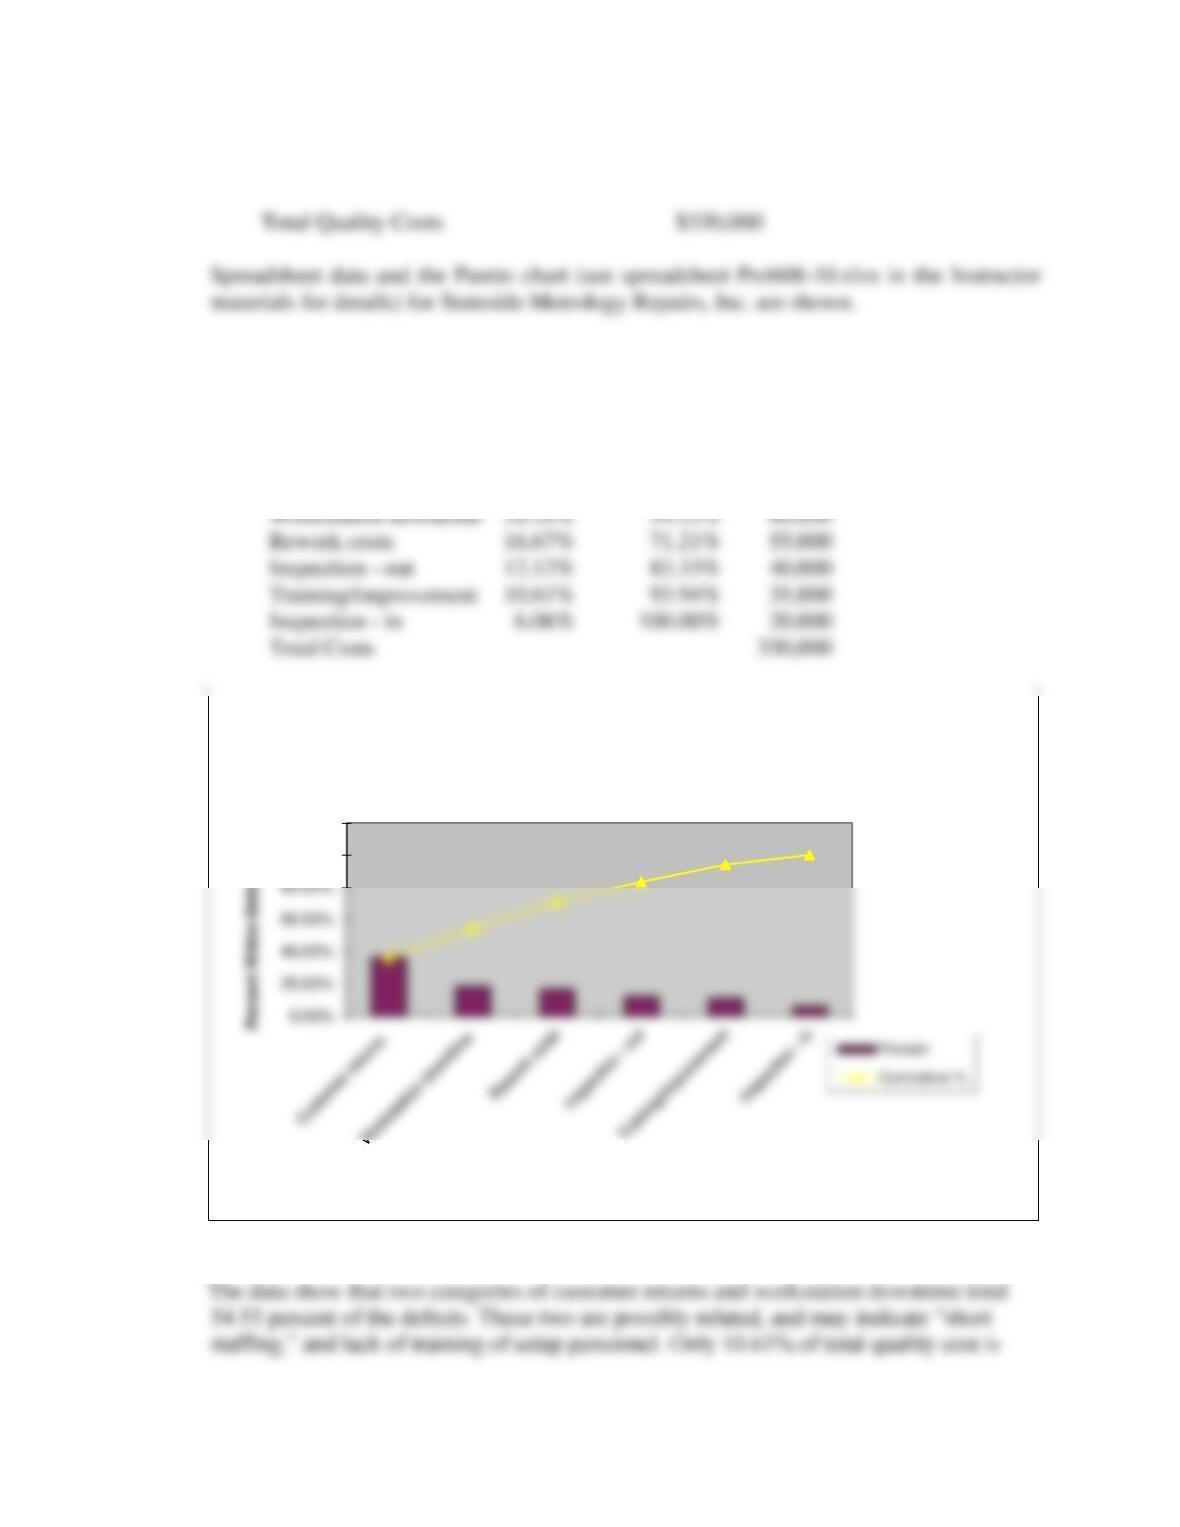
10. Stateside Metrology Repairs, Inc. has a thriving business repairing and upgrading high-
technology measuring instruments. The costs of quality that they have collected over the
past year can be found in the Excel workbook C08Data.xlsx. Use Pareto analysis to
investigate their quality losses and to suggest which areas they should address first in an
effort to improve their quality.
Answer
10. Original Data:
Category Annual Loss
Customer returns
$120,000
Inspection costs — outgoing
40,000
Inspection costs — incoming
20,000
Workstation downtime
60,000
Training/system improvement
35,000
100.00%
120.00%
60.00%
70.00%
Defect Categories
Pareto Chart for Nosoco Paper Co.
Chapter 8 – Measuring and Controlling Quality 29
STATESIDE METROLOGY REPAIRS, INC.
QUALITY COSTS AND PERCENTAGES
Percent
Cumulative
Percent
Cost
Customer returns
36.36%
36.36%
$120,000
Workstation downtime
18.18%
54.55%
Rework costs
16.67%
71.21%
Inspection – out
12.12%
83.33%
Training/improvement
10.61%
93.94%
Inspection – in
Total Costs
100.00%
120.00%
Defect Categories
Pareto Chart for Stateswide Metroogy Repairs
Chapter 8 – Measuring and Controlling Quality 30
11. Use Pareto analysis to investigate the quality losses at Beechmount Software Corp. using
the data in the Excel workbook C08Data.xlsx. What conclusions do you reach?
Answer
11. Original Data:
Category Annual Loss
Rework costs $200,000
Rejected disks (loaded) 30,000
The data for Beechmount Software Corporation show that the three categories of returns,
BEECHMOUNT SOFTWARE CORPORATION
QUALITY COSTS AND PERCENTAGES
Percent
Cumulative %
Cost
Returns
38.92%
38.92%
360,000
Rework
21.62%
60.54%
200,000
Insp. – In.
14.70%
75.24%
136,000
91.78%
95.03%
98.05%
Chapter 8 – Measuring and Controlling Quality 31
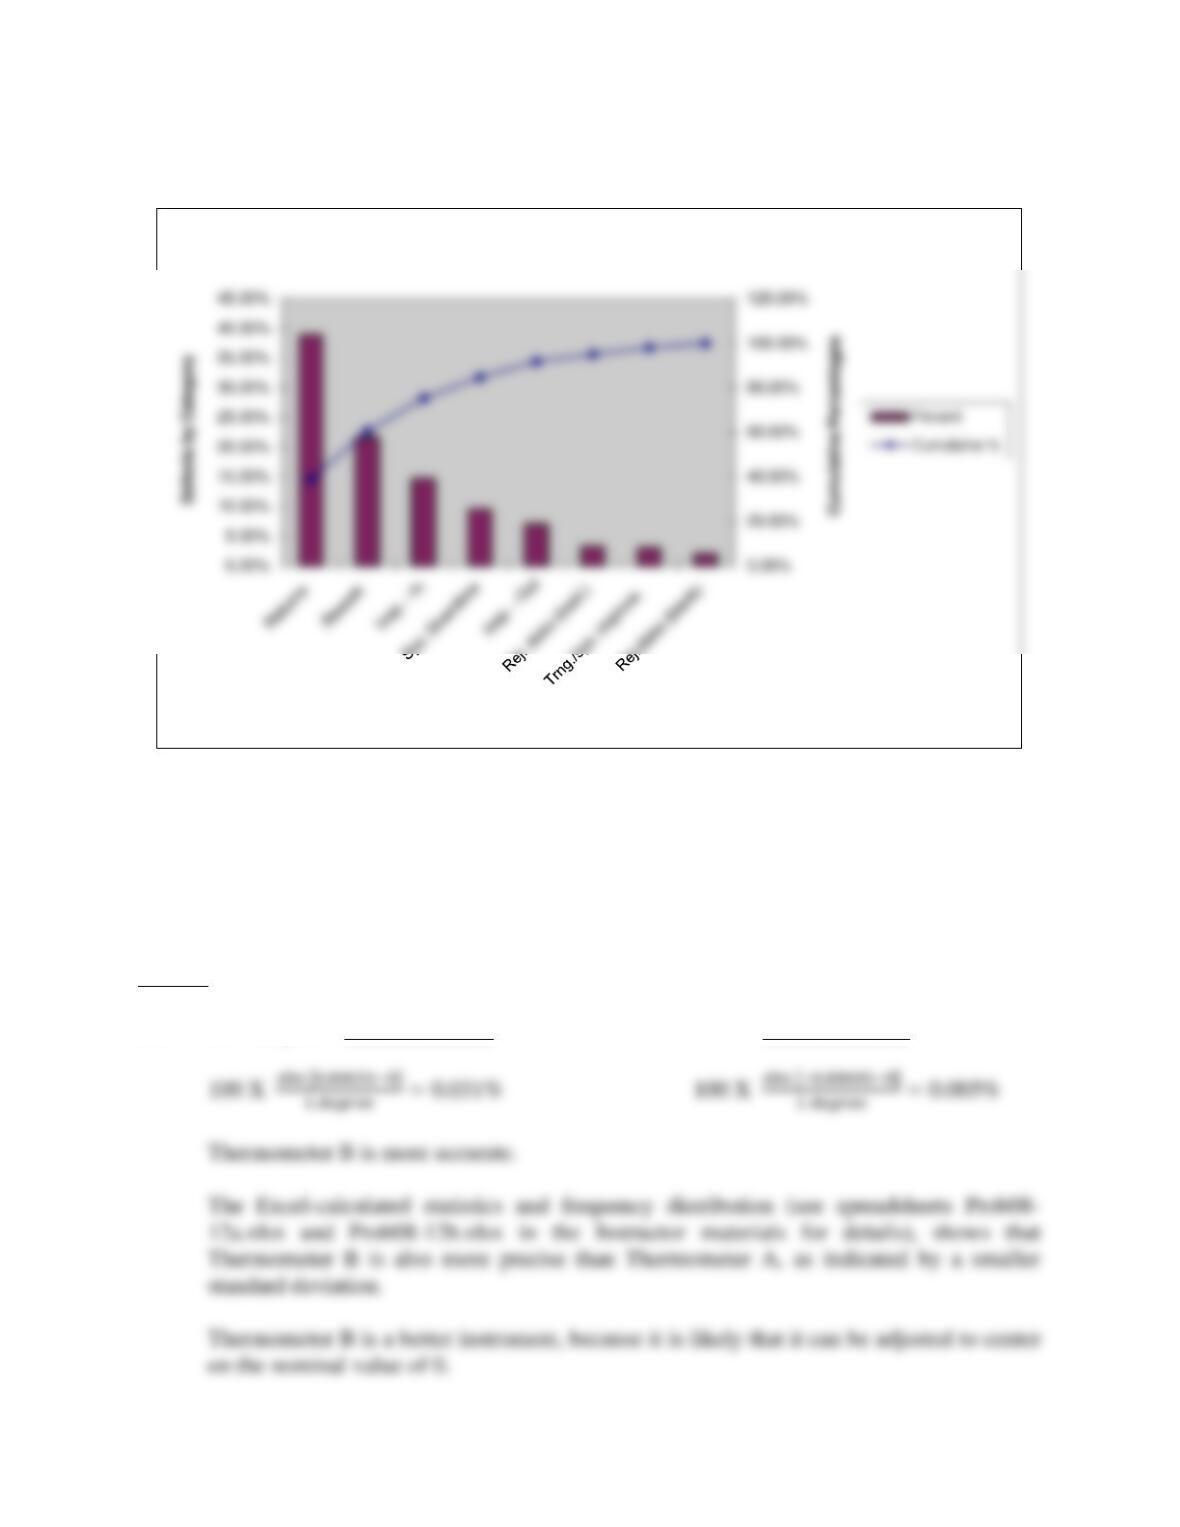
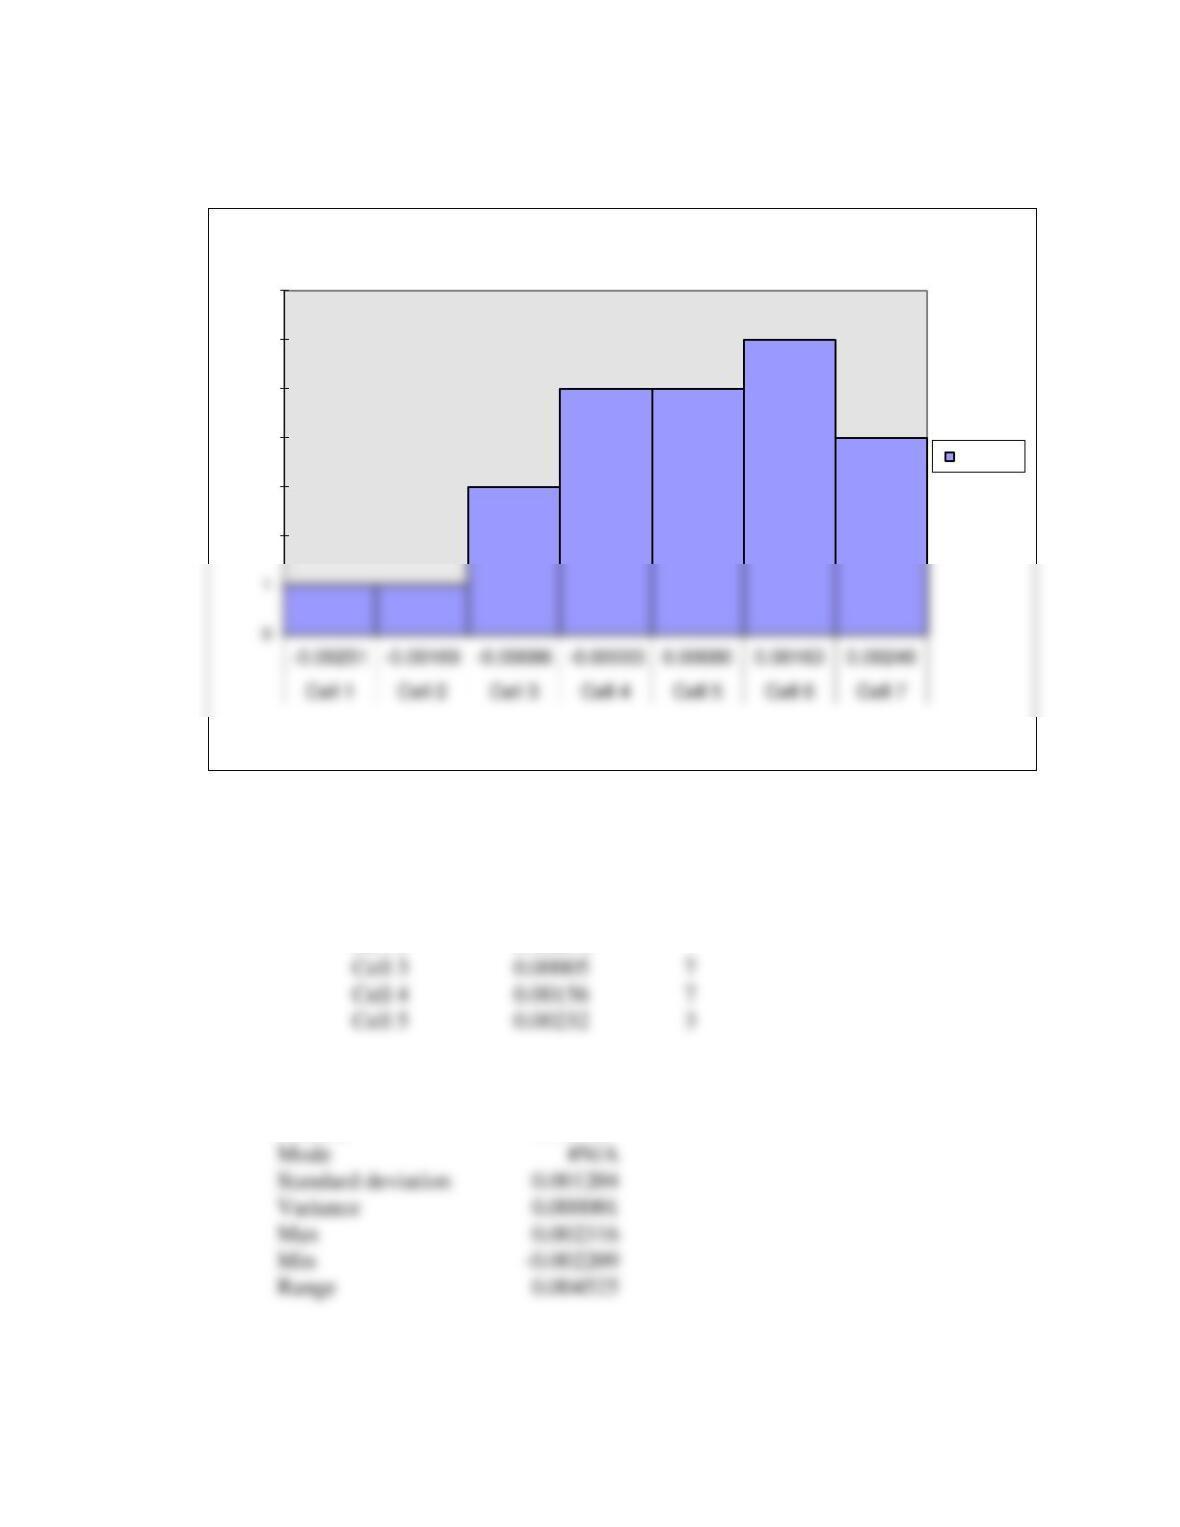
12. A genetic researcher at GenLab, Ltd. is trying to test two laboratory thermometers (that
can be read to 1/100,000th of a degree Celsius) for accuracy and precision. She measured
25 samples with each and obtained the results found in the C08Data.xlsx file for Prob. 8-
12 on the Student Companion Site for this chapter. The true temperature being measured
is 0º C. Which instrument is more accurate? Which is more precise? Which is the better
instrument?
Answer
12. Accuracy of: Thermometer A Thermometer B
Defect Categories
Pareto Chart for Beechmount Software Corp.
Chapter 8 – Measuring and Controlling Quality 32
Frequency Table – Problem 8-12a
Upper Cell
Boundaries
Frequencies
Cell 1
-0.00251
1
Cell 2
-0.00169
1
Standard Statistical Measures
Mean
0.000312
Median
0.000246
Mode
#N/A
0.001343
Variance
0.000002
Max
0.002456
Range
0.004970
Cell 3
-0.00086
3
Cell 4
-0.00003
5
Cell 5
5
Cell 6
6
Cell 7
4
Chapter 8 – Measuring and Controlling Quality 33
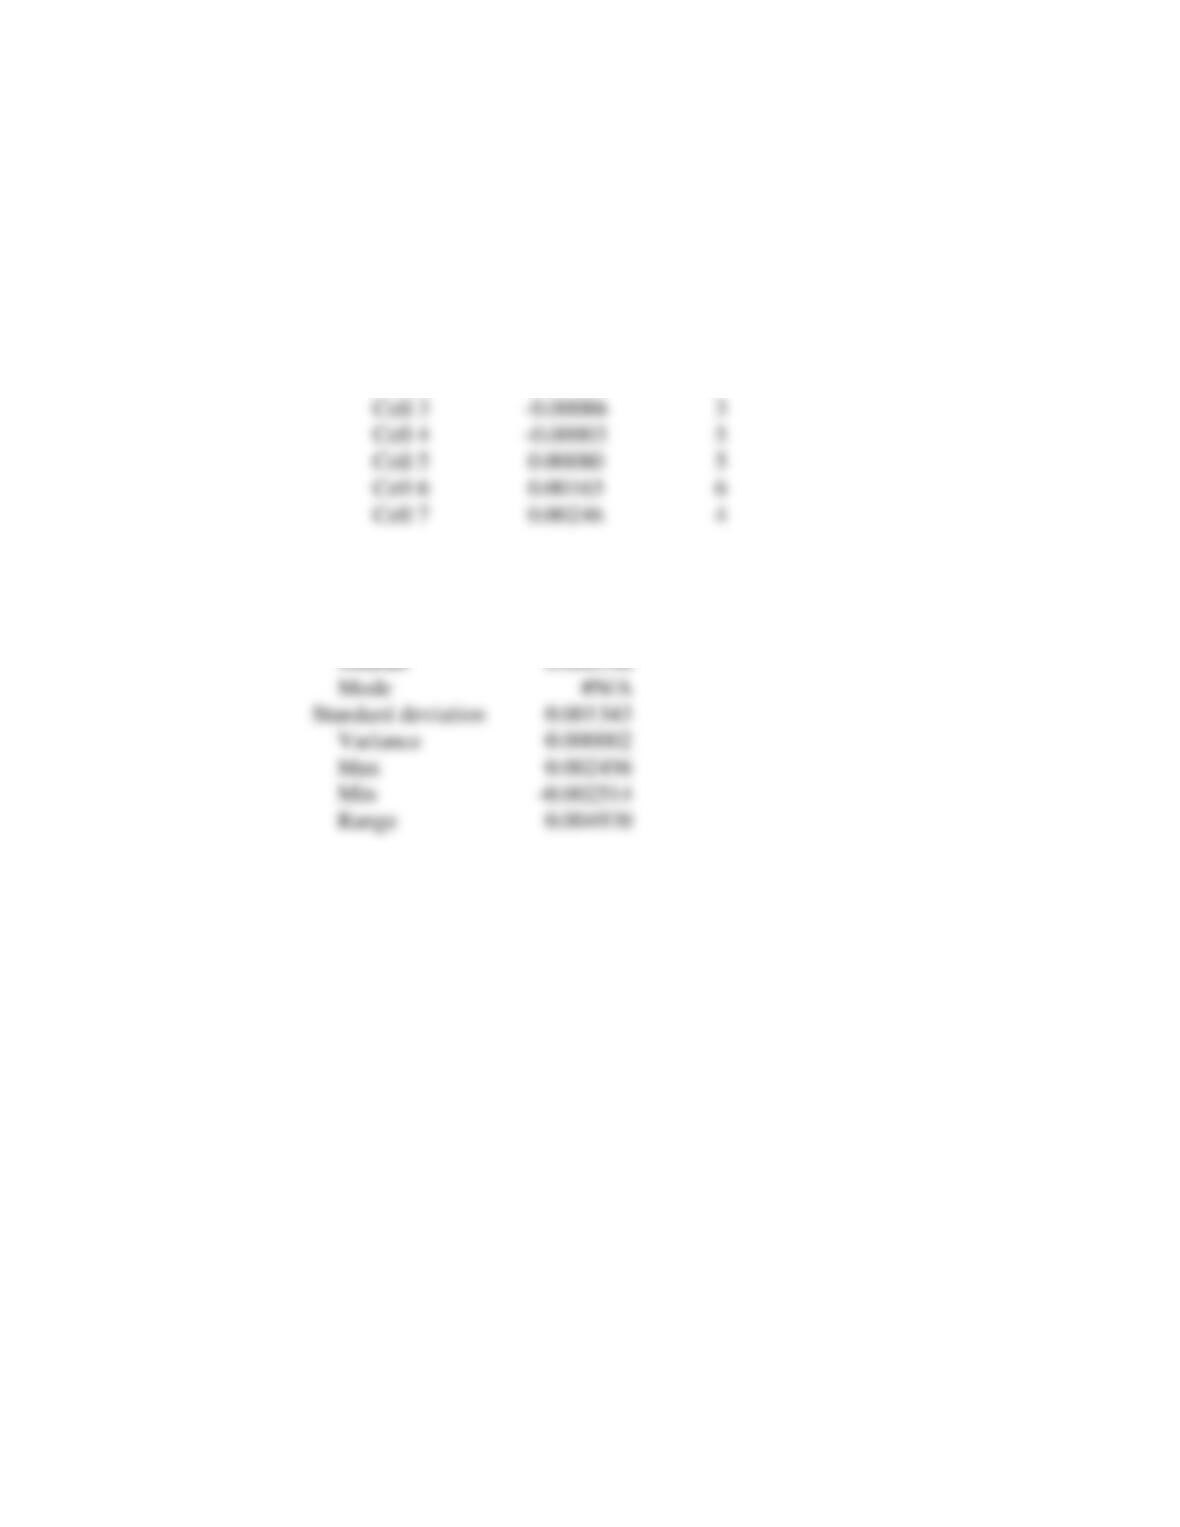
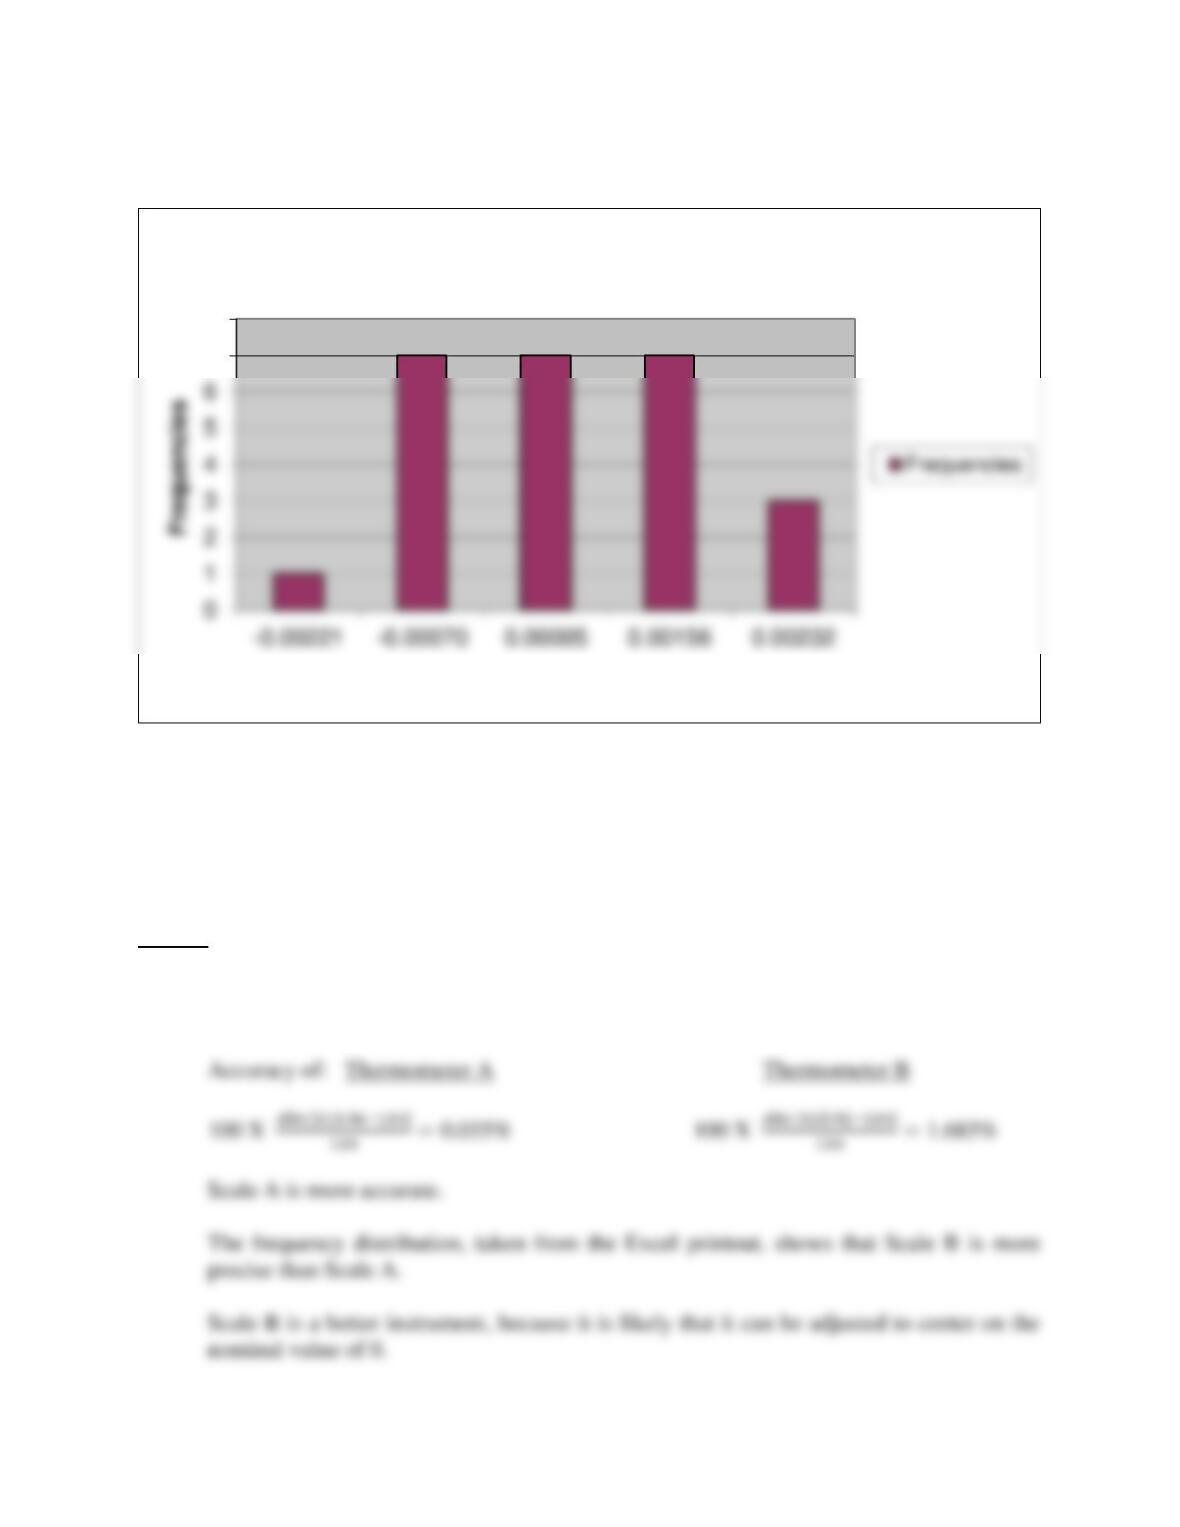
Frequency Table Problem 8-12b
Upper Cell
Boundaries
Frequencies
Cell 1
-0.00221
1
Cell 2
-0.00070
7
Standard Statistical Measures
Mean
-0.000046
Median
-0.000123
Mode
Standard deviation
Variance
Max
Min
-0.002209
Range
2
3
4
5
6
7
Frequencies
Data Cells
Frequency Distribution Problem 8–12a
Series1
Cell 3
7
Cell 4
7
Cell 5
3
Chapter 8 – Measuring and Controlling Quality 34
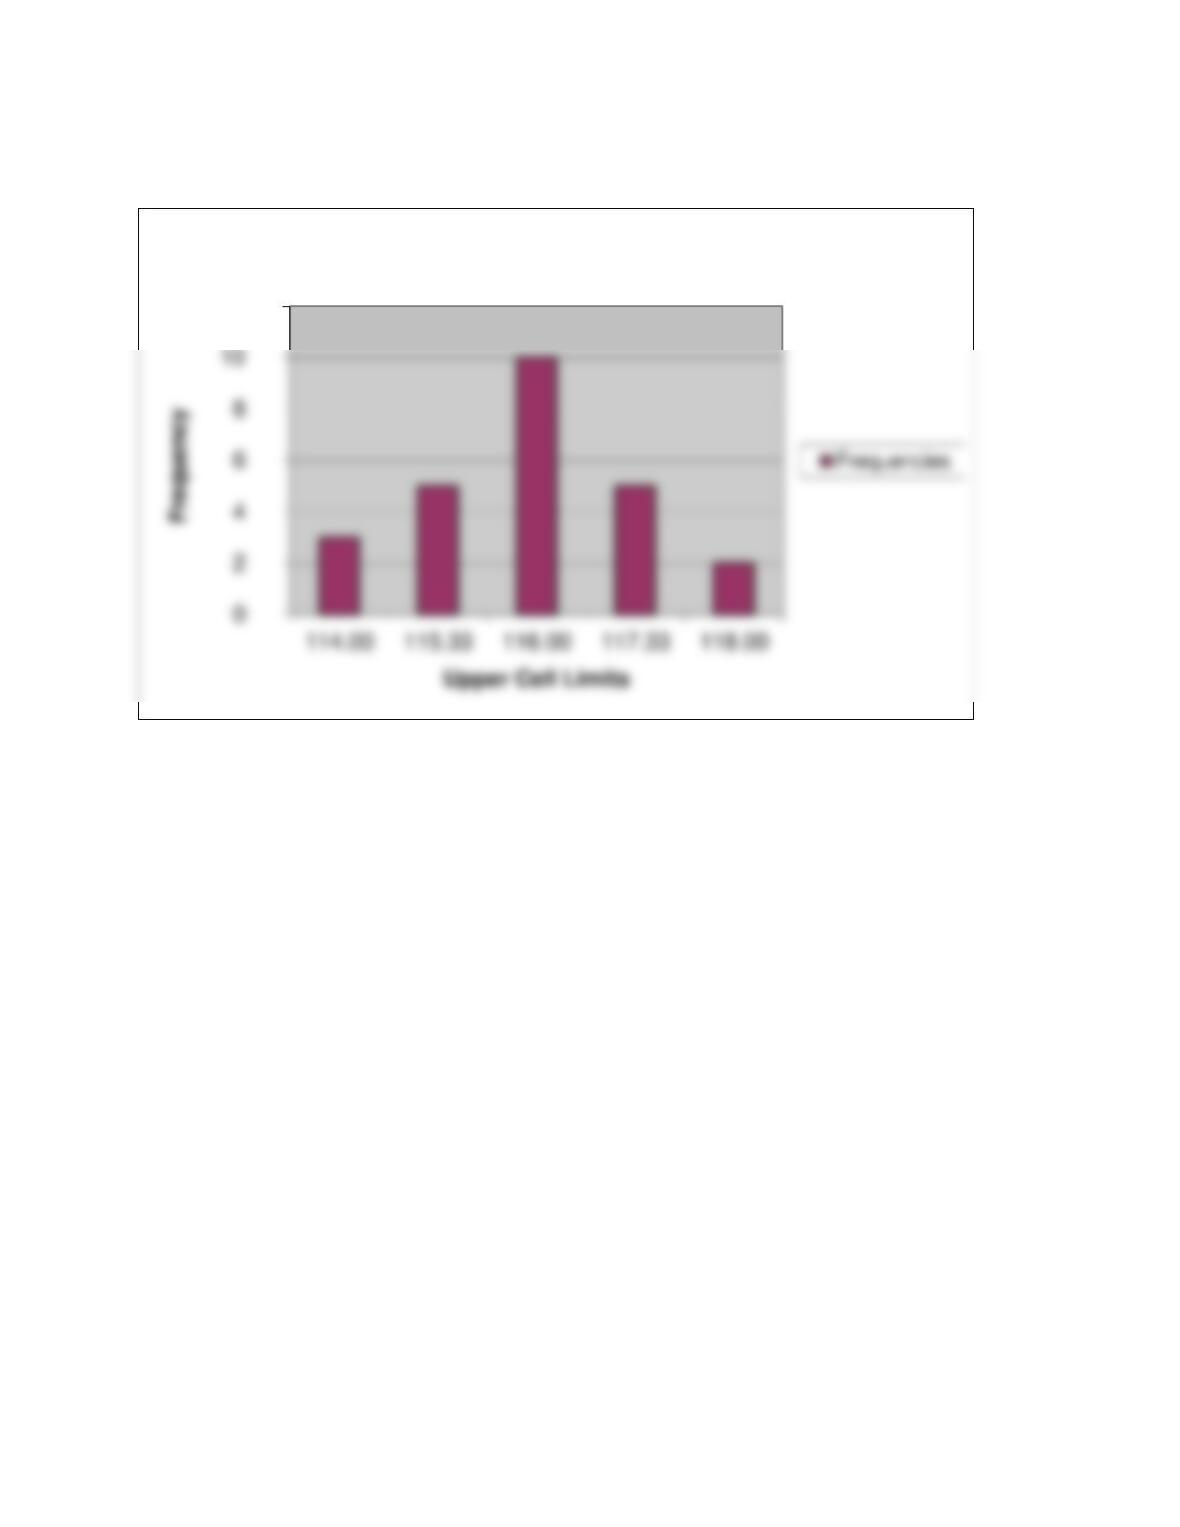
13. Two scales were at Aussieburgers, Ltd. used to weigh the same 25 samples of hamburger
patties for a fast-food restaurant in Australia. Results are shown in C08Data.xlsx file for
Prob.8-13 on the Student Companion Site for this chapter. The samples were weighed in
grams, and the supplier has ensured that each patty weighs 114 grams. Which scale is
more accurate? Which is more precise? Which is the better scale?
Answer
13. See spreadsheets Prob08-13a.xlsx and Prob08-13b.xlsx in the Instructor materials for
details.
7
8
Upper Cell Limits
Frequency Distribution – Prob. 8-12b
Chapter 8 – Measuring and Controlling Quality 35
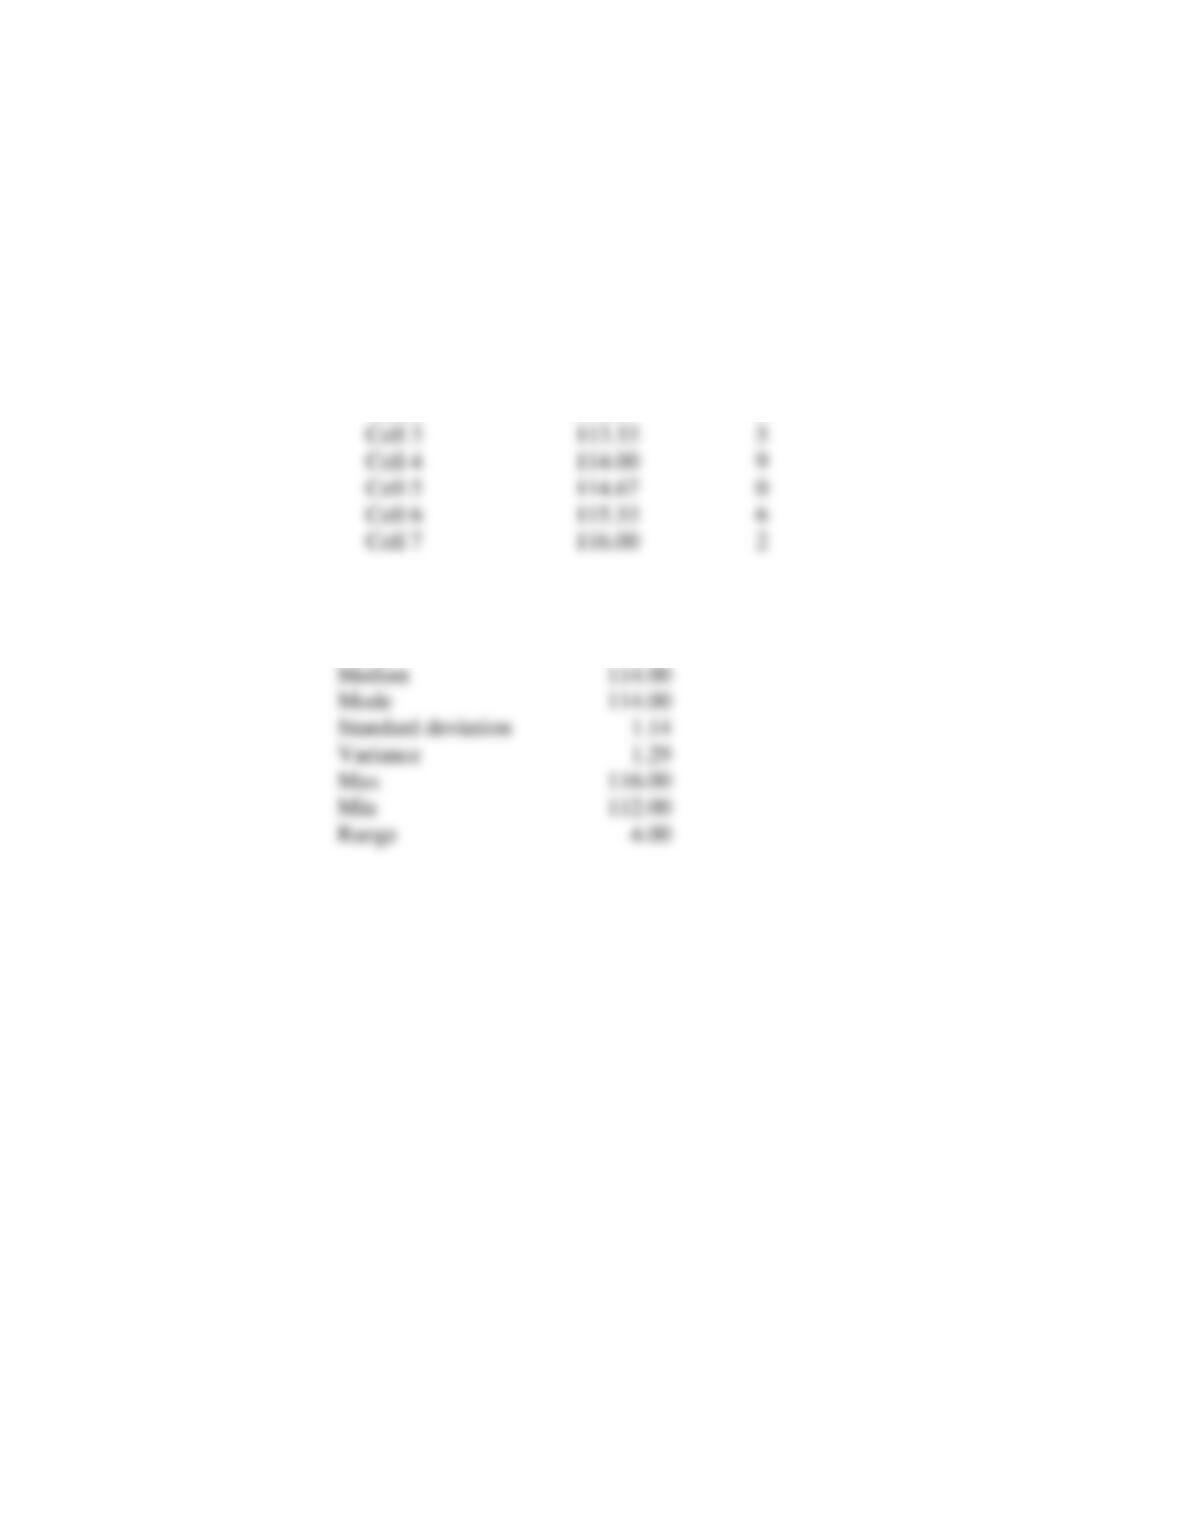
Frequency Table – Problem 8-13a
Upper Cell
Boundaries
Frequencies
Cell 1
112.00
3
Cell 2
112.67
0
Standard Statistical Measures
Mean
113.96
Median
114.00
Mode
114.00
Standard deviation
1.14
Variance
1.29
Max
116.00
Min
112.00
Range
4.00
Cell 3
113.33
5
Cell 4
114.00
9
Cell 5
114.67
0
Cell 6
115.33
6
Cell 7
116.00
2
Chapter 8 – Measuring and Controlling Quality 36
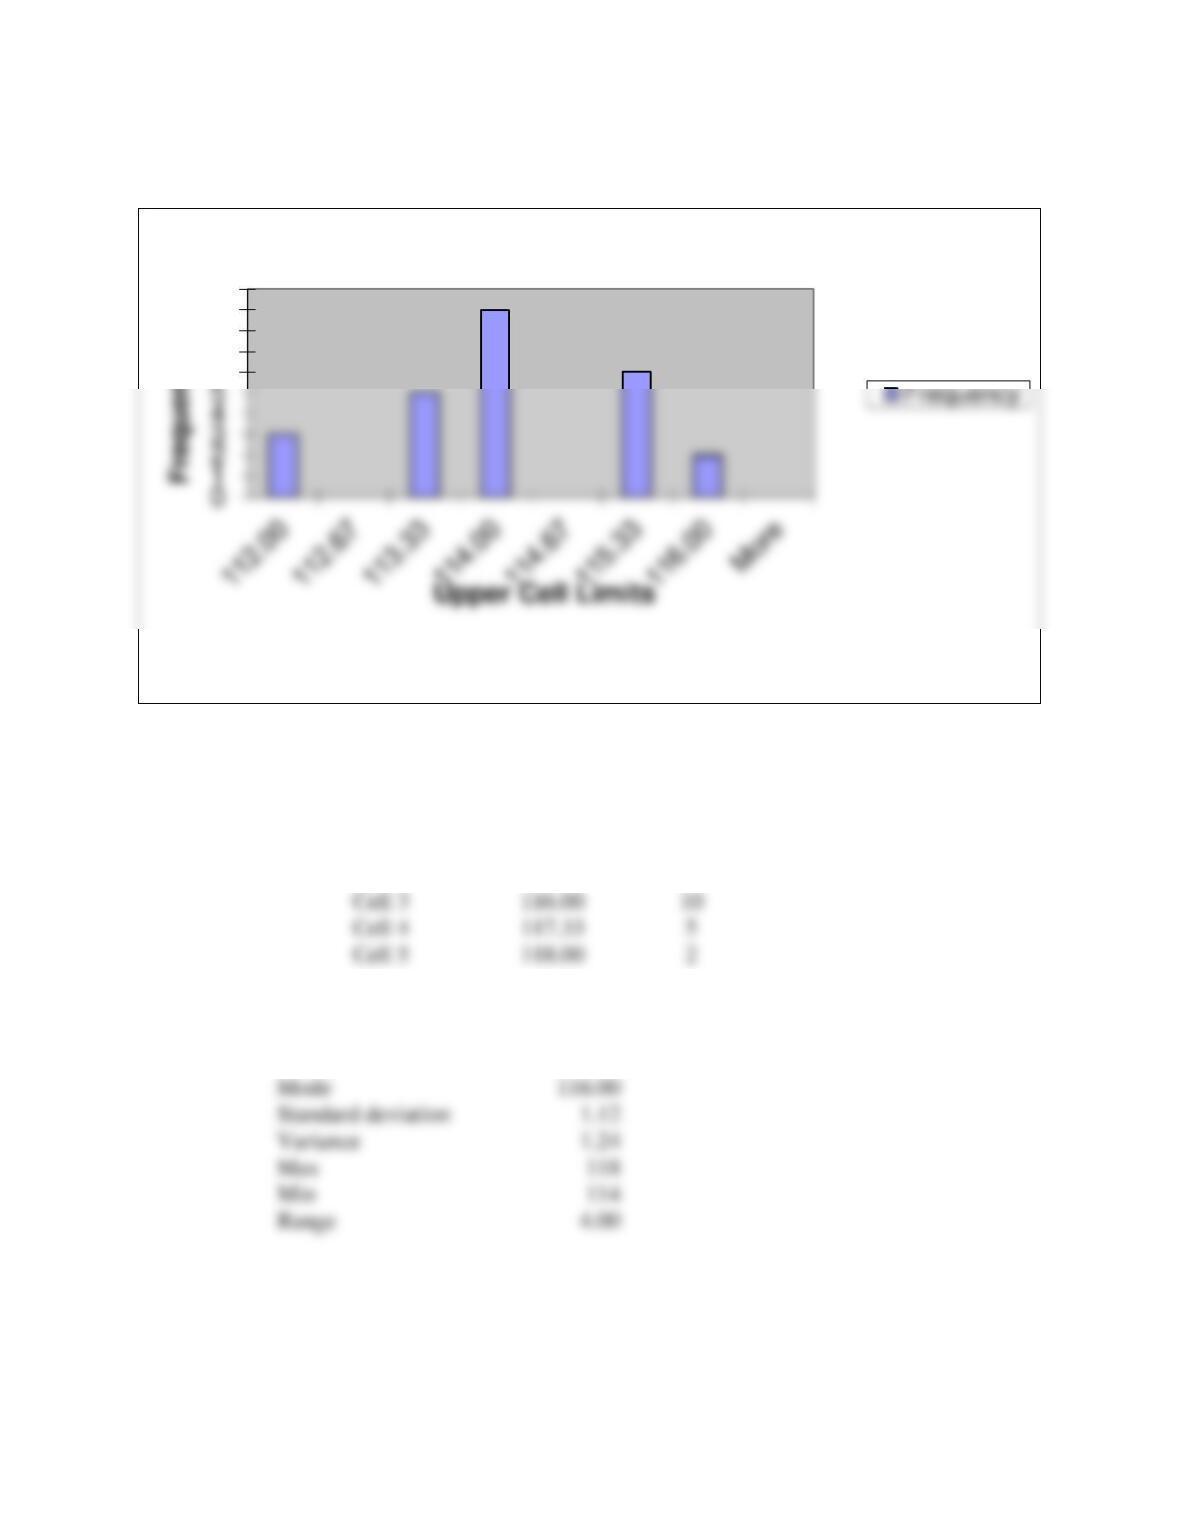
Frequency Table Problem 8-13b
Upper Cell
Boundaries
Frequencies
Cell 1
114.00
3
Cell 2
115.33
5
Standard Statistical Measures
Mean
115.92
Median
116.00
Mode
116.00
Standard deviation
Variance
Max
Min
Range
6
7
8
9
10
Frequency Distribution – Problem 8-13a
Cell 3
116.00
Cell 4
117.33
5
Cell 5
118.00
2
Chapter 8 – Measuring and Controlling Quality 37
12
Frequency Distribution – Problem 8-13b
Chapter 8 – Measuring and Controlling Quality 38
Gauge R&R
14. A gauge repeatability and reproducibility study at NEW Gauge, Inc., collected the data
for three operators, two trials, and eight parts, as found in the worksheet Prob. 8-14 in the
Excel file C08Data.xlsx on the Student Companion Site for this chapter. Analyze these
data. The part specification is 1.5 ± 0.1 inches.
Answer
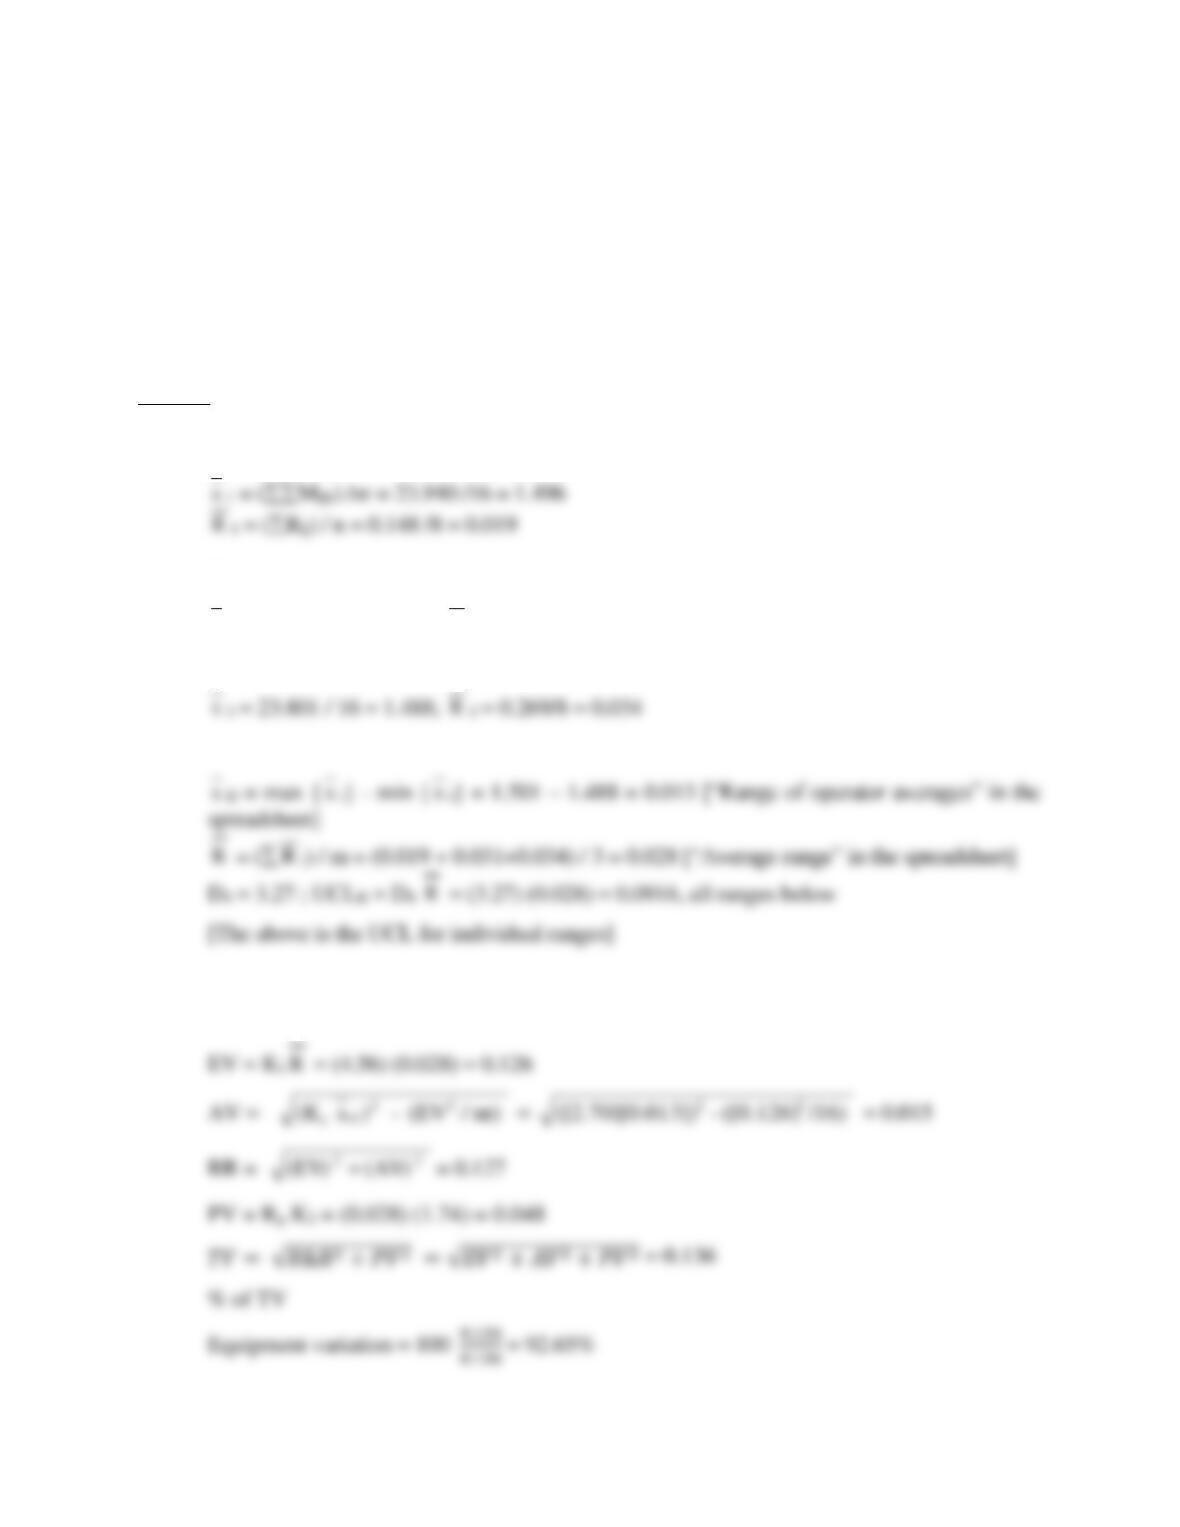
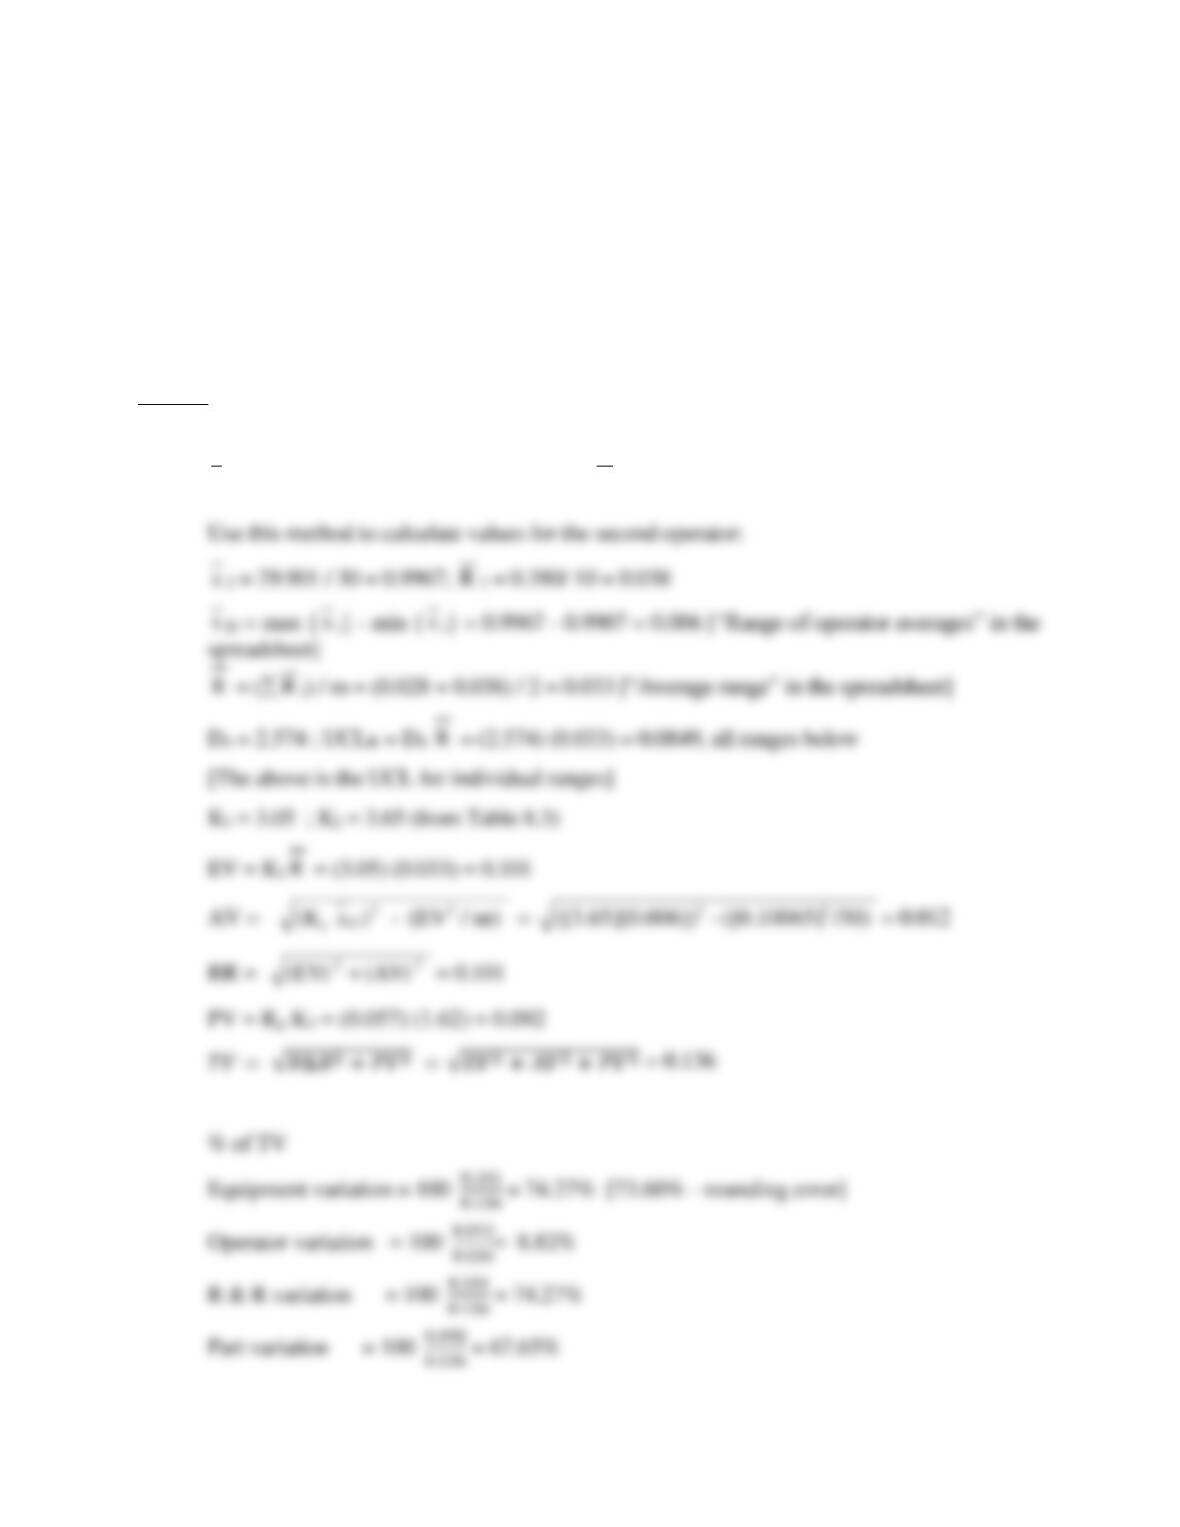
14. Detailed calculations for the first operator are as follows:
Use this method to calculate values for the second operator:
x
2 = 24.008 / 16 = 1.501;
R
2 = 0.246/8 = 0.031
Finally, to calculate values for the third operator:
x
R
x
x
K1 = 4.56; K2 = 2.70 (from Table 8.3)
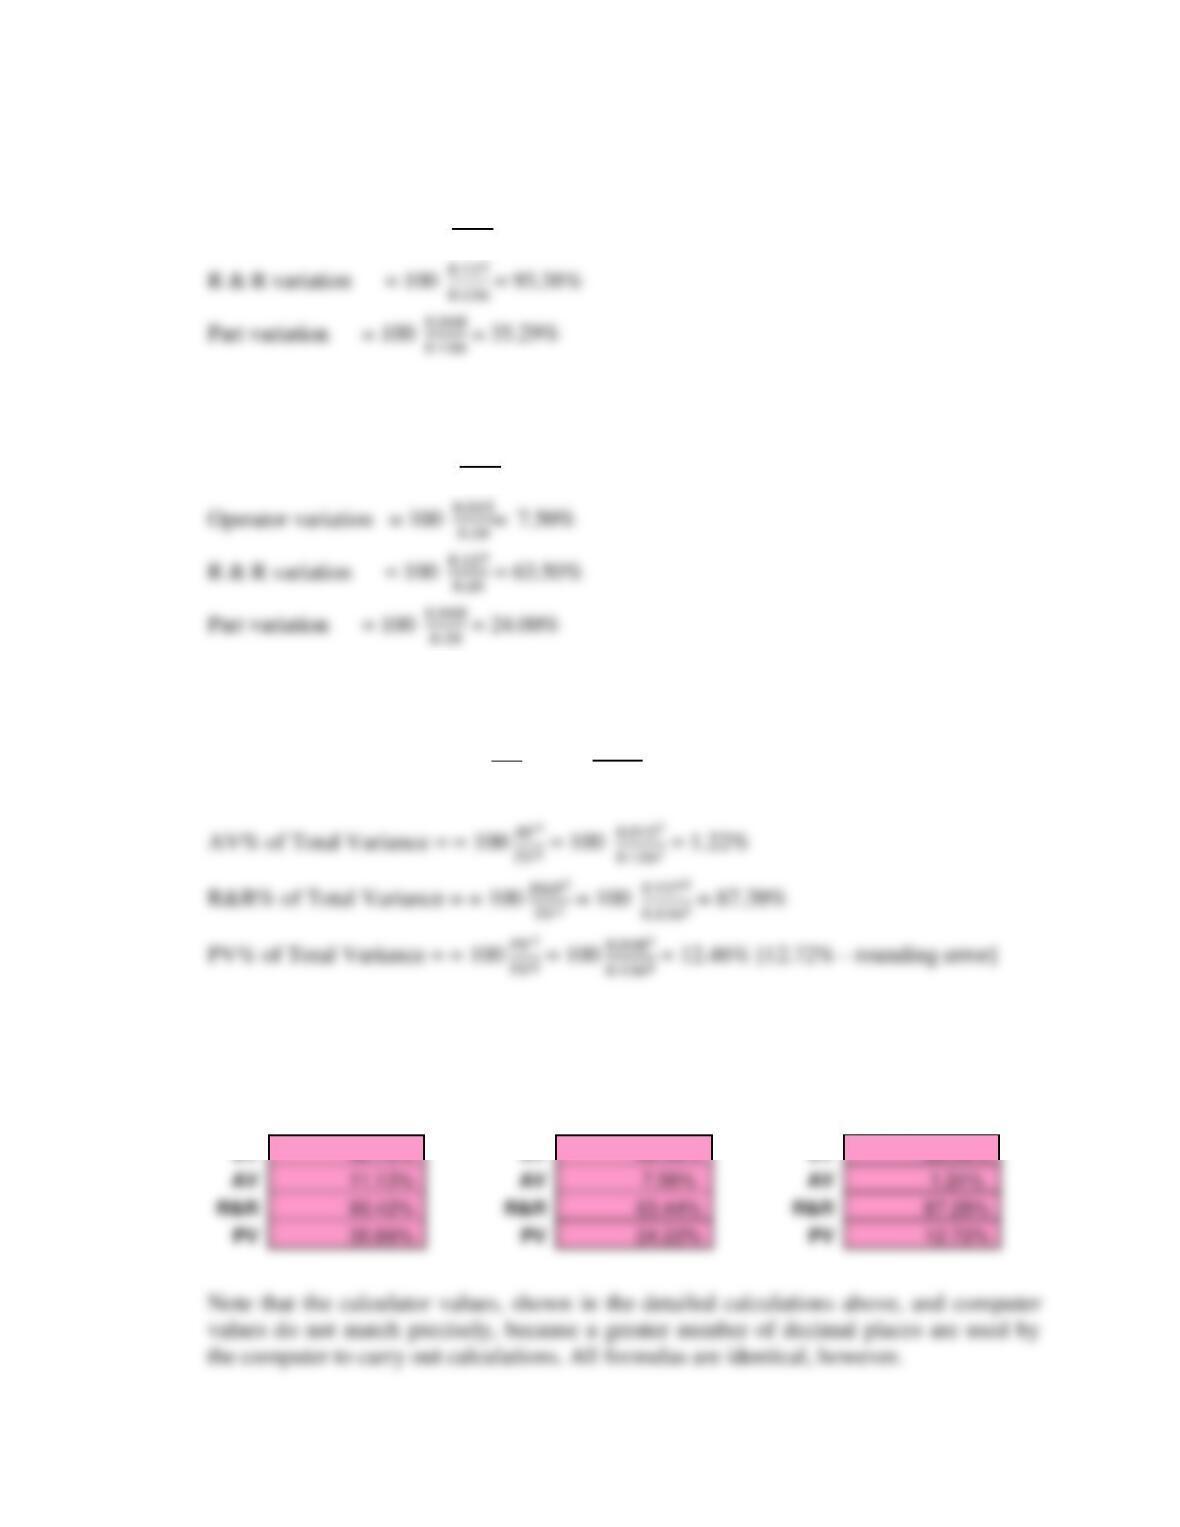
Chapter 8 – Measuring and Controlling Quality 39
Operator variation = 100 0.015
0.136= 11.03%
% of Tolerence
Equipment variation = 100 0.126
0.20 = 63.00%
Variance Ratios
EV% of Total Variance = 100 𝐸𝑉2
𝑇𝑉2 = 100 0.1262
01362 = 85.8% [86.04% – rounding error]
For detailed spreadsheet data, see Prob08-14NEWRR.xlsx in the Instructor materials.
Spreadsheet results confirm prior calculations, such as these that follow:
% of Total Variation
% of Tolerance
Variance Ratios
Chapter 8 – Measuring and Controlling Quality 40
15. A gauge repeatability and reproducibility study at Frankford Brake Systems collected the
data found in the worksheet Prob. 8-15 in the Excel file C08Data.xlsx on the Student
Companion Site for this chapter. Analyze these data. The part specification is 1.0 ± 0.06
mm.
Answer
15. Detailed calculations for the first operator are as follows:
x
1 = (Mijk) /nr = 29.720 / 30 = 0.9907;
R
1 = (Rij) / n = 0.280 / 10 = 0.028