Chapter 8 – Measuring and Controlling Quality 41
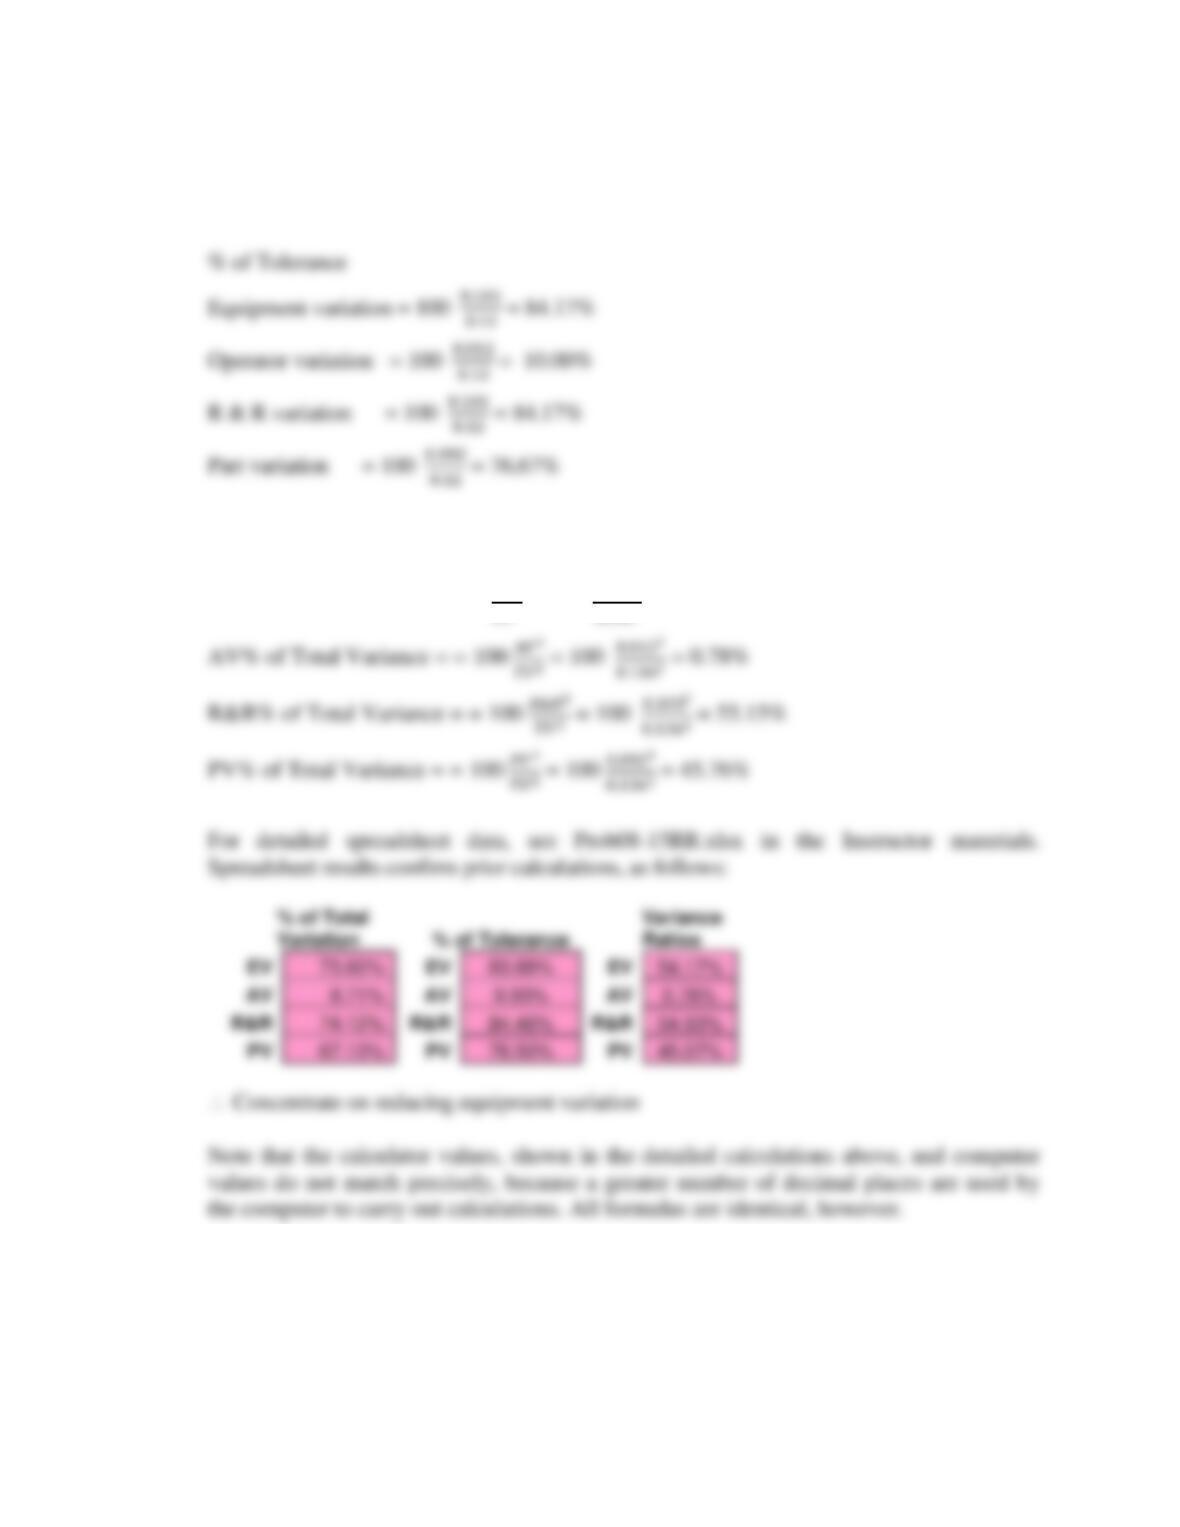
Variance Ratios
EV% of Total Variance = 100 𝐸𝑉2
𝑇𝑉2 = 100 0.1012
01362 = 55.15% [54.17% – rounding error]
16. A gauge repeatability and reproducibility study was made at Precision Parts, Inc., using
three operators, taking three trials each on identical parts. The data that can be found in
the worksheet tab Prob. 8-16 in the Excel file C08Data.xlsx on the Student Companion
Site for this chapter were collected. Do you see any problems after analyzing these data?
What should be done? The part specification for the collar that was measured was 1.6 ±
Chapter 8 – Measuring and Controlling Quality 42
0.2 inches.
Answer
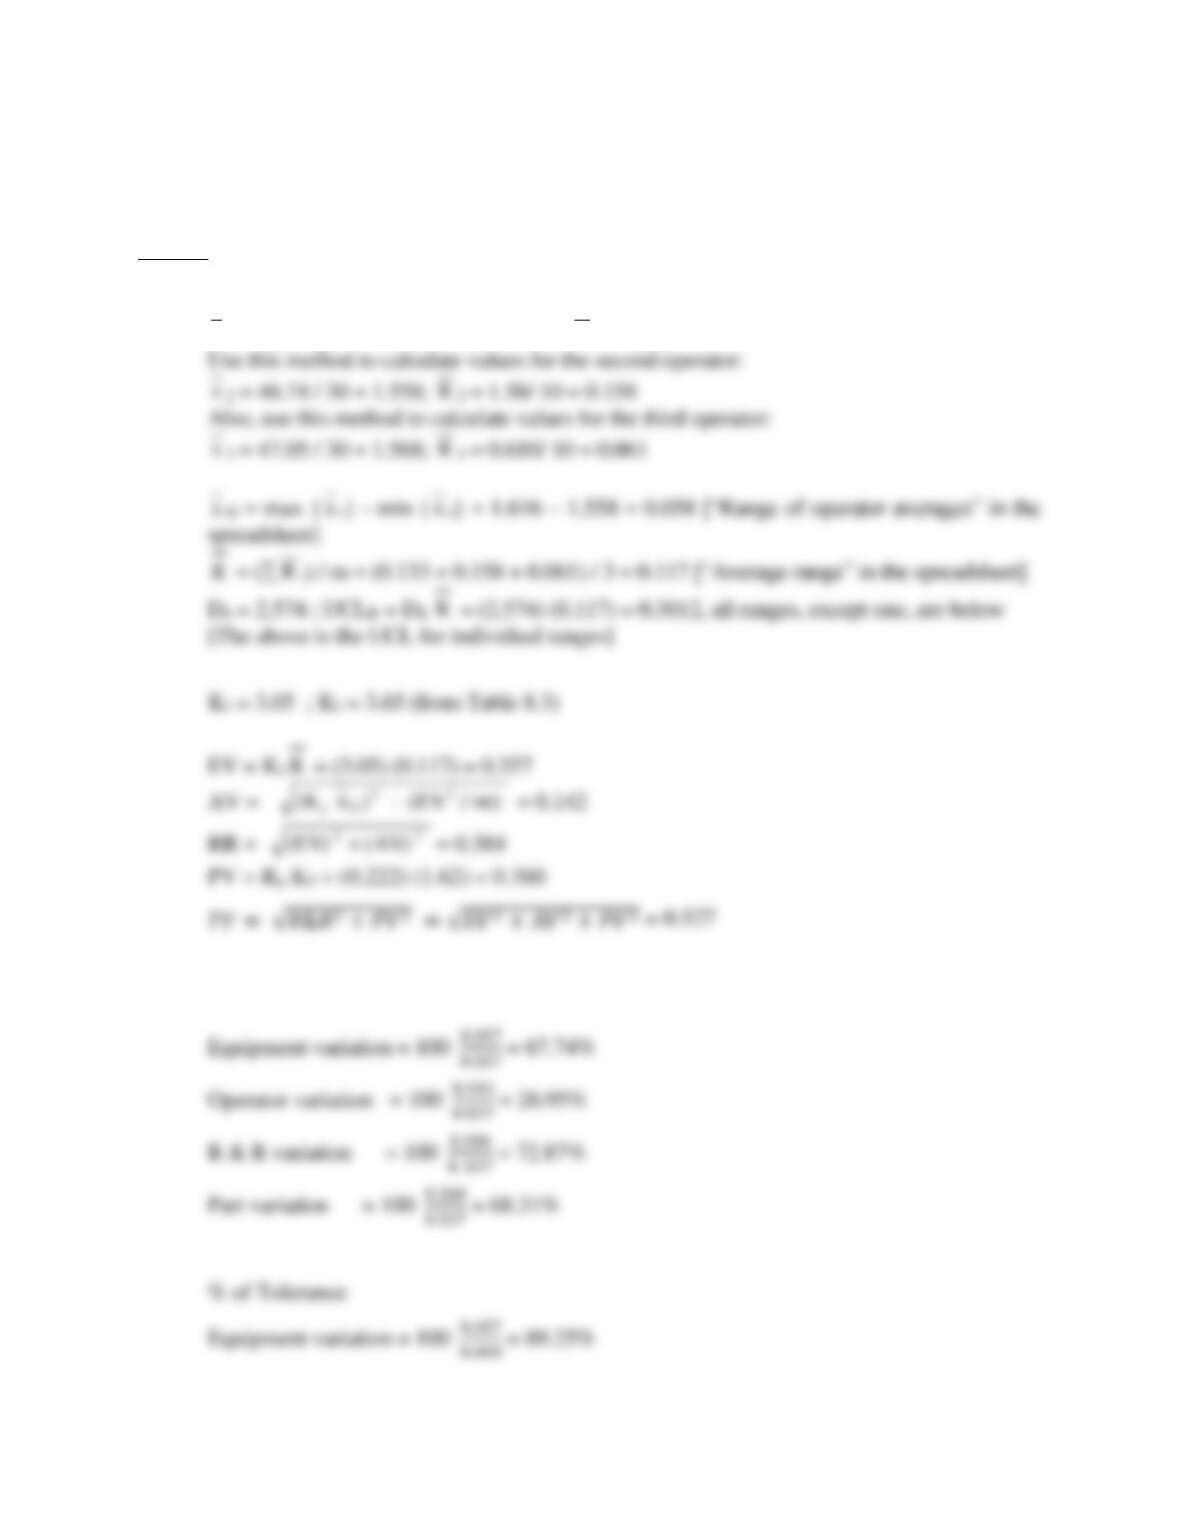
16. Detailed calculations for the first operator are as follows:
x
1 = (Mijk) /nr = 48.48 / 30 = 1.616;
R
1 = (Rij) / n = 1.33 / 10 = 0.133
% of TV
x
R
R
Chapter 8 – Measuring and Controlling Quality 43
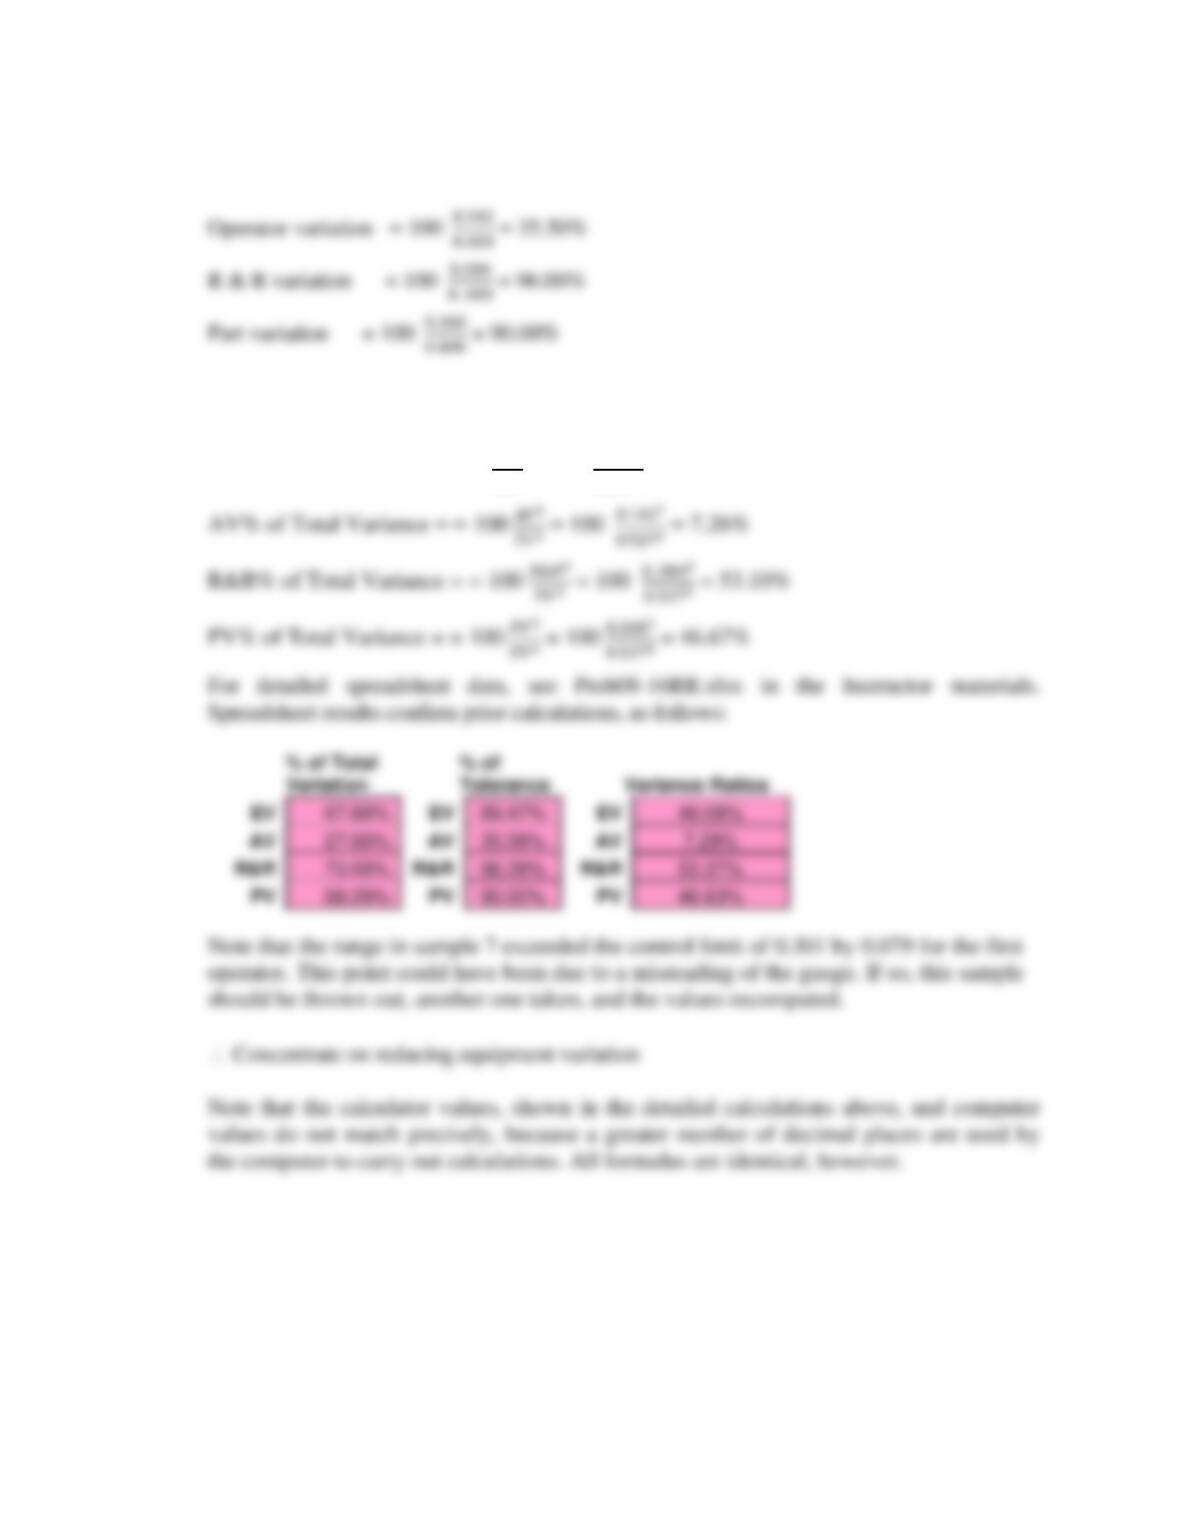
Variance Ratios
EV% of Total Variance = 100 𝐸𝑉2
𝑇𝑉2 = 100 0.3572
0.5272 = 45.89% [46.08% – rounding error]
Process Capability
17. A machining process at the Mach4 Tool Co. has a required dimension on a part of 0.575
± 0.007 inch. Twenty-five parts each were measured as found in the worksheet tab Prob.
8-17 in the Excel file C08Data.xlsx on the Student Companion Site for this chapter. What
is its capability for producing within acceptable limits?
Chapter 8 – Measuring and Controlling Quality 44
Answer
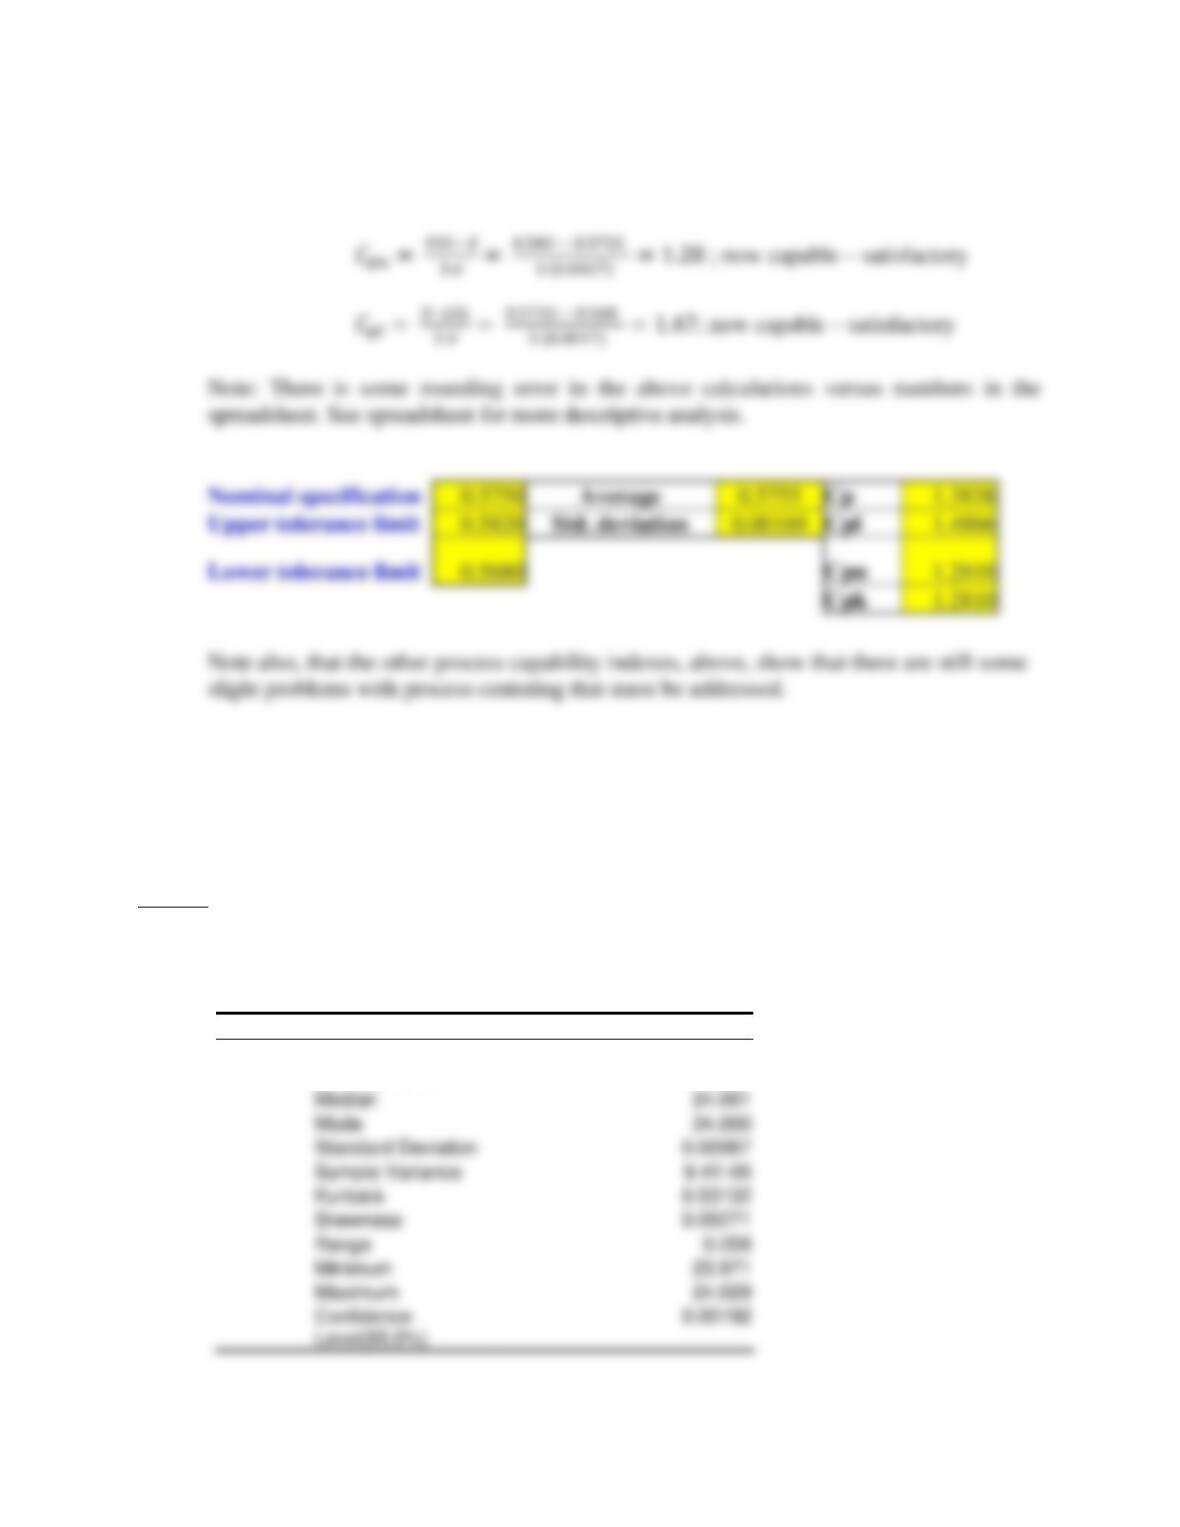
17. For sample statistics at Mach4 Tool Co. of:
x
= 0.5740; = 0.0067 and a tolerance of
0.575 ± 0.007.
Note: There is some rounding error in the above calculations versus numbers in the spreadsheet.
18. Adjustments were made in the process at the Mach4 Tool Co. discussed in Problem 17
and 25 more samples were taken. The results are given in the worksheet tab Prob. 8-18 in
the Excel file C08Data.xlsx on the Student Companion Site for this chapter. What can
you observe about the process? Is it now capable of producing within acceptable limits?
Answer
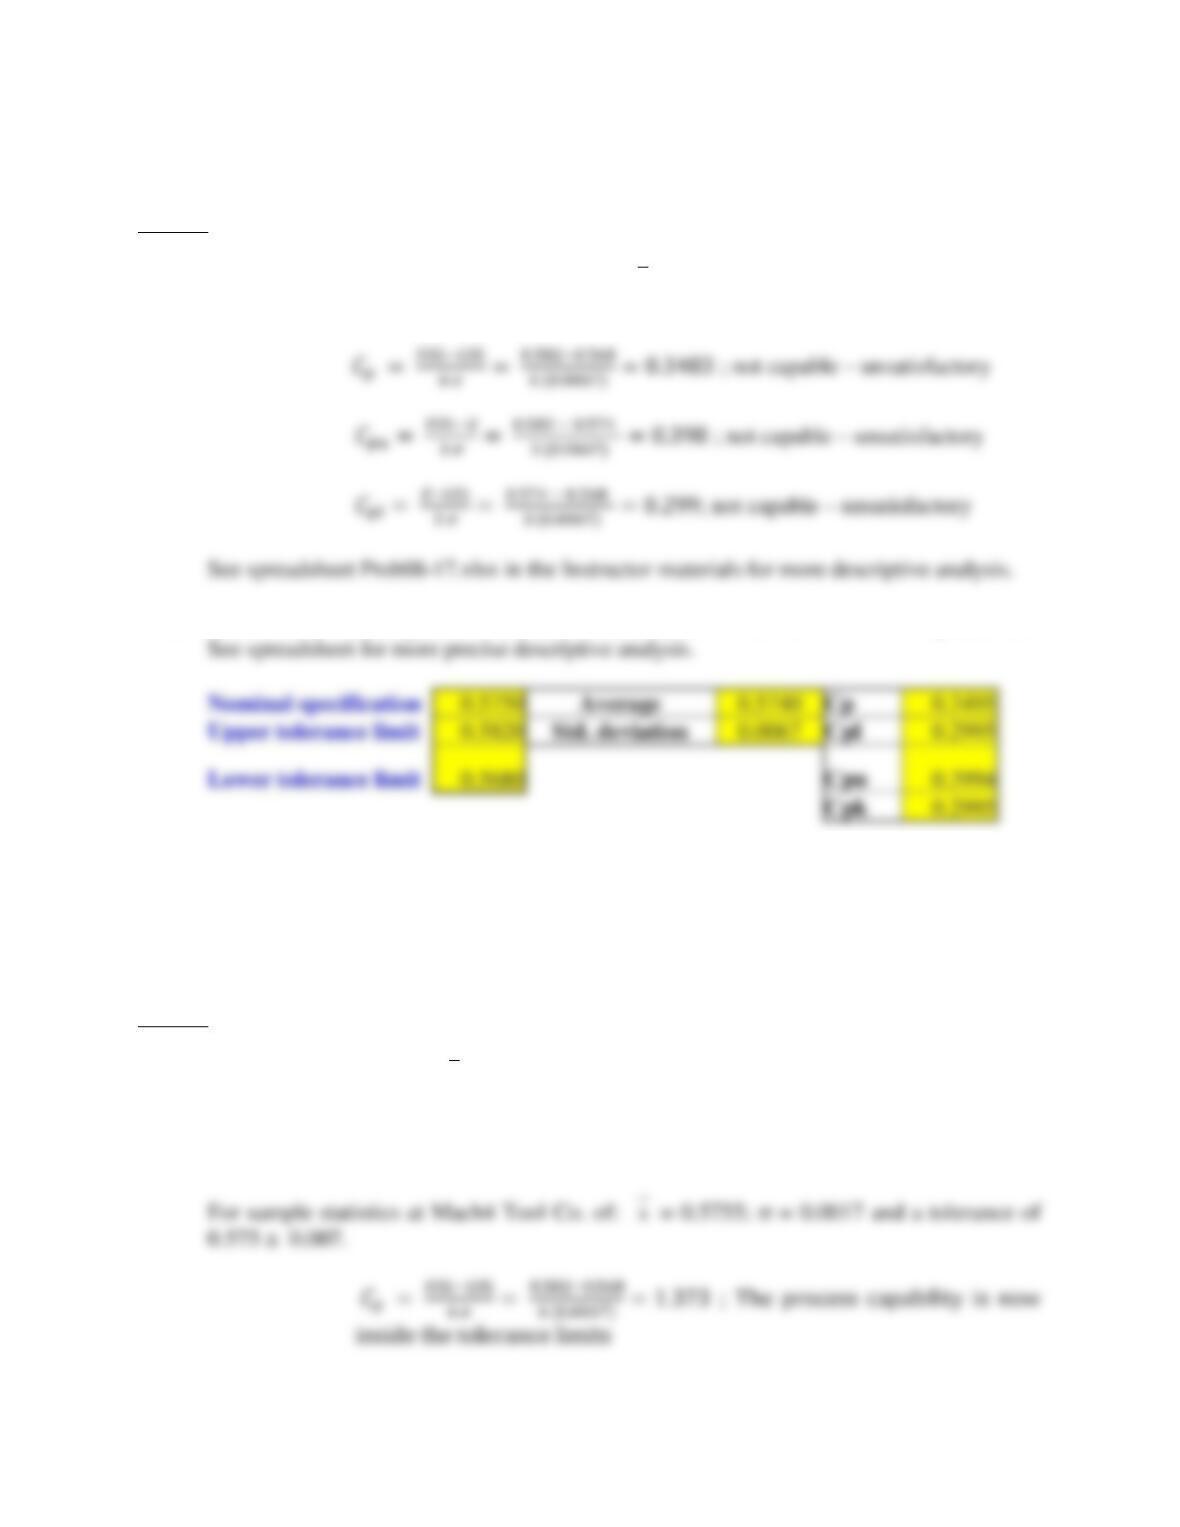
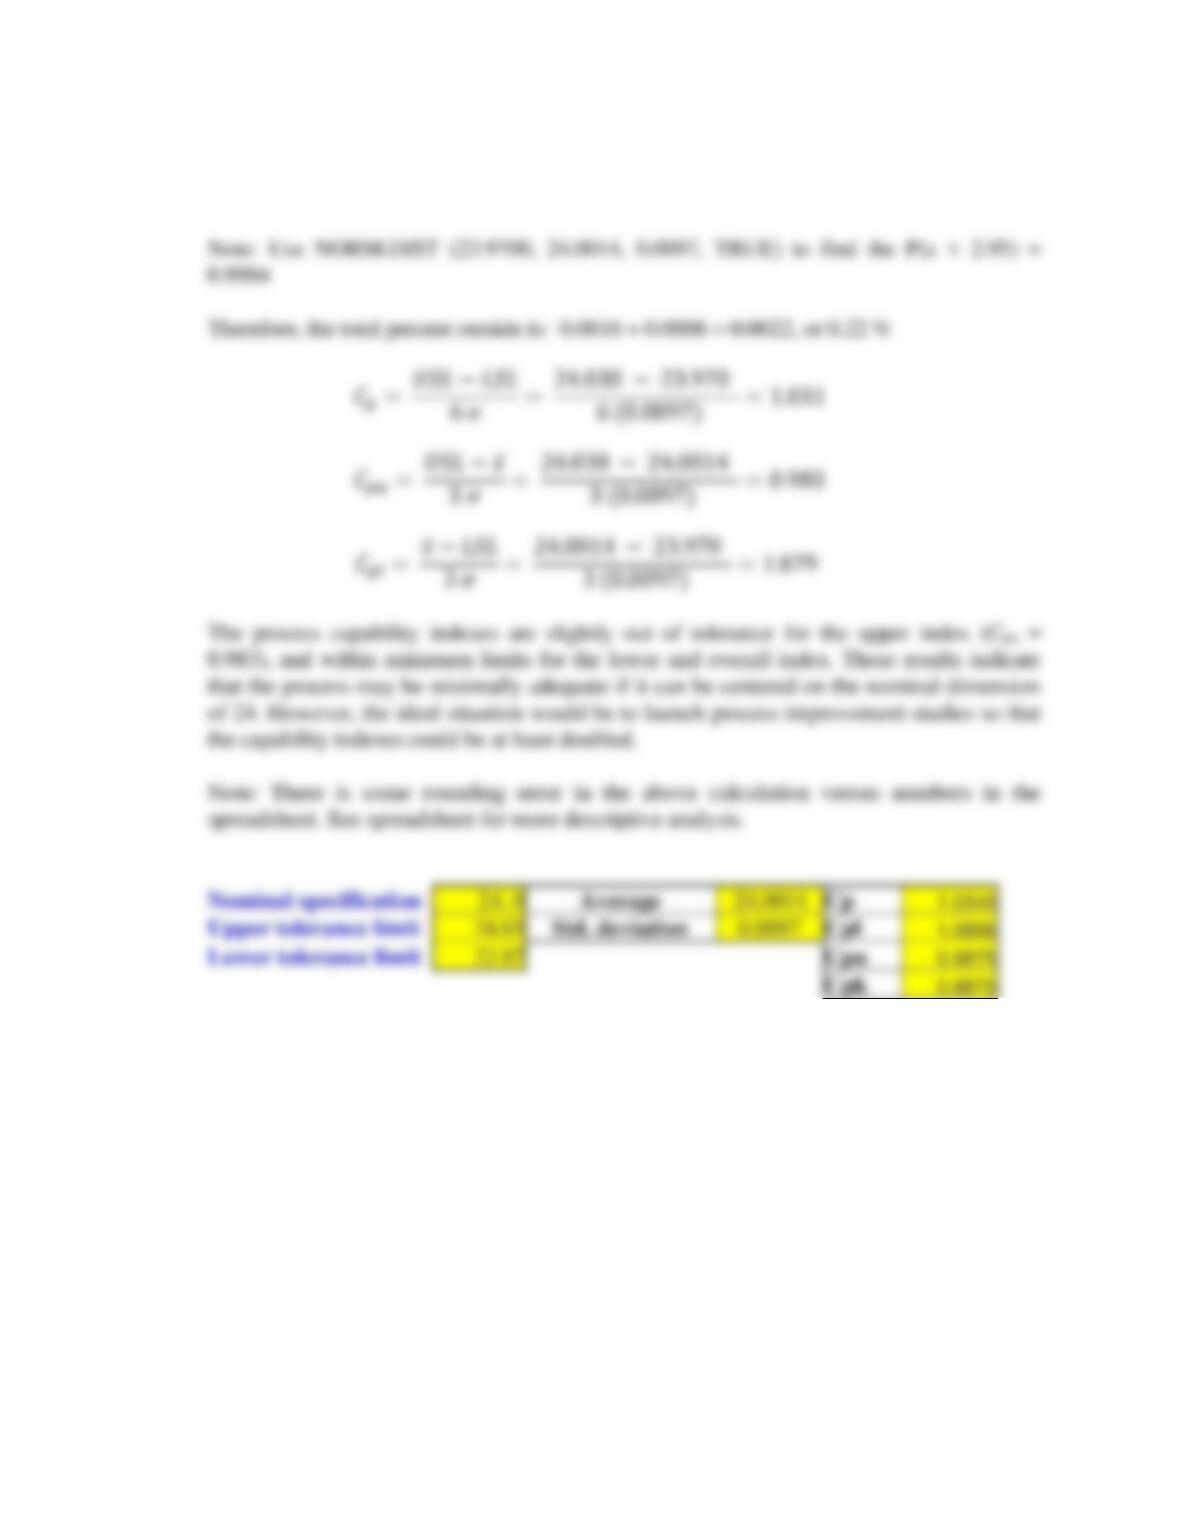
18. For sample statistics of:
x
= 0.5755; = 0.0017 and a tolerance of 0.575 ± 0.007
The standard deviation is smaller than previously, indicating less “spread” within the
data. See spreadsheet Prob08-17.xlsx in the Instructor materials for more descriptive
analysis.
x
Chapter 8 – Measuring and Controlling Quality 45
19. From the data for Kermit Theatrical Products, construct a histogram and estimate the
process capability. If the specifications are 24 ± 0.03, estimate the percentage of parts
that will be nonconforming. Finally, compute Cp, Cpu, and Cpl. Samples for five parts
were taken as shown in the worksheet tab Prob. 8-19 in the Excel file C08Data.xlsx on
the Student Companion Site for this chapter.
Answer
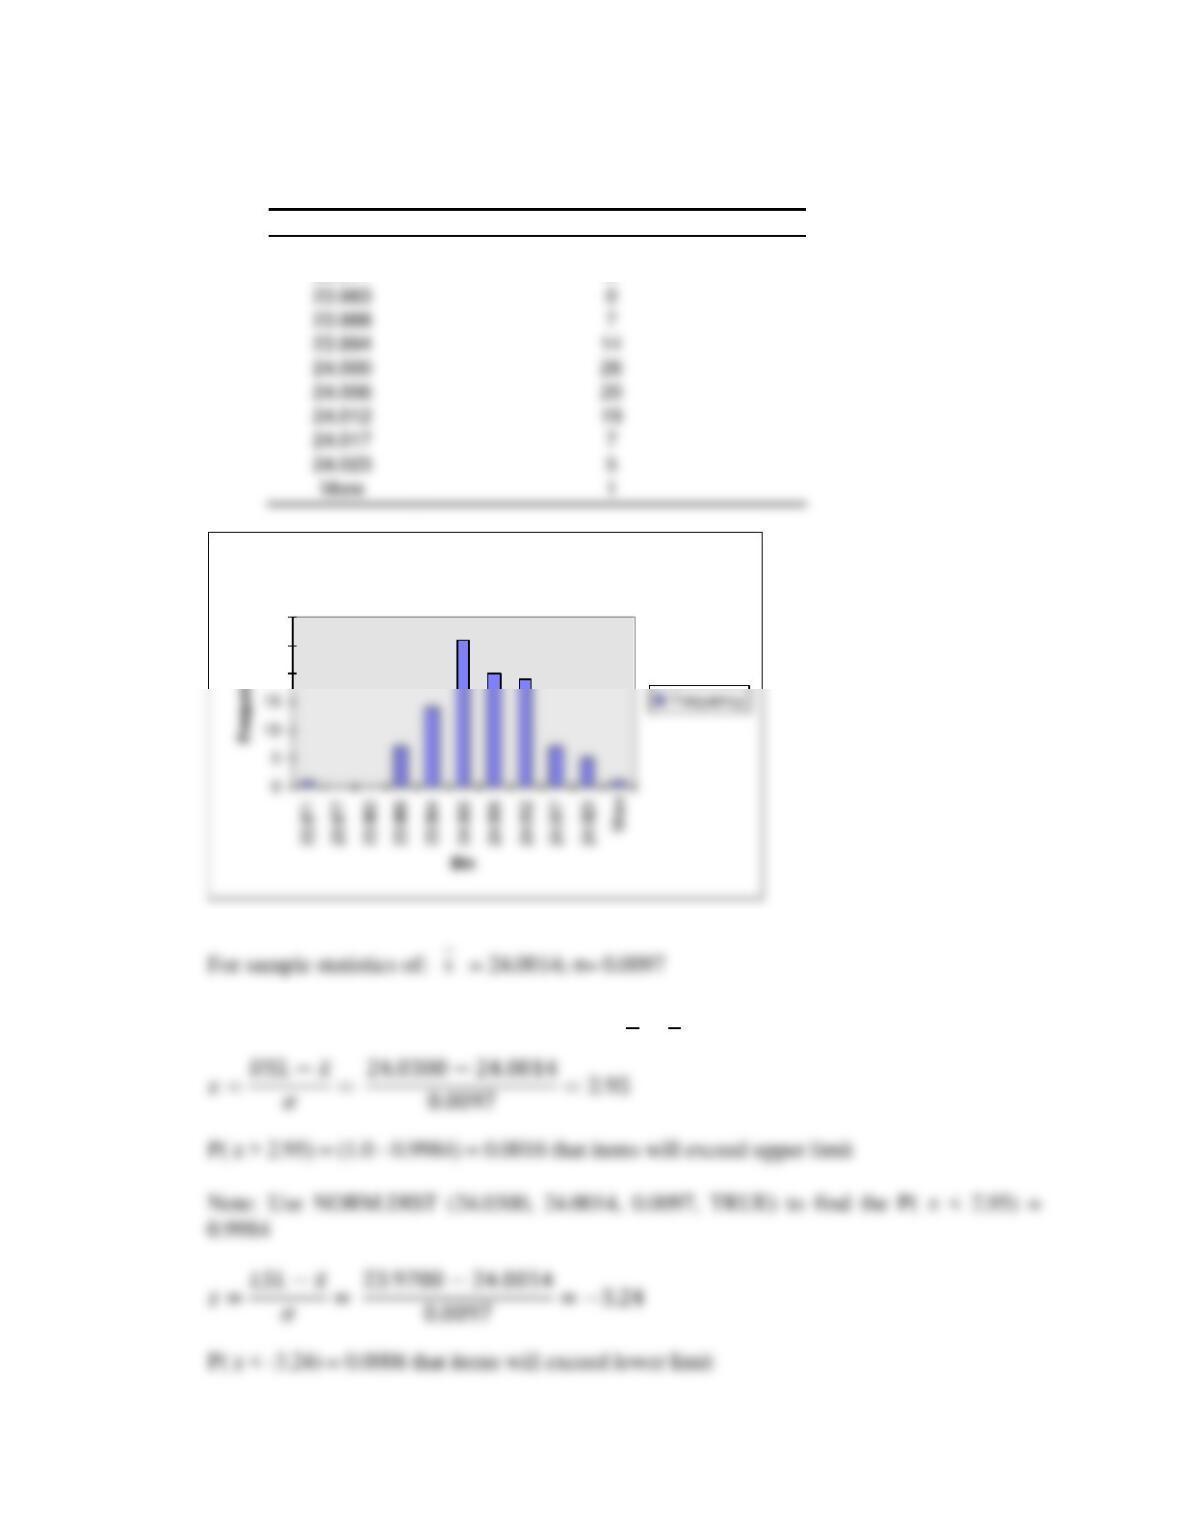
19. Summary statistics and the histogram from spreadsheet Prob8-19.xlsx in the Instructor
materials show:
Column 1
Mean
24.0014
Standard Error
0.00097
Kurtosis
0.53132
Skewness
0.05271
Chapter 8 – Measuring and Controlling Quality 46
Bin
Frequency
23.971
1
23.977
0
Histogram
20
25
30
Specification limits for the process are: 23.97 < µ < 24.03
23.983
0
24.000
24.006
24.012
24.017
7
Chapter 8 – Measuring and Controlling Quality 47
20. Samples for three parts made at River City Parts Co. were taken as shown in the
worksheet tab Prob. 8-20 in the Excel file C08Data.xlsx on the Student Companion Site
for this chapter. Data set 1 is for part 1, data set 2 is for part 2, and data set 3 is for part 3.
a. Calculate the mean and standard deviations for each part and compare them to the
following specification limits:
Part Nominal Tolerance
1 1.750 ± 0.045
2 2.000 ± 0.060
3 1.250 ± 0.030
b. Will the production process permit an acceptable fit of all parts into a slot with a
specification of 5 ± 0.081 at least 99.73 percent of the time?
Chapter 8 – Measuring and Controlling Quality 48
Answer
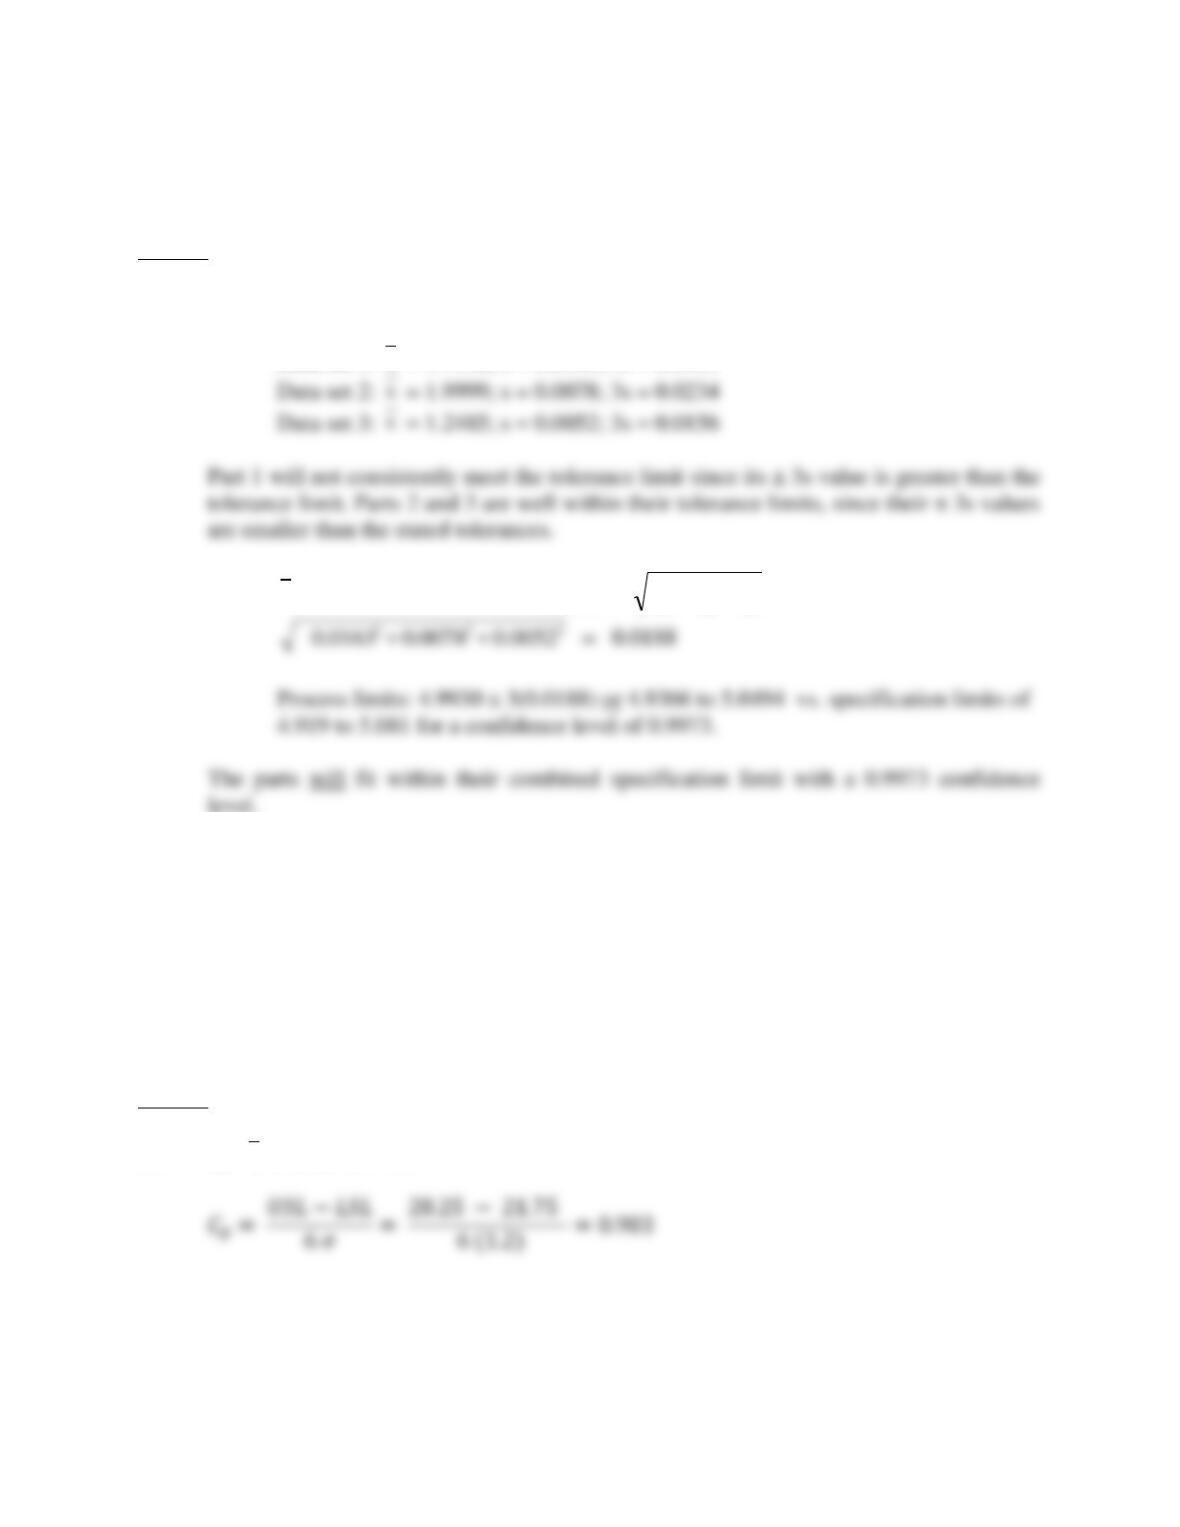
20. a) Sample statistics as shown in spreadsheet Prob.08-20.xlsx in the Instructor materials
are:
Data set 1:
x
= 1.7446; s = 0.0163; 3s = 0.0489
b)
x
T = 4.9930 ; Estimated Process =
sss 2
3
2
2
2
1++
=
level.
21. Suppose that a refrigeration process at Coolfoods, Ltd., has a normally distributed output
with a mean of 25.0 and a variance of 1.44.
a. If the specifications are 25.0 ± 3.25, compute Cp, Cpk, and Cpm. Is the process capable
and centered?
b. Suppose the mean shifts to 23.0 but the variance remains unchanged. Recompute and
interpret these process capability indexes.
c. If the variance can be reduced to 40 percent of its original value, how do the process
capability indices change (using the original mean of 25.0)?
Answer
21. (a)
x
= 25.0; = 1.2
x
Chapter 8 – Measuring and Controlling Quality 49
(b)
x
= 23; = 1.2
(c) 2
new = 0.4 (1.2) 2 = 0.576 new = √0.576=0.759
Chapter 8 – Measuring and Controlling Quality 50
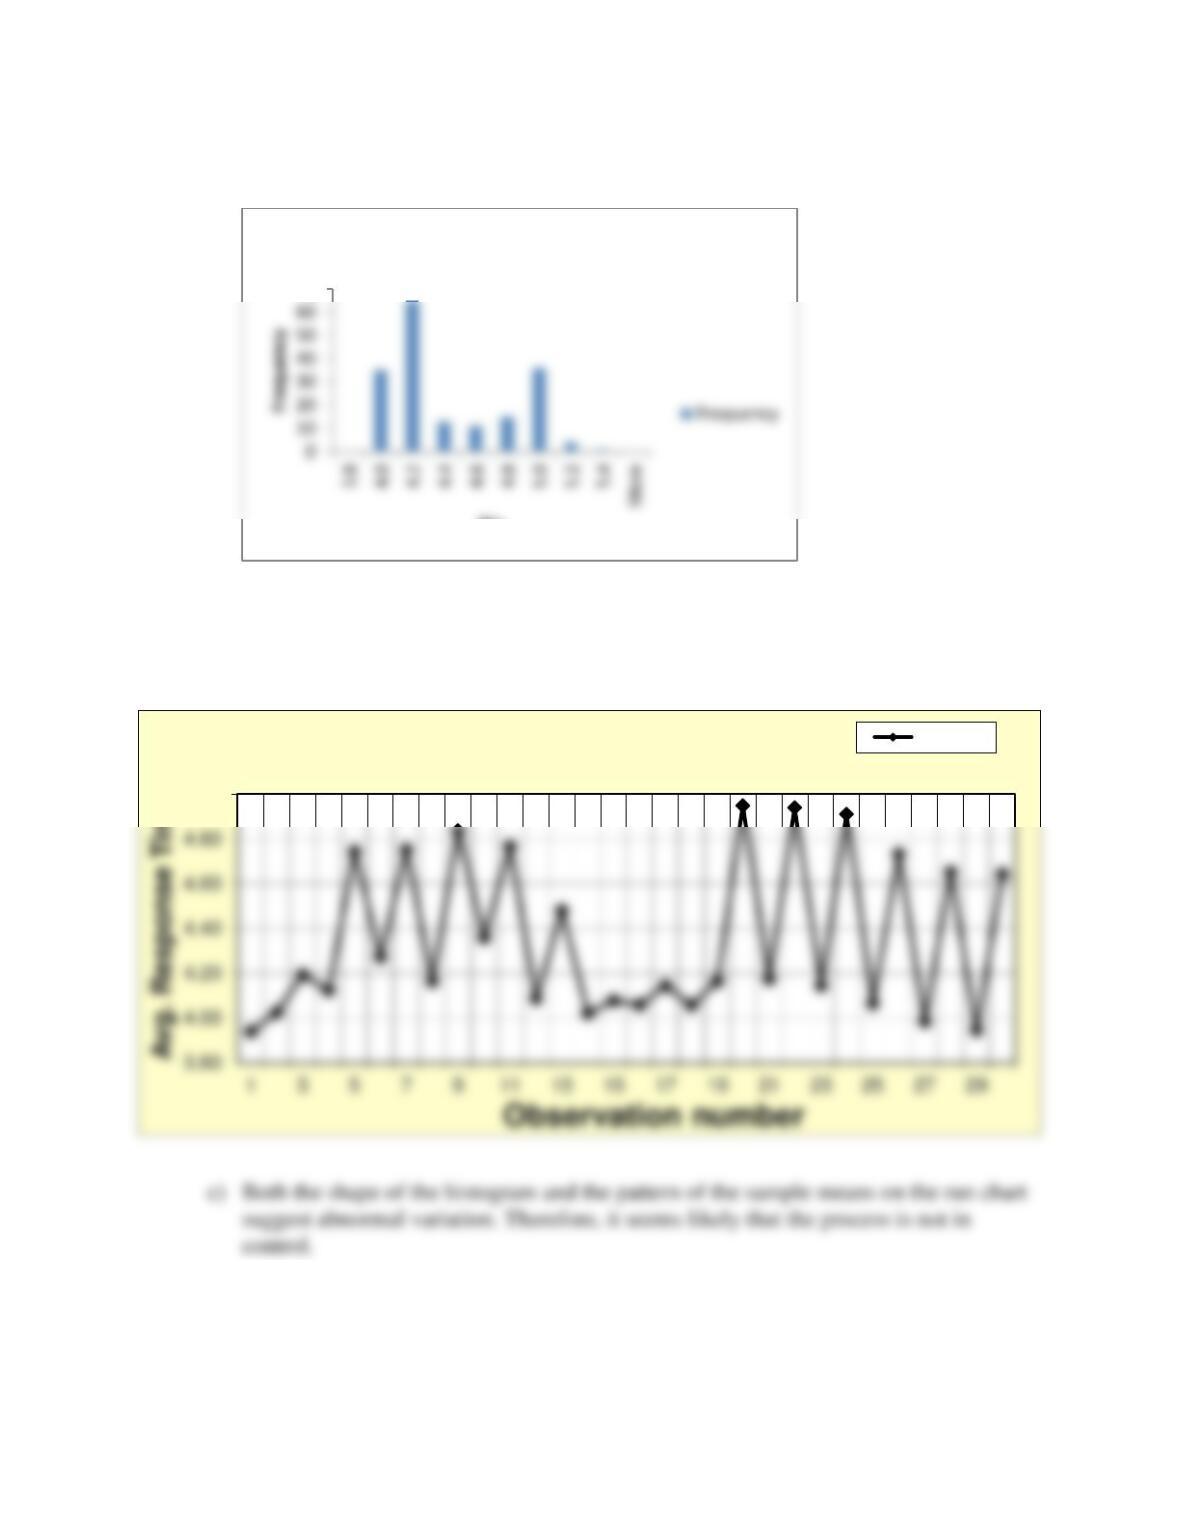
22. River Bottom Fire Department is evaluating their response times in order to determine
whether a new fire station is needed. Samples were taken for 30 random days from 6
stations. These data can be found in the worksheet Prob. 8-22 in the C08Data.xlsx file.
a. Using Microsoft Excel® or similar software with statistical capability, construct a
histogram for these 180 individual readings.
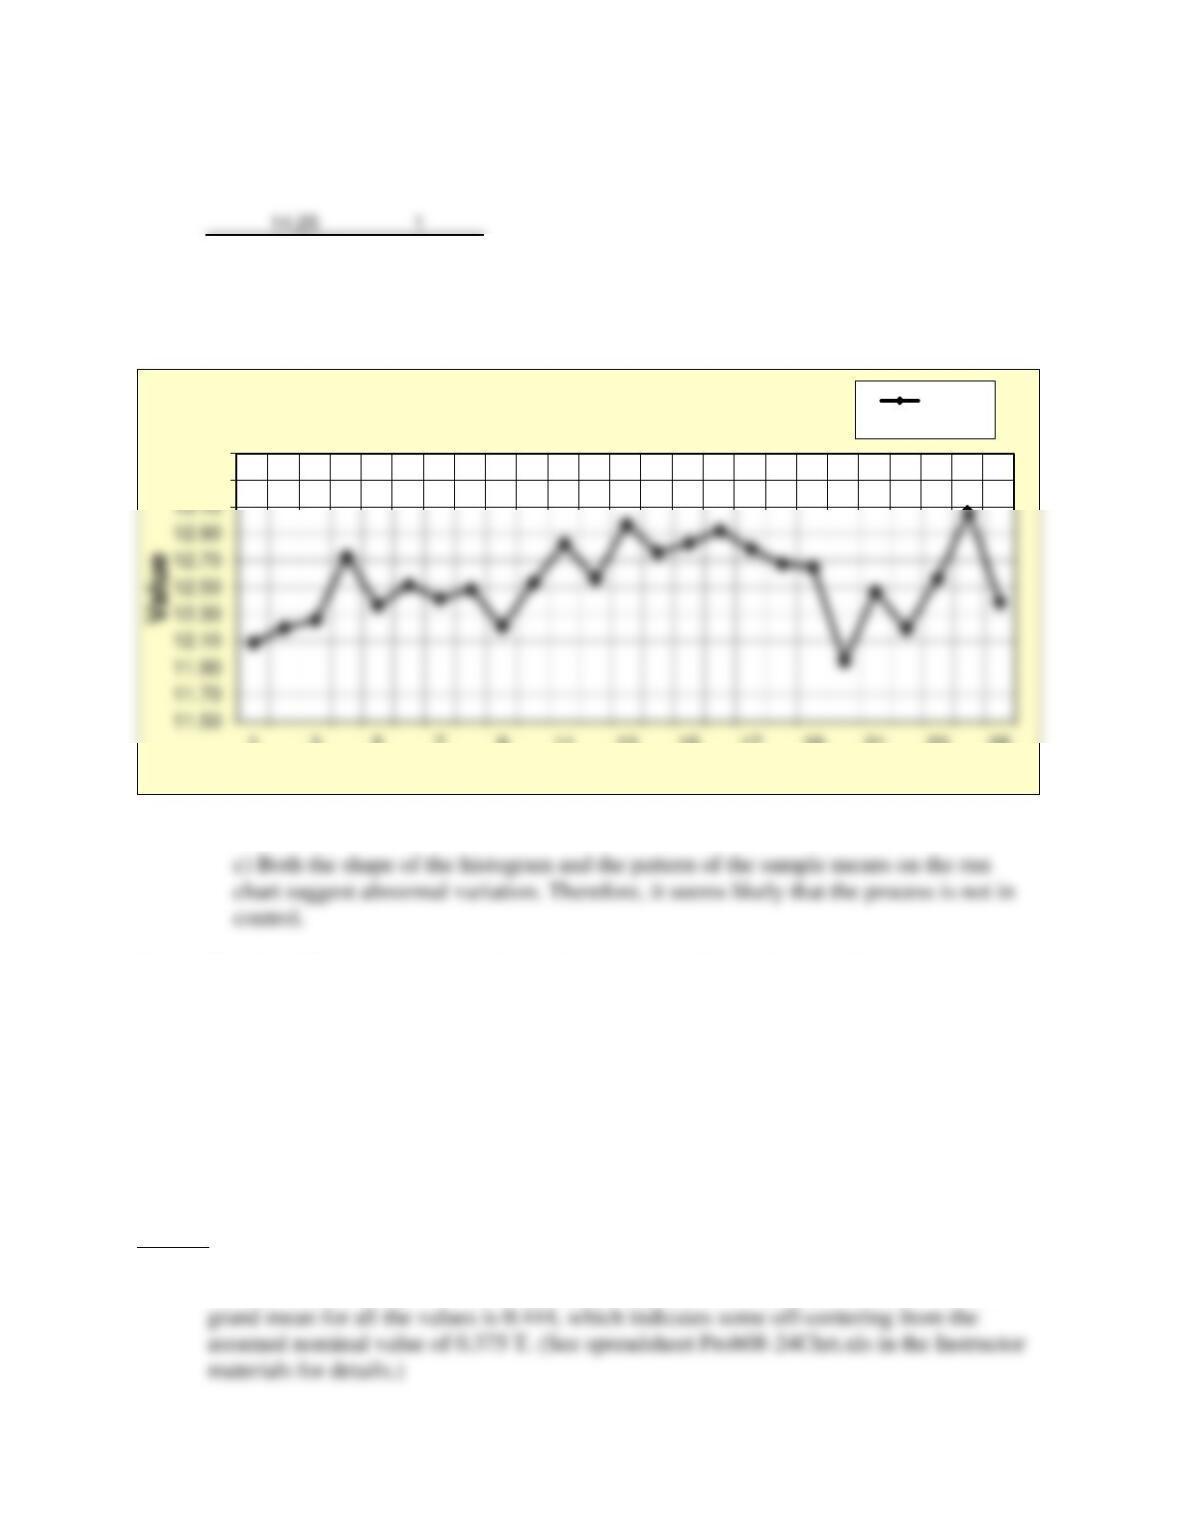
b. Construct a run chart for the sample means
c. Interpret what the data show. Does the process appear to be in control?
Answer
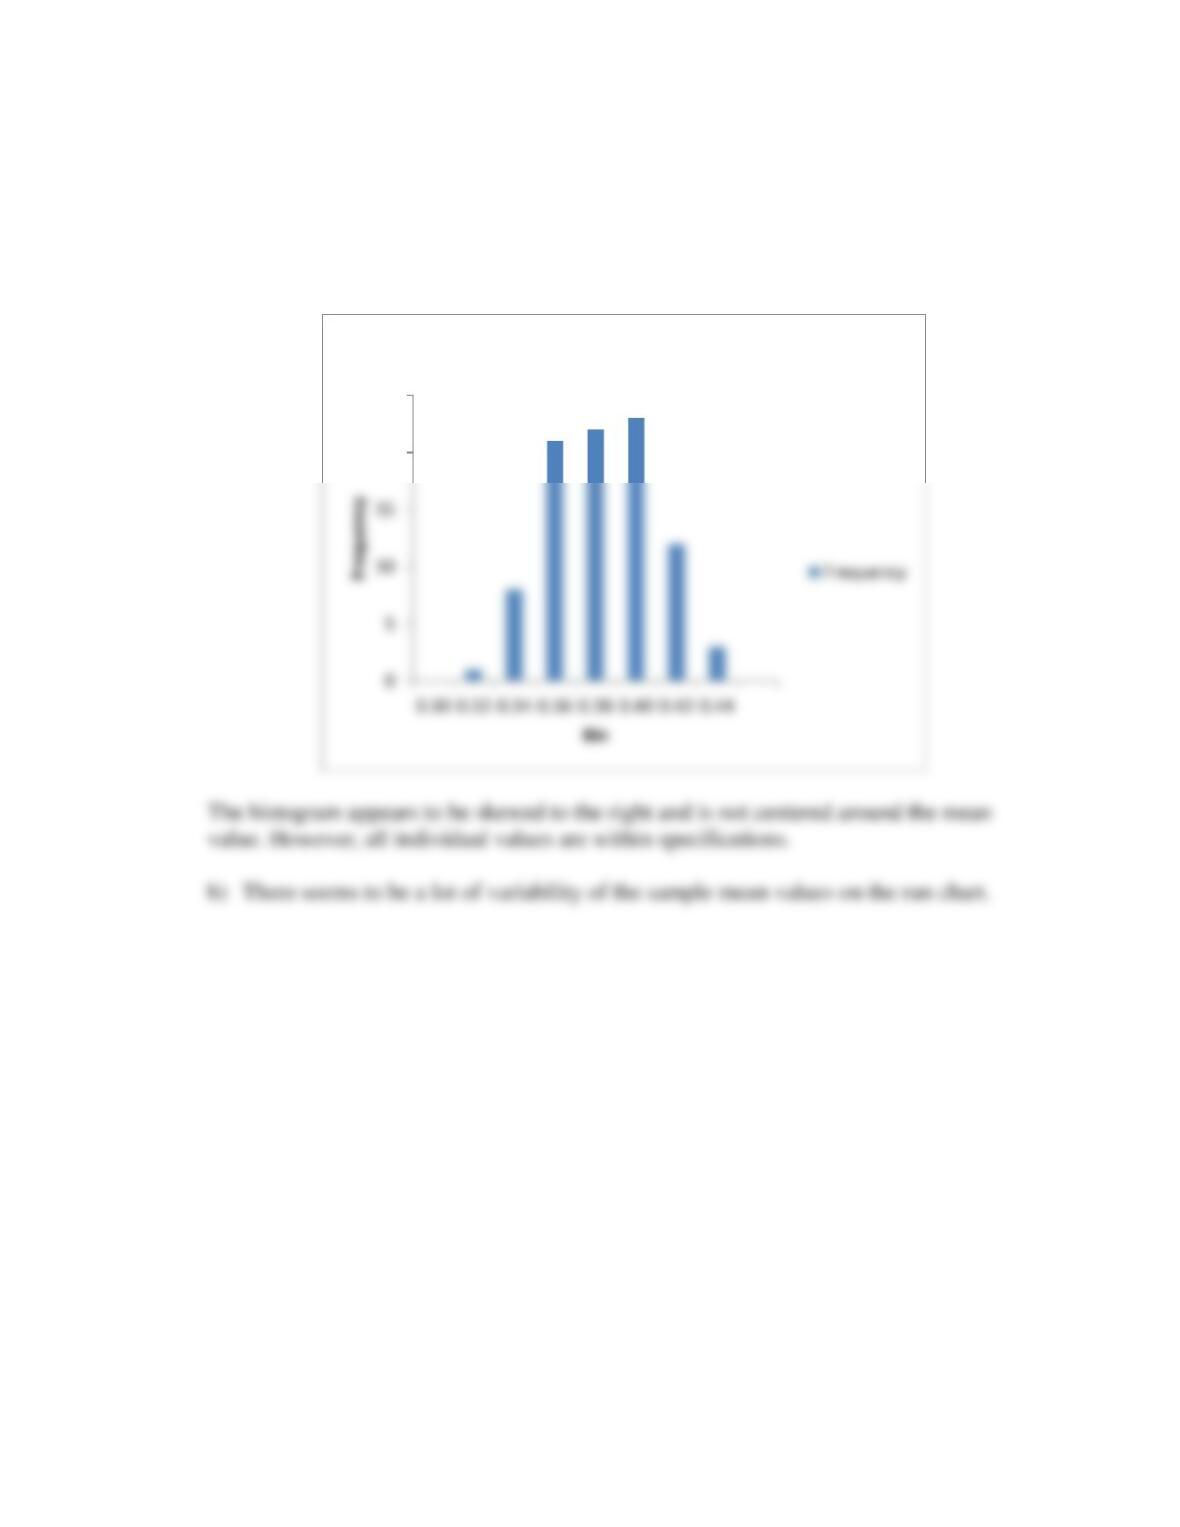
22. The following histogram was constructed. (See spreadsheet Prob08-22Chrt.xlsx in the
Instructor materials for details.)
Chapter 8 – Measuring and Controlling Quality 51
b) The run chart shows a consistent pattern of cycles, alternating between high and low
values. It seems clear that values have been chosen to conform to some “target,”
rather than varying randomly, over time.
23. Palma State Bank is investigating the processing time for loan applications. Samples
were taken for 25 random days from 5 branches. These data can be found in the
70
Bin
Histogram
5.00
Prob. 8-22 Run Chart of Sample Means
Response…
Chapter 8 – Measuring and Controlling Quality 52
worksheet Prob. 8-23 in the C08Data.xlsx file on the Student Companion Site for this
chapter..
a. Using Microsoft Excel® or similar software with statistical capability, construct a
histogram for these 125 individual readings.
b. Construct a run chart for the sample means.
c. Interpret what the data show. Does the process appear to be in control?
Answer
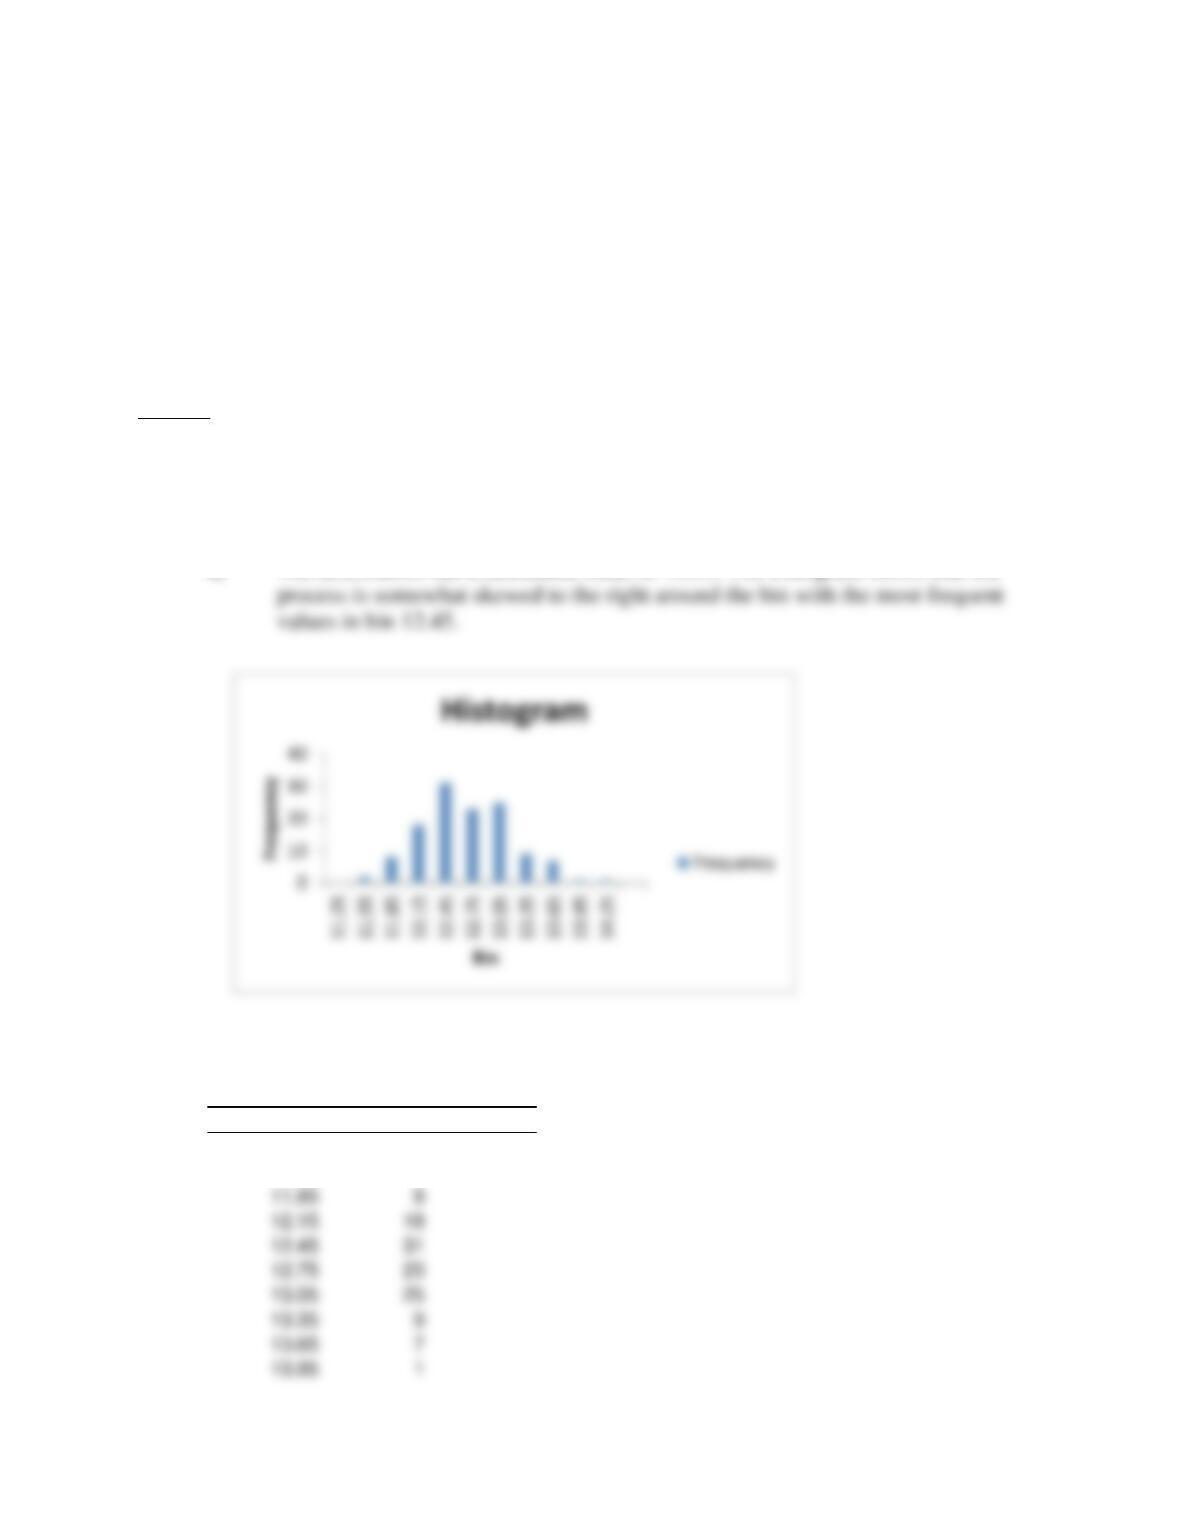
23. The following histogram was constructed. (See spreadsheet Prob08-23Chrt.xlsx in the
Instructor materials for details.)
a) The distribution has a calculated mean of 12.53. The histogram shows that the
Bin
Frequency
11.25
0
11.55
2
11.85
8
12.15
12.45
12.75
13.05
13.35
9
Chapter 8 – Measuring and Controlling Quality 53
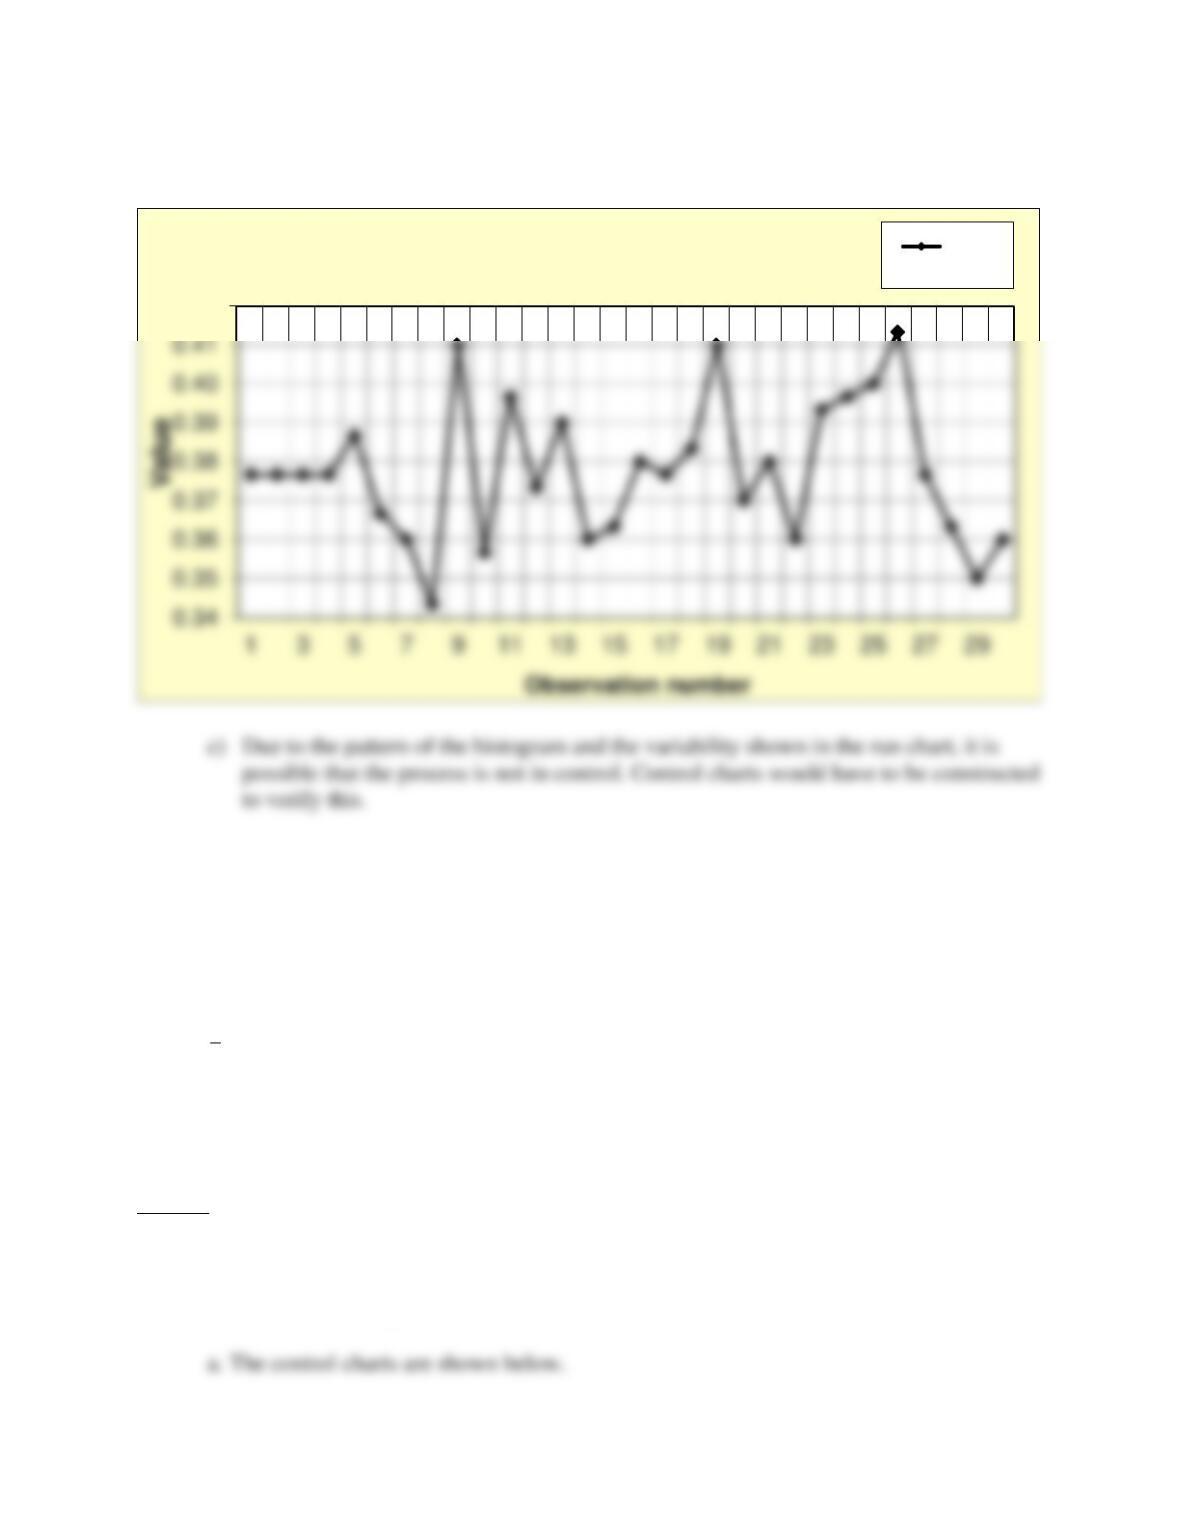
b) The run chart of sample means is shown below. It has an extended string of values
from reading 10 to 19, which do not appear to show random variation.
24. Hawkeye Magnetronics makes induction meters used in vending machines to test the
validity of coins. Their specifications require the induction reading capability of the
meters to fall between 0.25 and 0.50 Tesla (T) units. Quality analysts took 3 random test
readings of 30 meters, as found in the worksheet Prob. 8-24 in the C08Data.xlsx file.
a. Using Microsoft Excel® or similar software with statistical capability, construct a
histogram for these 90 individual readings.
b. Construct a run chart for the sample means.
c. Interpret what the data show. Does the process appear to be in control?
Answer
24. Results from 30 samples of 3 for Hawkeye Magnetronics measurements show that the
13.30
13.50
1357911 13 15 17 19 21 23 25
Observation number
Prob 8- 23 Run Chart of Sample Means Sample
Means
Chapter 8 – Measuring and Controlling Quality 54
a) The histogram for the data shows:
20
25
Histogram
Chapter 8 – Measuring and Controlling Quality 55
25. River Bottom Fire Department (Prob. 8-22) determined that they needed to adjust their
data-gathering process for response time to eliminate bias. The times were expected to
fall within 3.8 and 5.3 minutes. After doing so, they wanted to evaluate the process to
determine whether or not it was under control. Thirty new samples were taken on 30
random days from 6 stations. These data can be found in the worksheet Prob. 8-25 in the
C08Data.xlsx file on the Student Companion Site for this chapter..
a. Compute the mean and range of each sample, calculate control limits, and plot them on
x
and R control charts.
b. Does the process appear to be in statistical control? Calculate descriptive statistics that
may help you to determine the answer to this question. What evidence is there for your
conclusion?
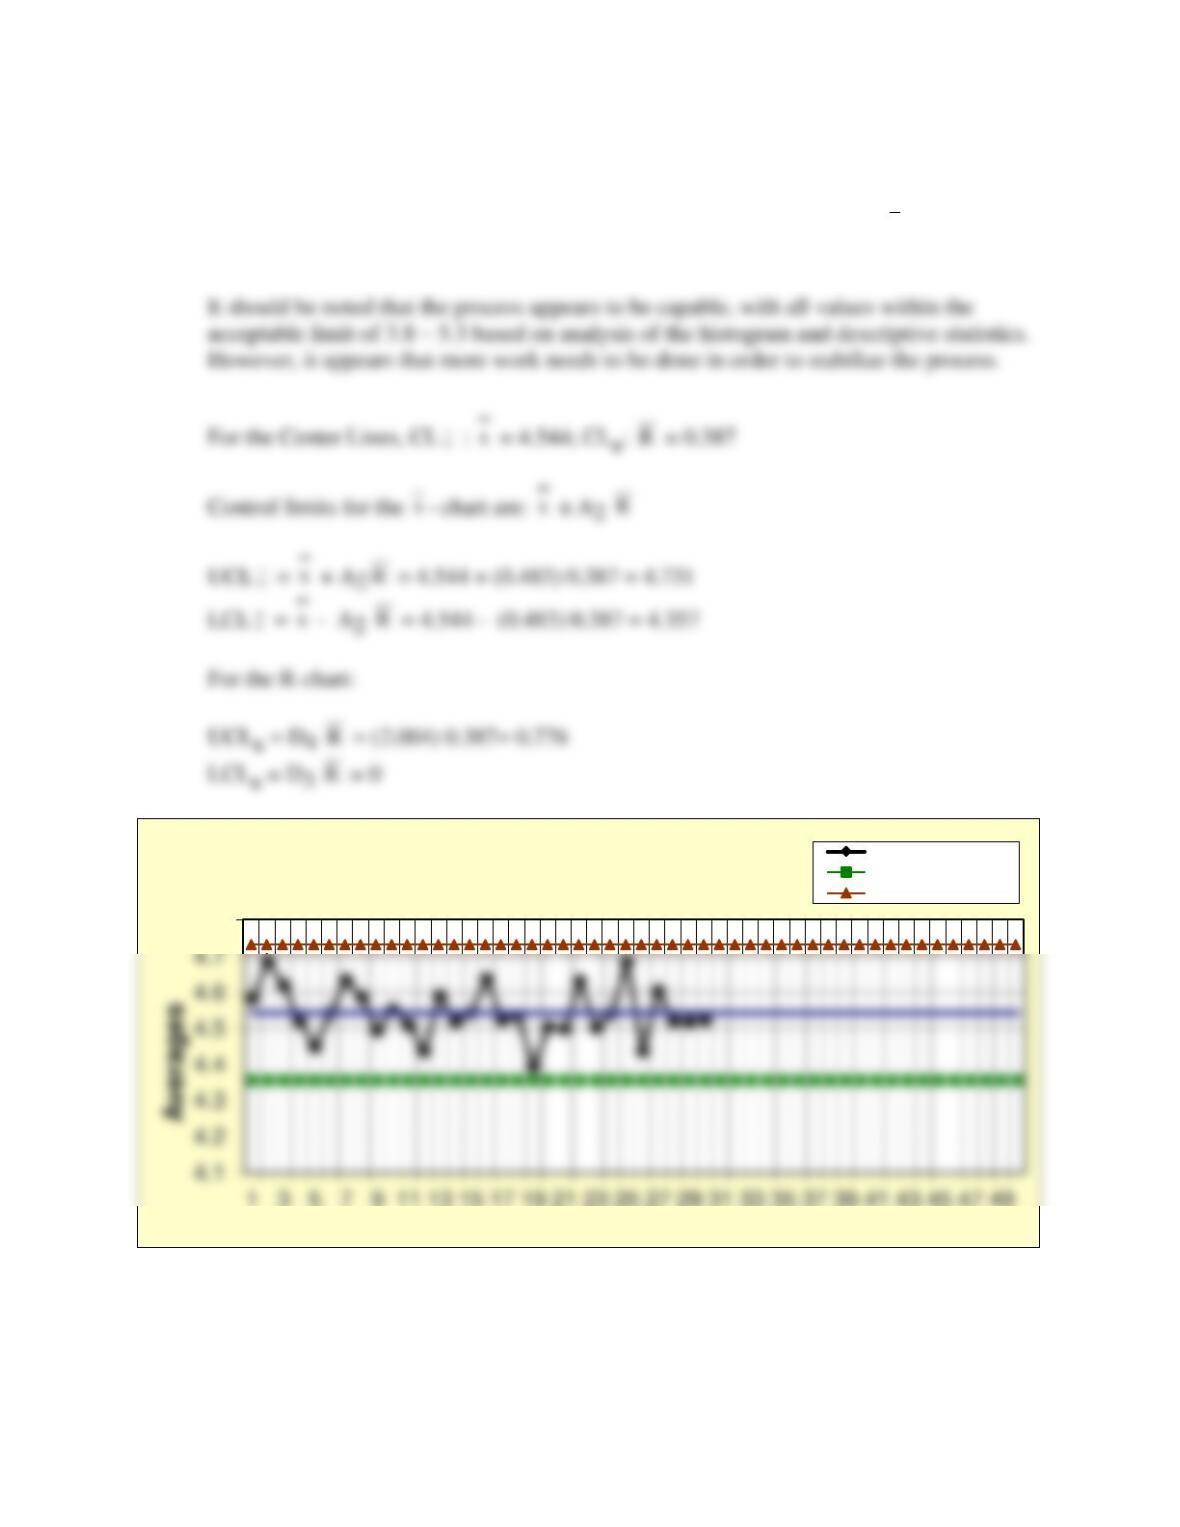
Answer
25. Results from 30 samples of 6 for River Bottom Fire Department response time
measurements were calculated. (See spreadsheet Prob08-25.xlsx in the Instructor
materials for details).
0.42
Problem 8-24 Run Chart of Sample Means Sample
Means
Chapter 8 – Measuring and Controlling Quality 56
b. Interpretation of the control charts show that it is highly likely that the
x
chart and the
R chart are in control.
4.8
1 3 5 7 9 11 13 15 17 19 21 23 25 27 29 31 33 35 37 39 41 43 45 47 49
Sample number
Prob. 8-25 – X-bar Chart
Averages
Lower control limit
Upper control limit
x
Chapter 8 – Measuring and Controlling Quality 57
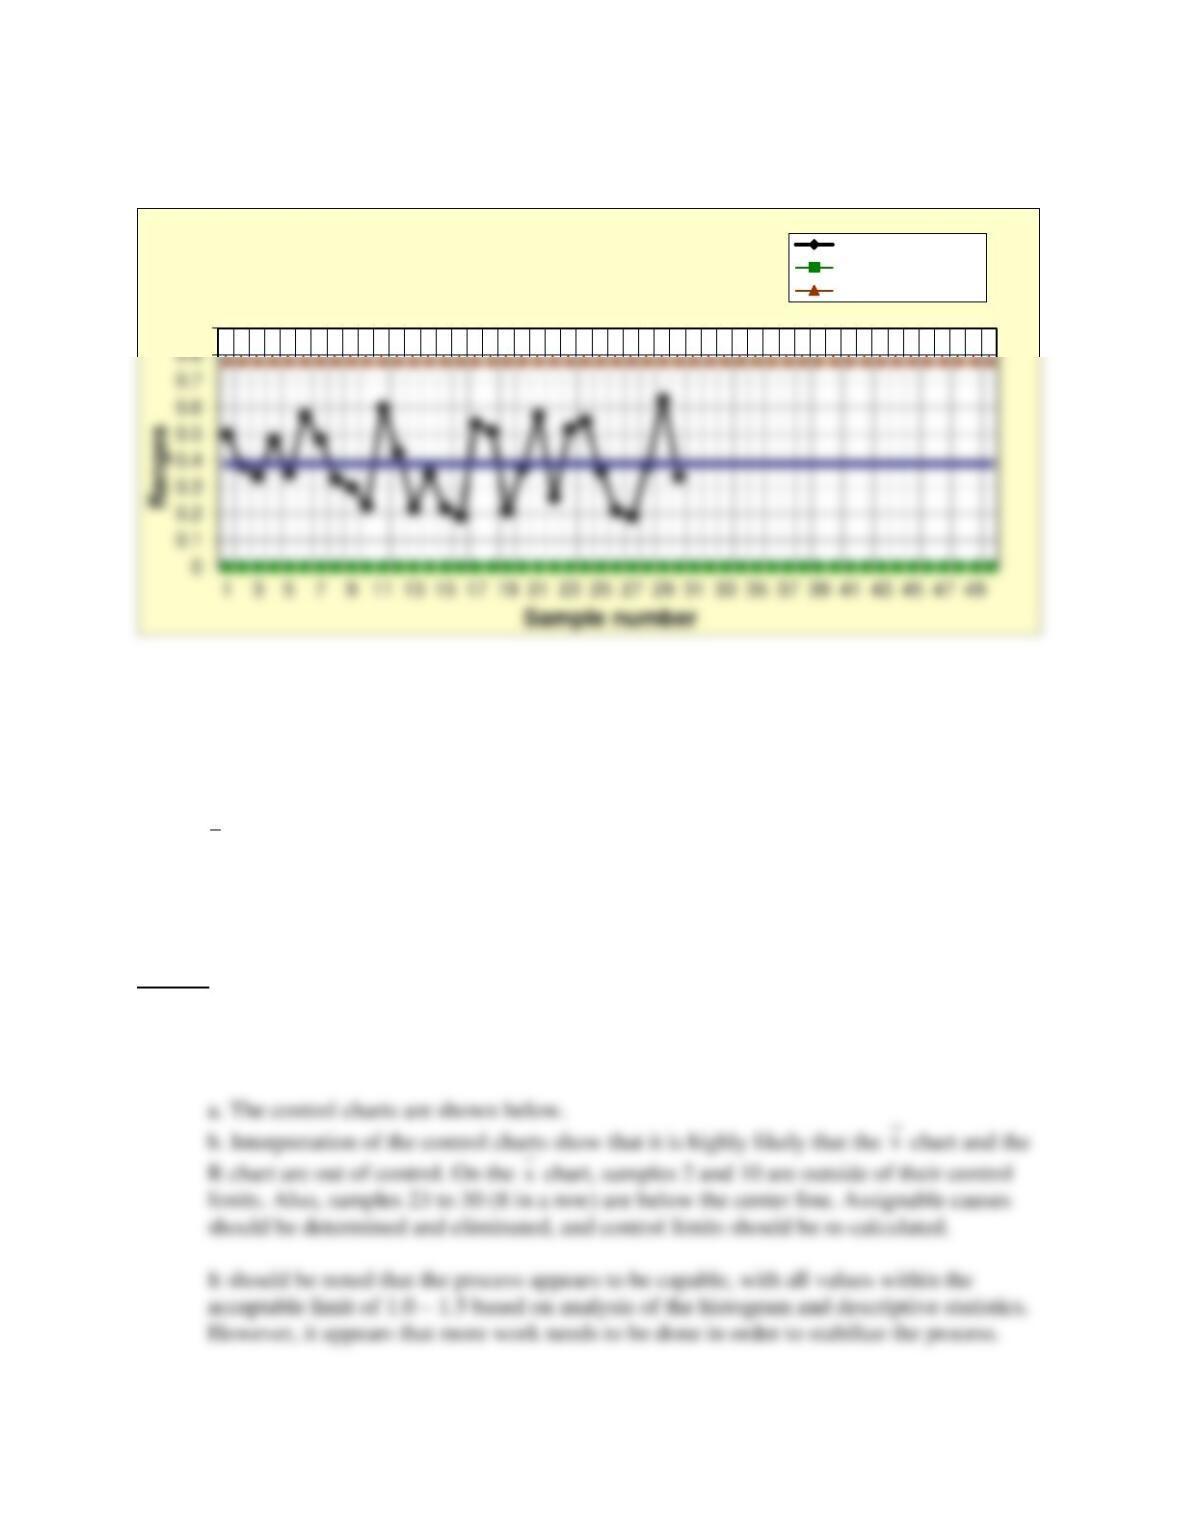
26. J. McWilliams Swim Club is trying to calibrate their chlorine pump to ensure that the
right amount of chlorine (1.0–1.5 ppm of free chlorine) is mixed into the water. Thirty
samples of four readings at random times during the week were taken. These data can be
found in the worksheet Prob. 8-26 in the C08Data.xlsx file.
a. Compute the mean and range of each sample, calculate control limits, and plot them on
x
and R control charts.
b. Does the process appear to be in statistical control? Calculate descriptive statistics that
may help you to determine the answer to this question. What evidence is there for your
conclusion?
Answer
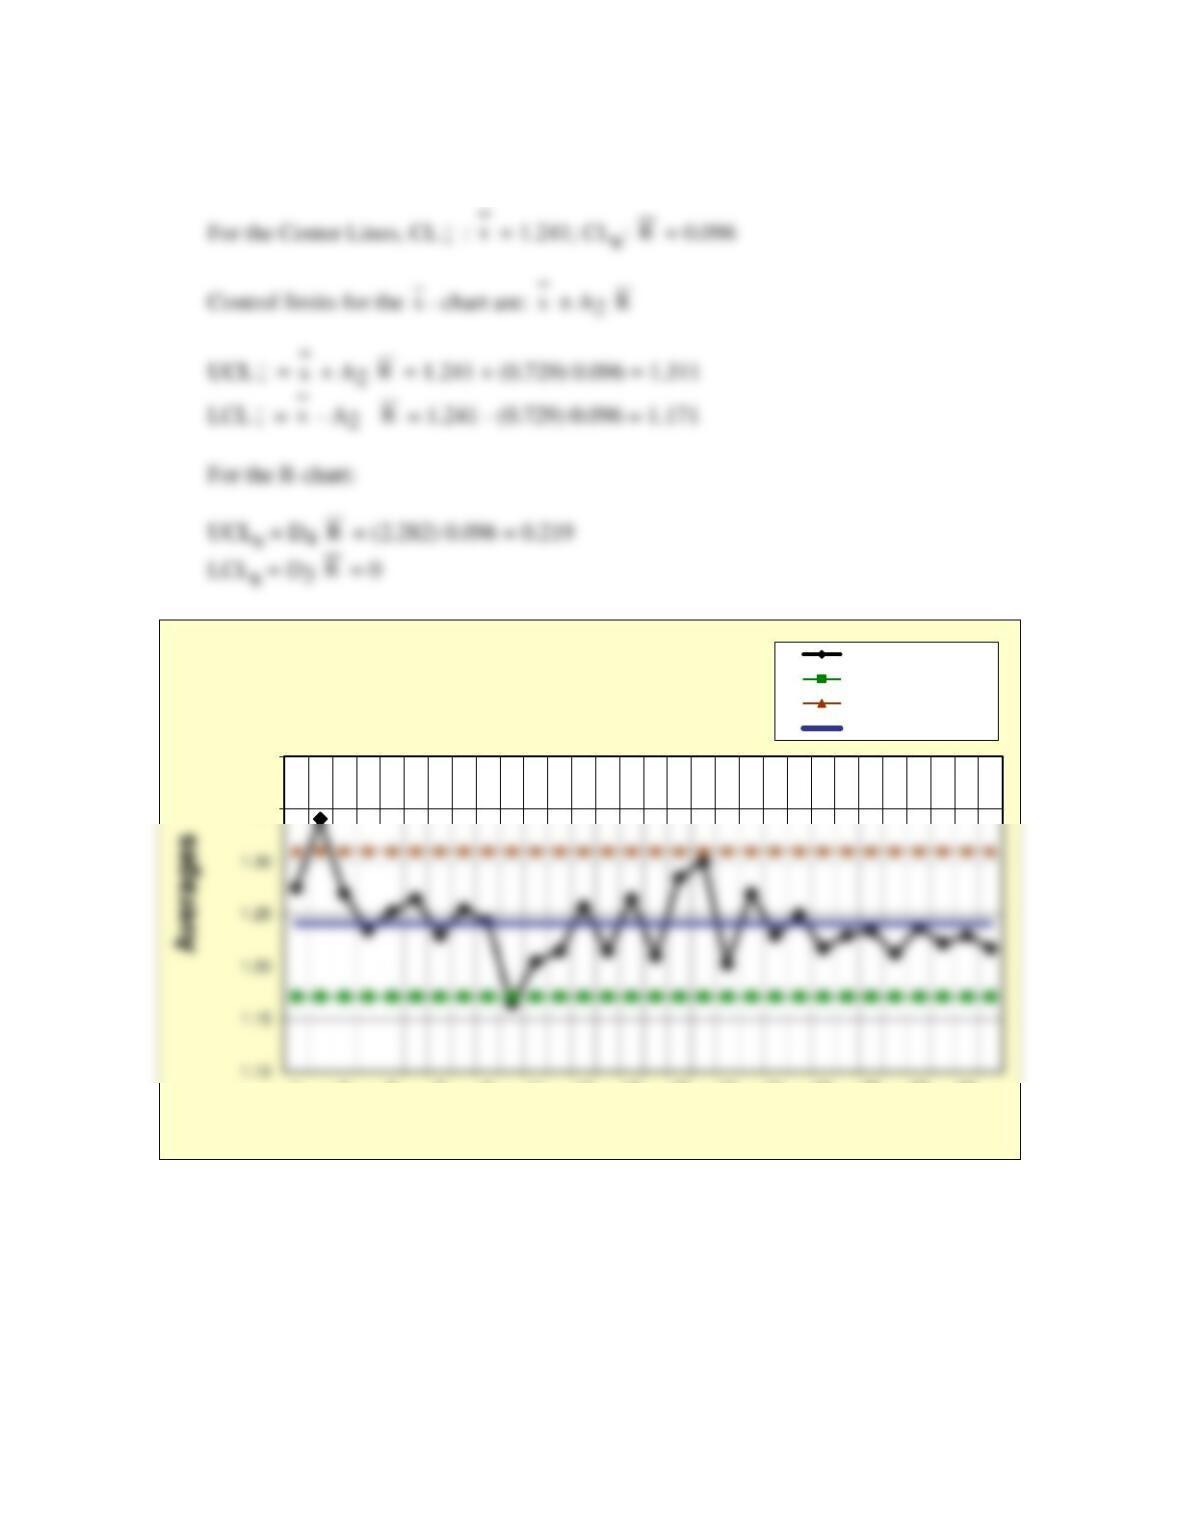
26. Results from 30 samples of 4 for J. McWilliams Swim Club chlorine measurements were
calculated. (See spreadsheet Prob08-26XR.xlsx in the Instructor materials for details).
0.9
Prob. 8-25 – R-Chart
Ranges
Lower control limit
Upper control limit
Chapter 8 – Measuring and Controlling Quality 58
1.35
1.40
1 3 5 7 9 11 13 15 17 19 21 23 25 27 29
Sample number
Prob. 8-26 X-bar Chart
Averages
Lower control limit
Upper control limit
Center line
Chapter 8 – Measuring and Controlling Quality 59
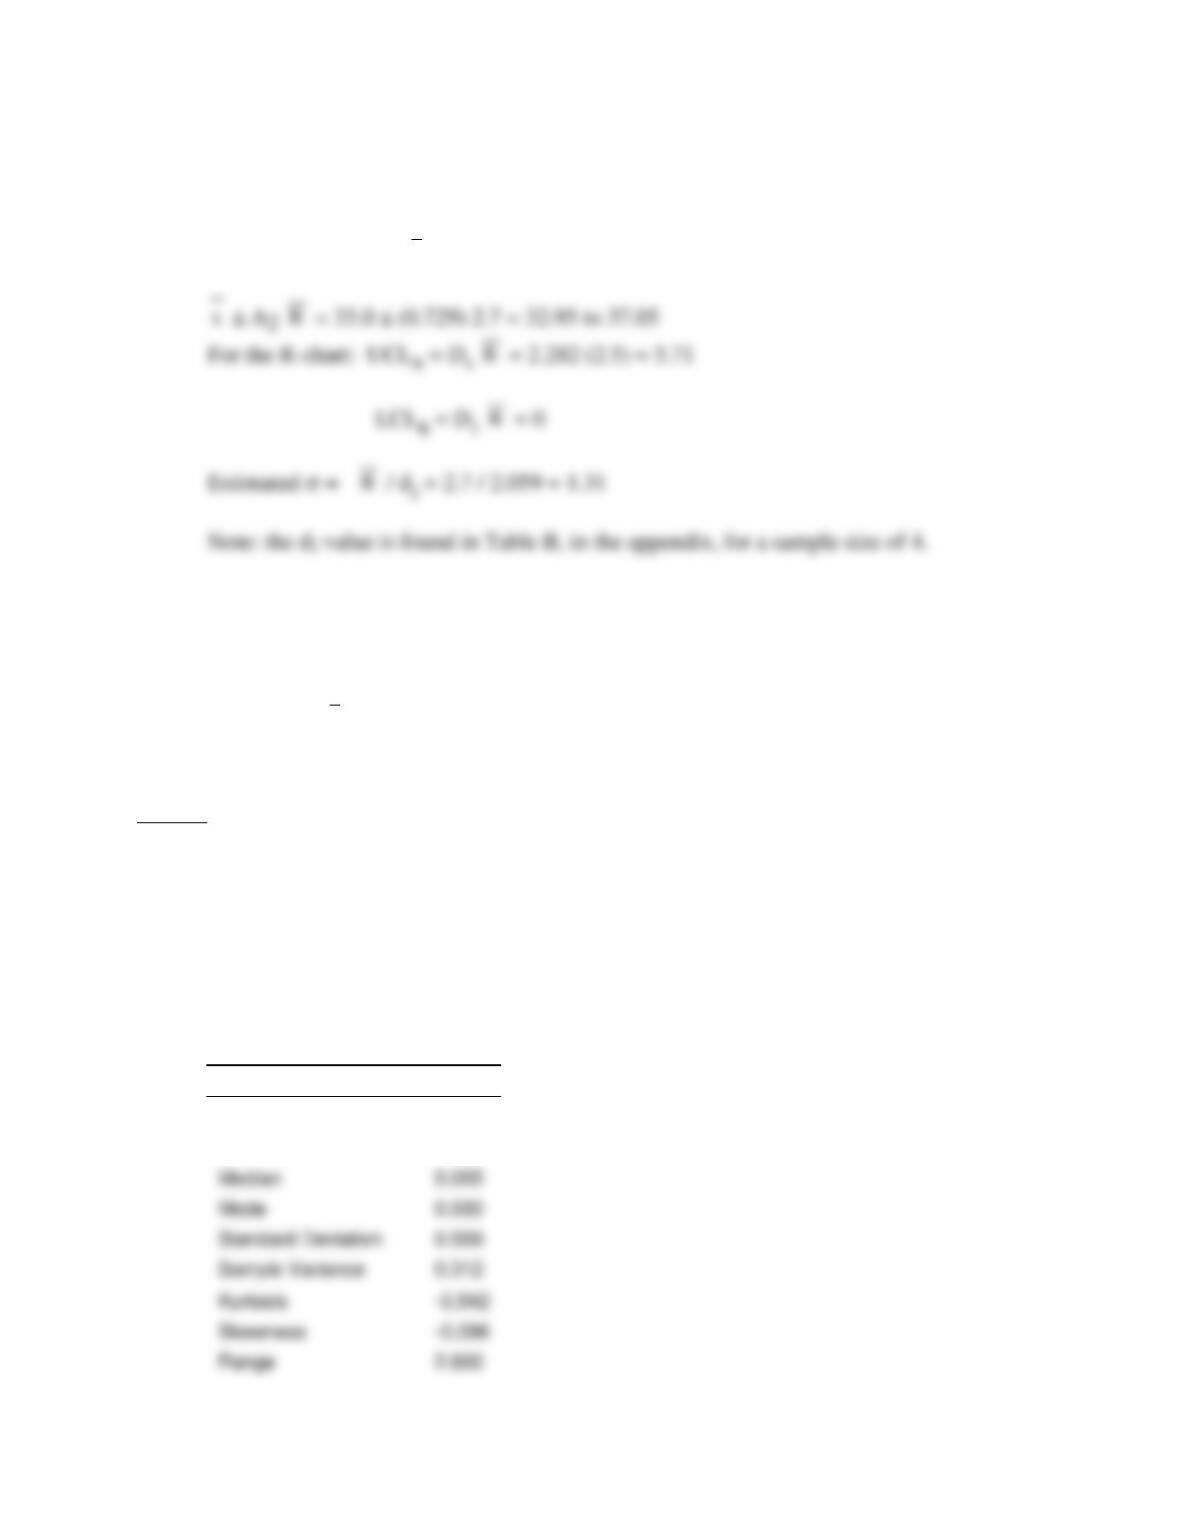
27. Twenty-five samples of size 4 resulted in statistics of
x
= 35.0 minutes and
R
= 2.7
minutes for the Turko Cleaning Company’s average time to completely clean a rug.
Compute control limits for x- and R-charts and estimate the standard deviation of the
process.
Answer
27. For the Turko Cleaning Company’s center lines, CL
x
:
x
= 35.0; CLR :
R
= 2.7
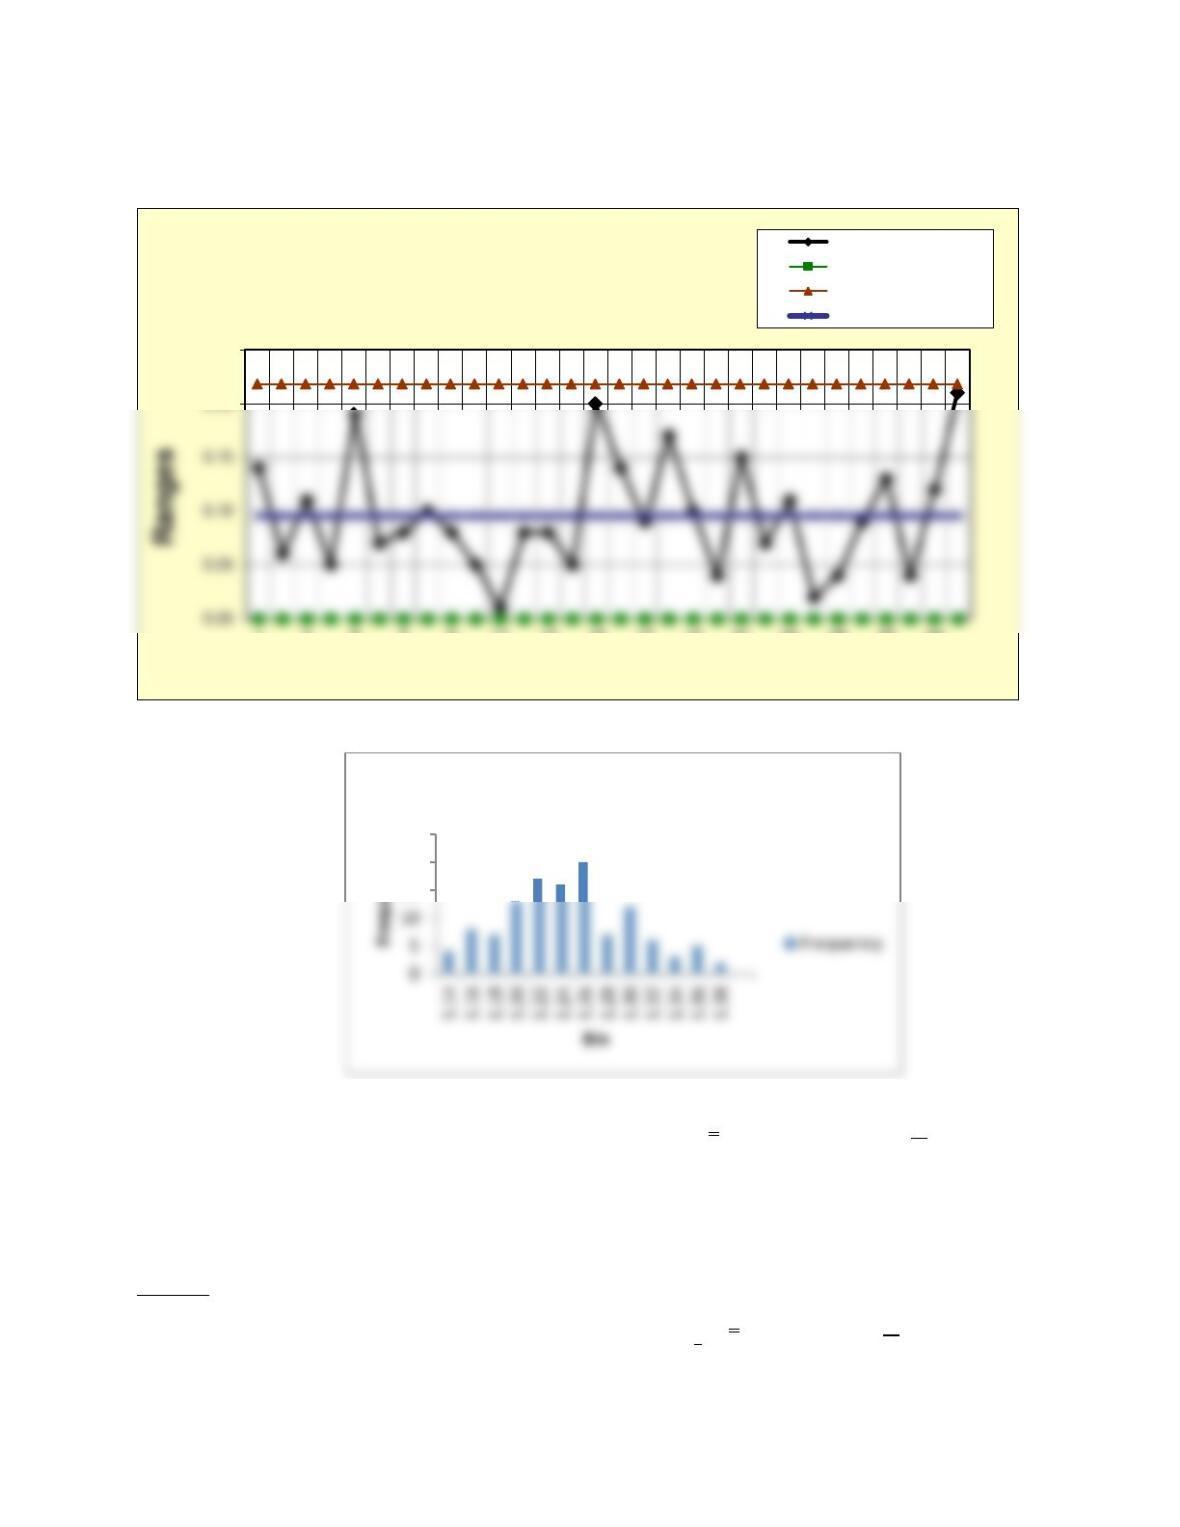
0.20
0.25
1 3 5 7 9 11 13 15 17 19 21 23 25 27 29
Sample number
Prob. 8-26 R–Chart
Ranges
Lower control limit
Upper control limit
Center line
15
20
25
Histogram
Chapter 8 – Measuring and Controlling Quality 60
Control limits for the
x
– chart are:
28. In testing the temperature in an analysis process in Hermitage DNA Labs, LLC,
containing both positive and negative values, the data listed in the worksheet Prob. 8-28
in the C08Data.xlsx file on the Student Companion Site for this chapter were obtained.
a. Compute the mean, standard deviation and other descriptive statistics for the data.
b. Construct
x
and R-charts for these data. Determine whether the process is in control.
If not, eliminate any assignable causes and compute revised limits.
Answer
28. Results from the samples of 50 of size 5 for Hermitage DNA Labs, LLC temperature
readings were calculated. (See spreadsheet Prob08–28XR.xlsx in the Instructor materials
for details.)
a. For the 250 individual readings given for Hermitage DNA Labs, LLC, the following
descriptive statistics were obtained.
Descriptive Statistics
Mean
0.011
Standard Error
0.035
Median
0.055
Mode
0.030
Standard Deviation
0.559
Sample Variance
0.312
Kurtosis