Chapter 8 – Measuring and Controlling Quality 101
ANSWERS TO CASE QUESTIONS
I. CONTROL OF TFE’S AT HALLENVALE HOSPITAL
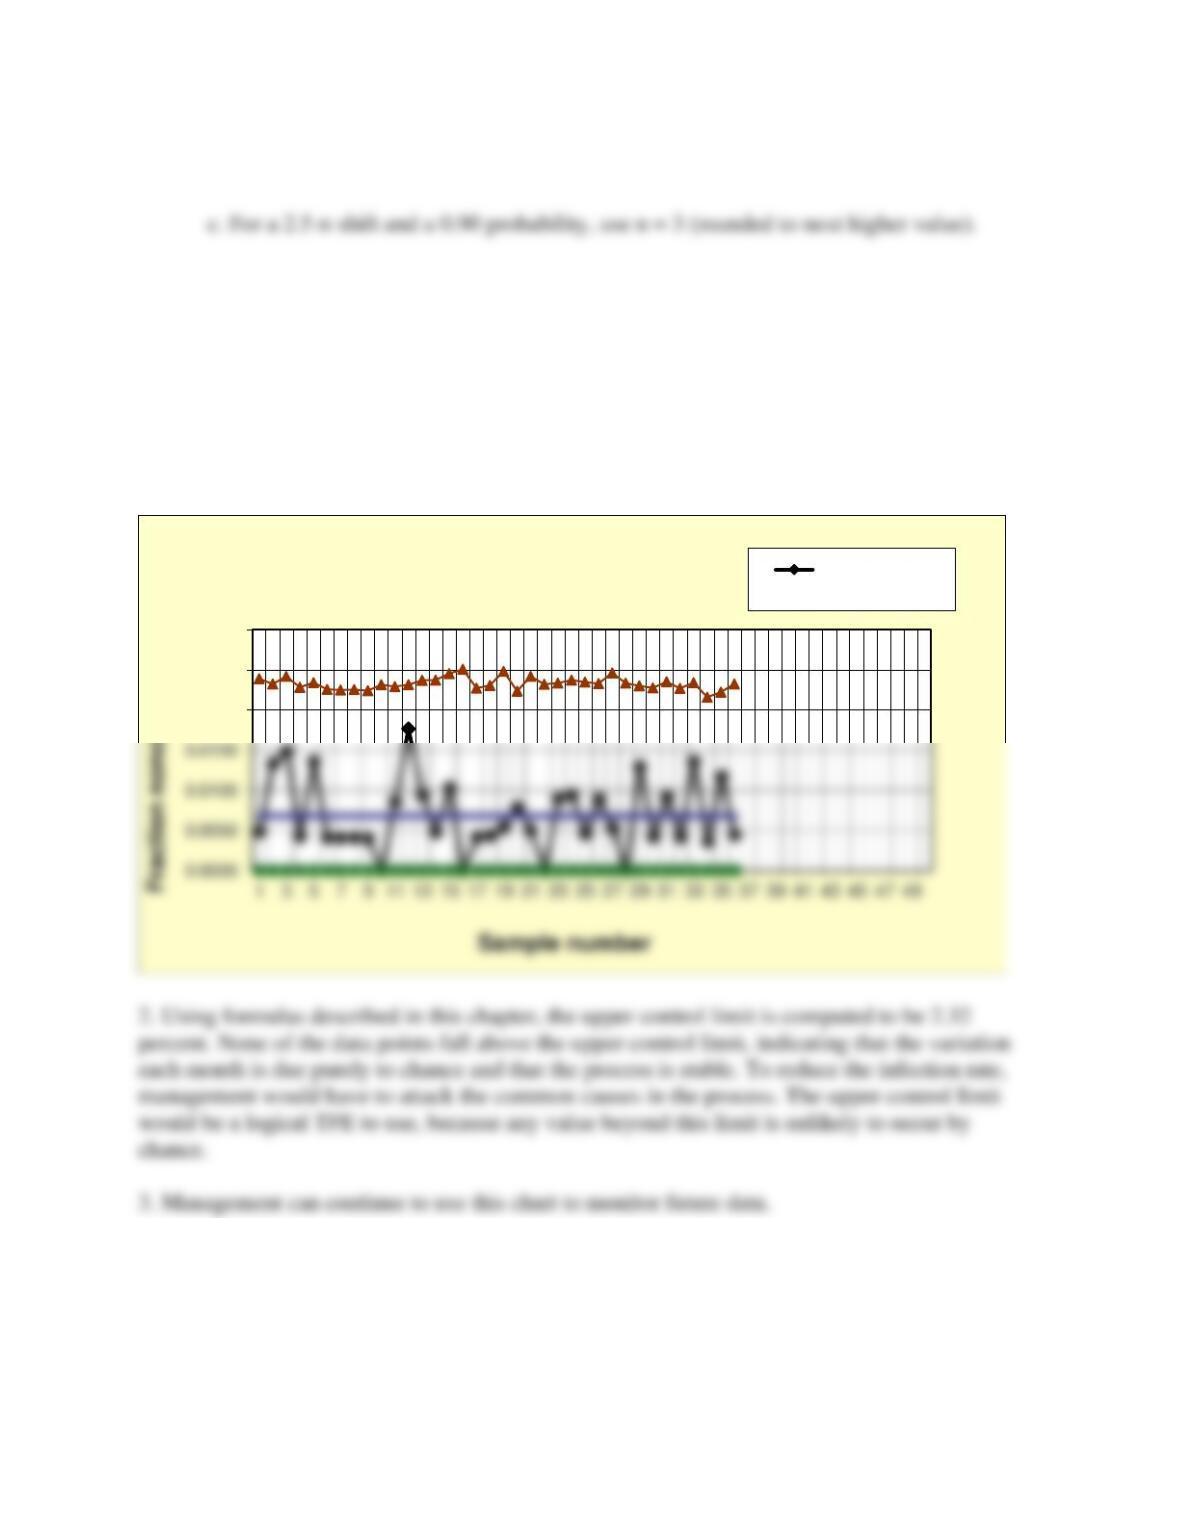
1. A control chart constructed from these data is shown in Figure 8.7. (Note that if the control
limits are removed, it becomes a simple run chart.) The average percentage of infections is
55/8095 = 0.679 percent.
II. MORELIA MORTGAGE COMPANY
NOTE TO INSTRUCTORS
0.0200
0.0250
0.0300
Hallenvale Hospital
Attribute (p) Chart
Fraction
nonconforming
Chapter 8 – Measuring and Controlling Quality 102
This case is designed to test the students’ abilities to apply SPC principles, to interpret the results
effectively, and see “beyond the data.” The key points are summarized below:
1. The student should be able to apply the formulas from this chapter to construct an x-bar and
R-chart and to determine the state of control, remove out-of-control points, and compute new
control limits.
2. A key aspect of the case is to recognize potential differences among operators. This is going
beyond the computations and using the data for diagnosis. The astute student might even take a
Assignment I – Company Case
1. Interpret the data in the MMC Case worksheet in the Excel workbook C08CaseData
(available on the Student Companion Site), establish a state of statistical control, and evaluate the
capability of the process to meet specifications. Consider the following questions: What do the
initial control charts tell you? Do any out-of-control conditions exist? If the process is not in
control, what might be the likely causes, based on the information that is available? What is the
process capability? What do the process capability indexes tell the company? Is MMC facing a
serious problem that it needs to address? How might the company eliminate the problems of
slow loan processing?
Answer
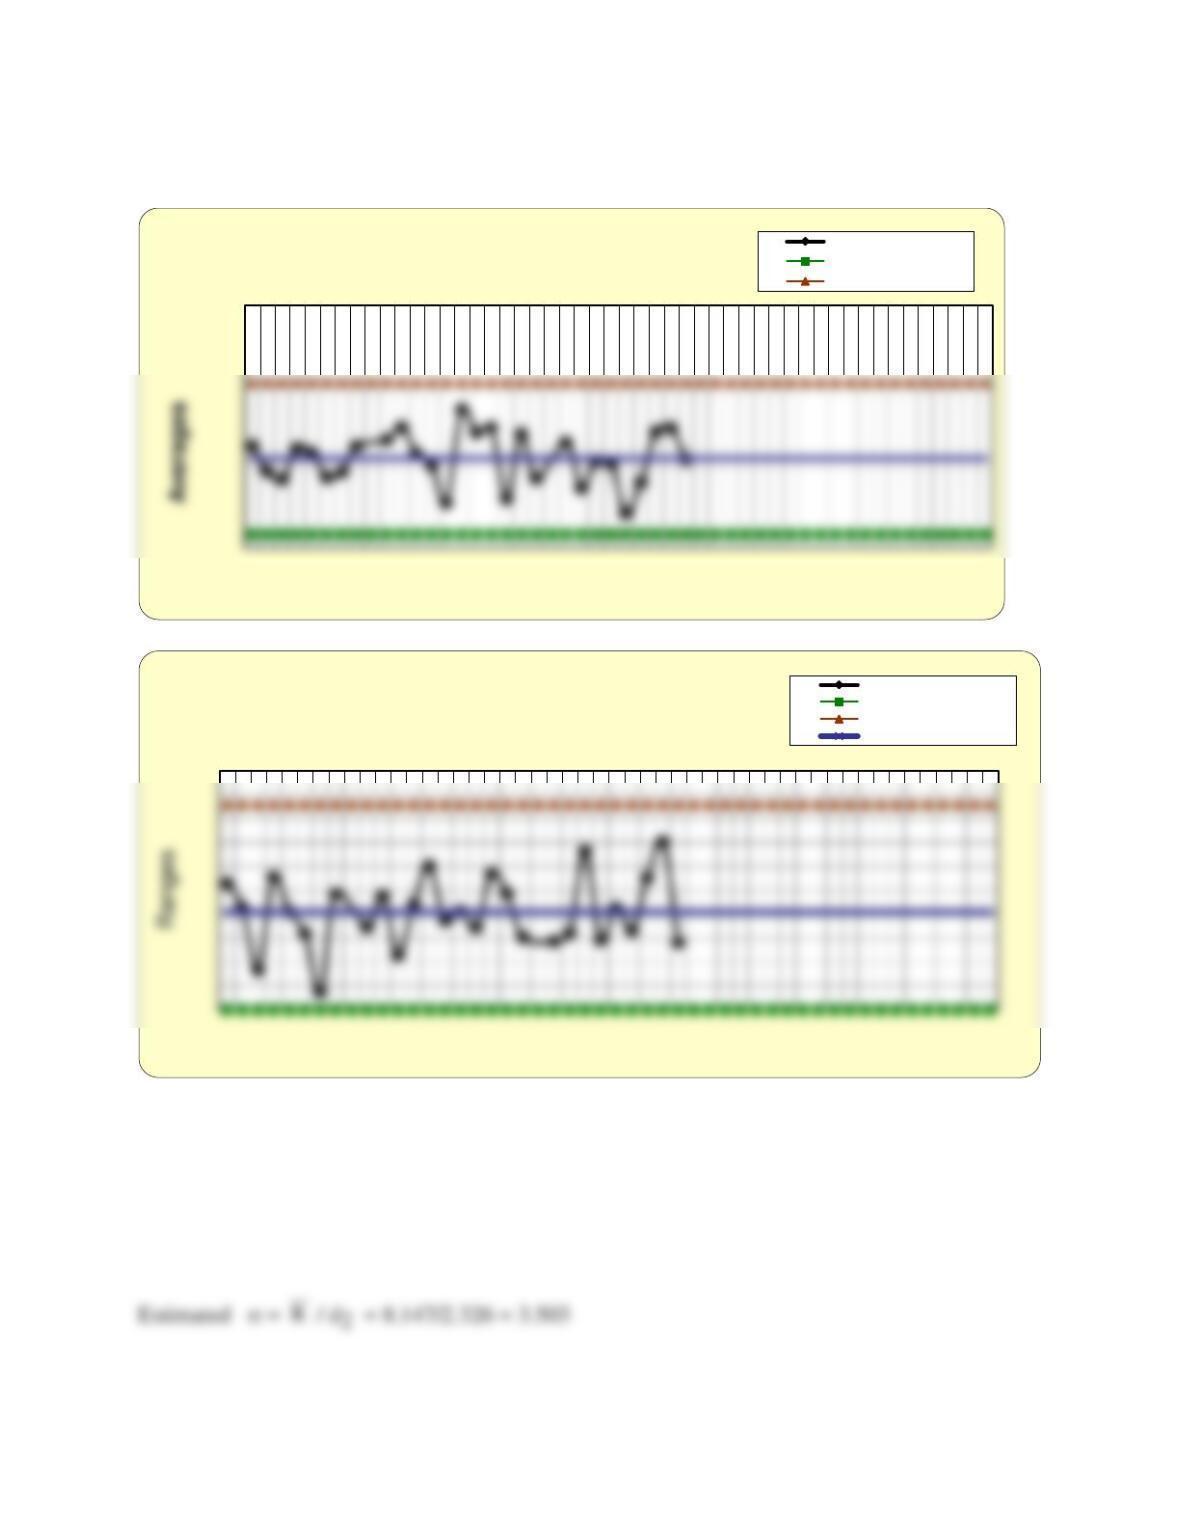
Since the data are variables data, the first step is to construct x-bar and R-charts and determine if
the process is in control. Figure Morelia Mortgage Co. – 1 (from the Excel® spreadsheet called
Chapter 8 – Measuring and Controlling Quality 103
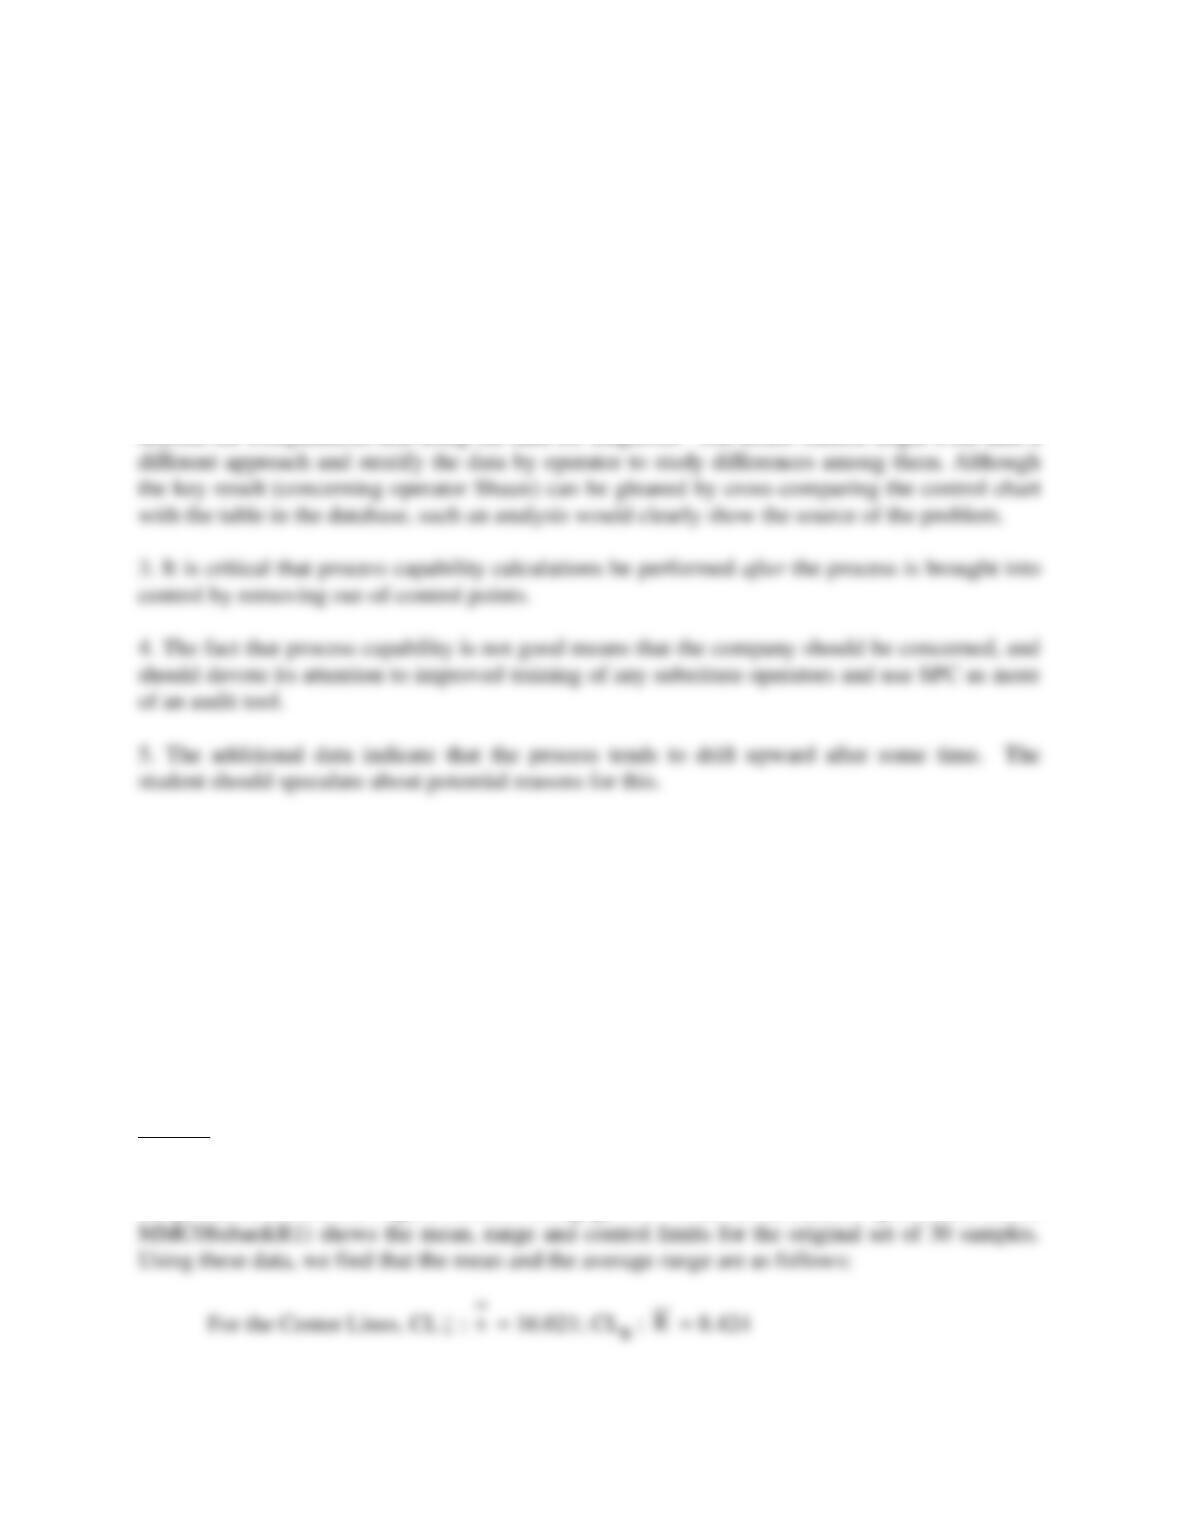
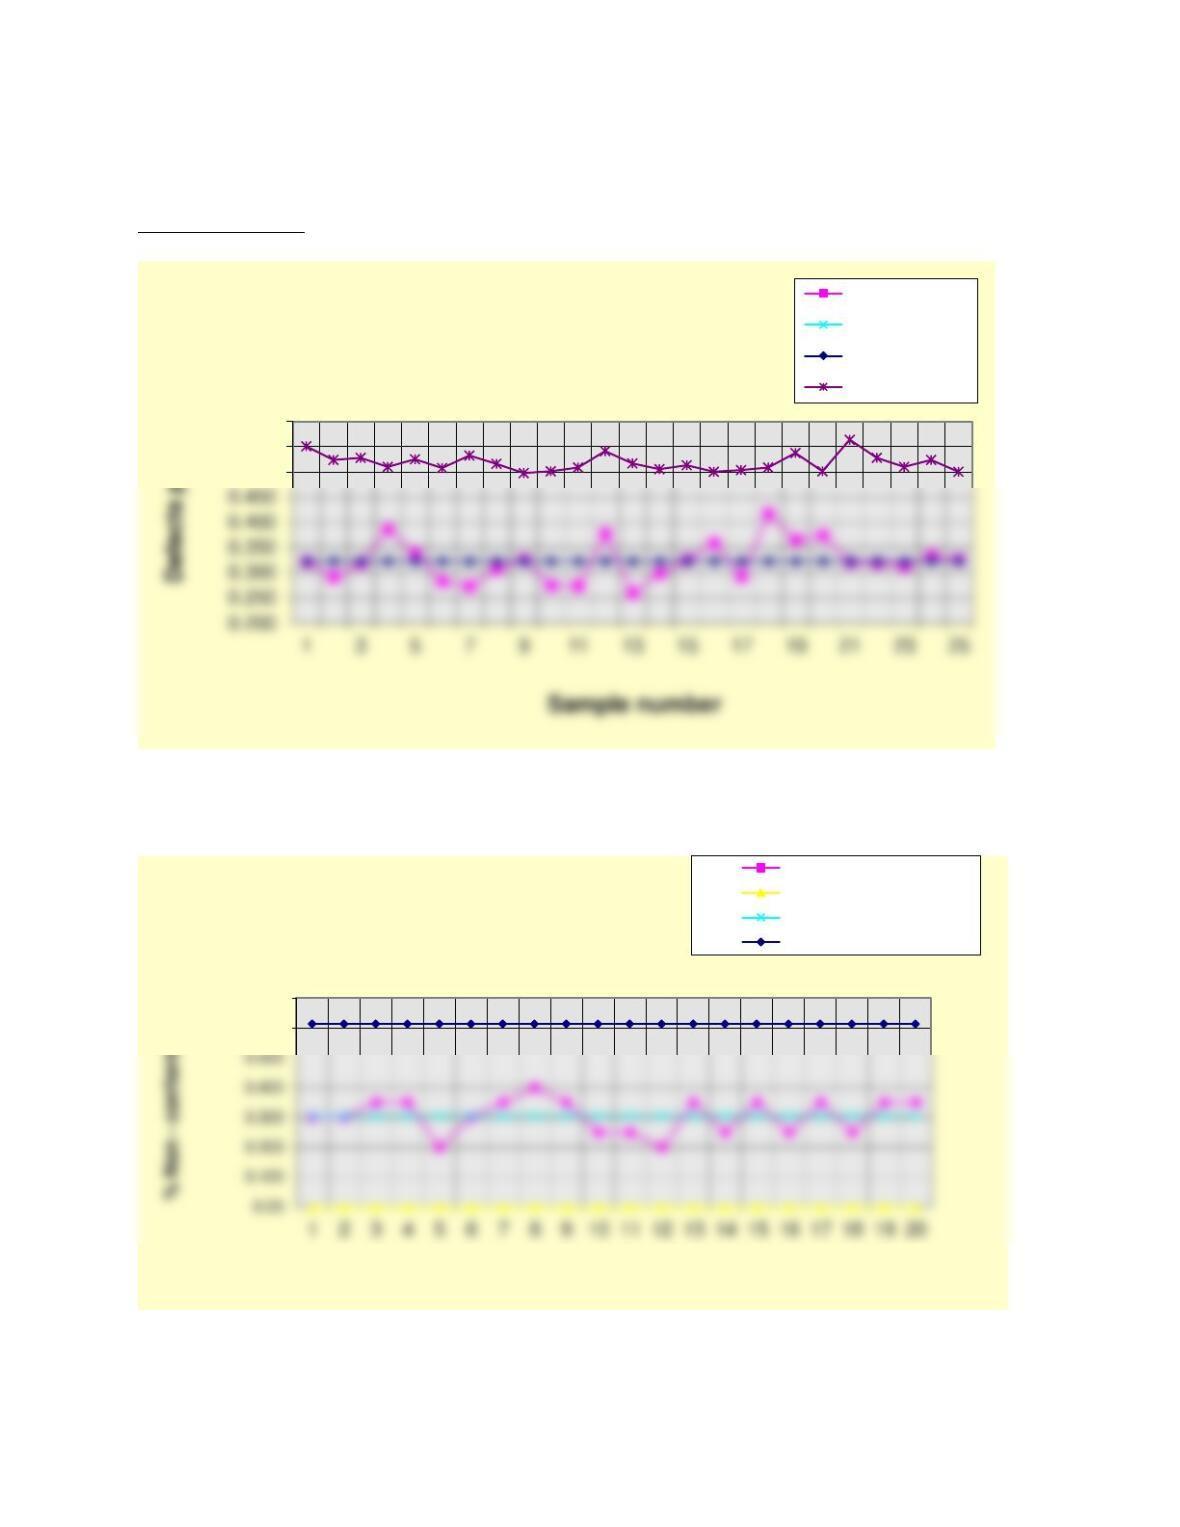
Figure Morelia Mortgage Co. – 1 shows the range and averages charts with these control limits.
The range chart does not have any obvious out of control points. However, the
x
– chart has two
points above the upper control limit, point 9 and point 21. Inspecting the production records, we
see that when each of these samples were taken, a different mortgage analyst, “Shaun” was
FIGURE Morelia Mortgage Co. – 1
Averages
Sample number
MMC– X-bar Chart
Averages
Lower control limit
Upper control limit
Chapter 8 – Measuring and Controlling Quality 104
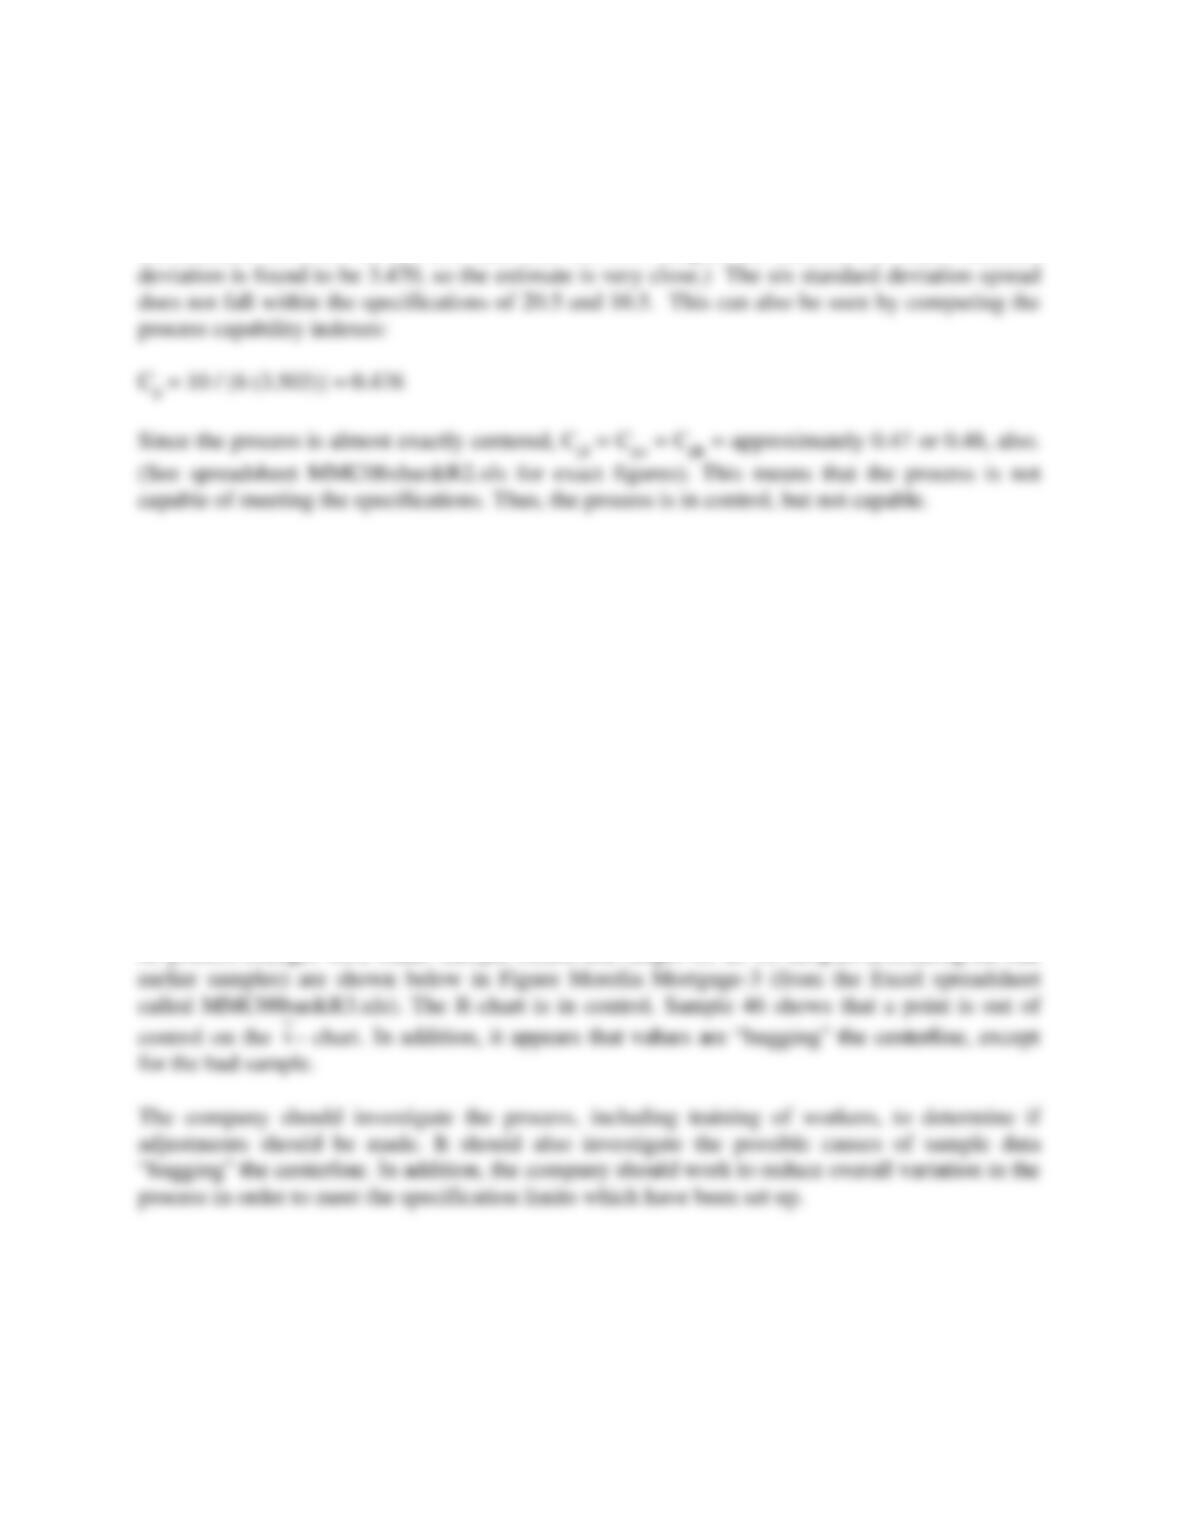
These data that show defective products must be removed from consideration and new control
limits must be computed before capability can be assessed. After deleting these samples, Figure
Morelia Mortgage Co. – 2 (from the Excel® spreadsheet called MMC08xbar&R2.xls) shows the
mean, range and control limits for the revised set of 28 samples. Using these data, we find that
the mean and the average range are as follows:
These lead to the new control limits:
Control limits for the
x
– chart are:
FIGURE Morelia Mortgage Co. – 2
Ranges
Sample number
MMC– R-Chart
Ranges
Lower control limit
Upper control limit
Center line
Chapter 8 – Measuring and Controlling Quality 105
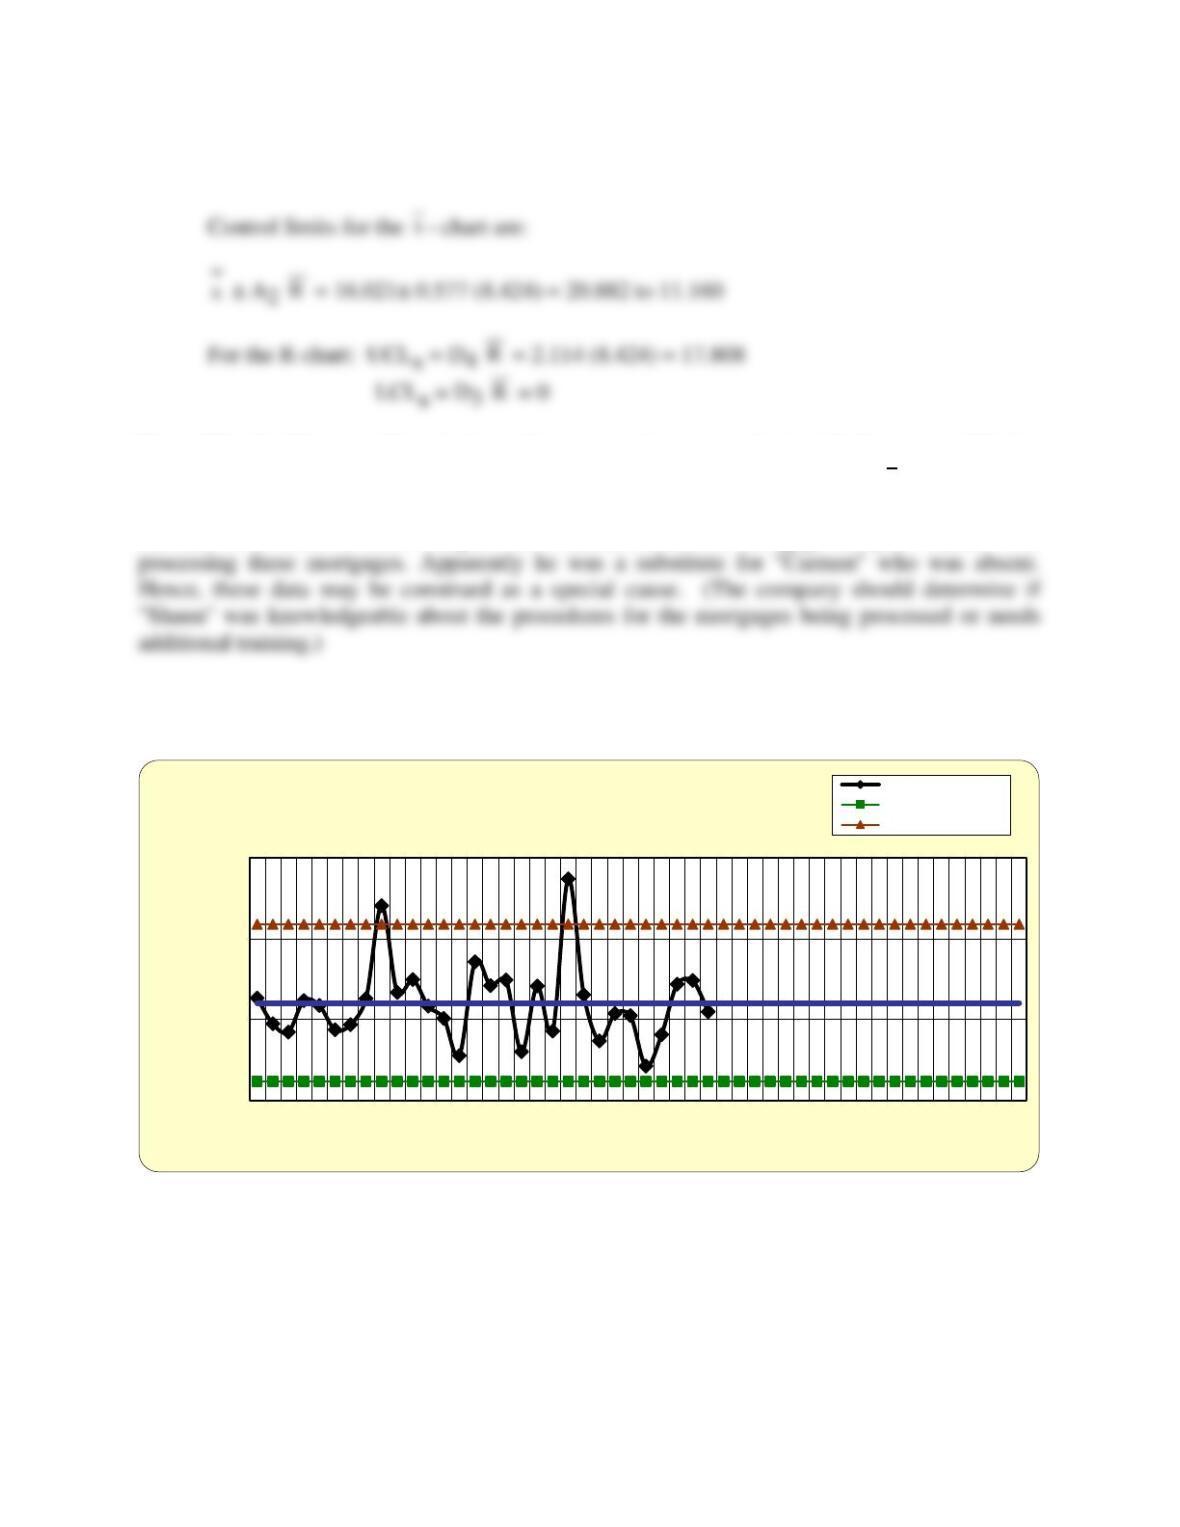
The new control charts are shown in Figure Morelia Mortgage Co.-2. The process now appears
to be in control (note that samples 9 and 21 were removed, and prior and succeeding points were
connected).
Process capability may now be evaluated. An estimate of the standard deviation from the revised
control chart statistics is
Sample number
X-bar Chart
Averages
Lower control limit
Upper control limit
Sample number
R-Chart
Ranges
Lower control limit
Upper control limit
Center line
Chapter 8 – Measuring and Controlling Quality 106
The six-standard deviation spread is 15.532 ± 3 (3.503), or 26.041 to 5.023. (If one computes
the standard deviation of the raw data after the two samples are deleted, the actual standard
Assignment II – Morelia Mortgage Company Case
2. The process manager who initiated the trial project implemented the recommendations that
resulted from the initial study. Because of her success in using control charts, MMC made a
decision to continue using them on that process. After establishing control, one additional sample
was taken over the next 20 shifts, shown in second part of the table in the MMC Case worksheet.
Evaluate whether the process remains in control, and suggest any actions that should be taken.
Consider the following issues: Does any evidence suggest that the process has changed relative
to the established control limits? If any out-of-control patterns are suspected, what might be the
cause? What should the company investigate?
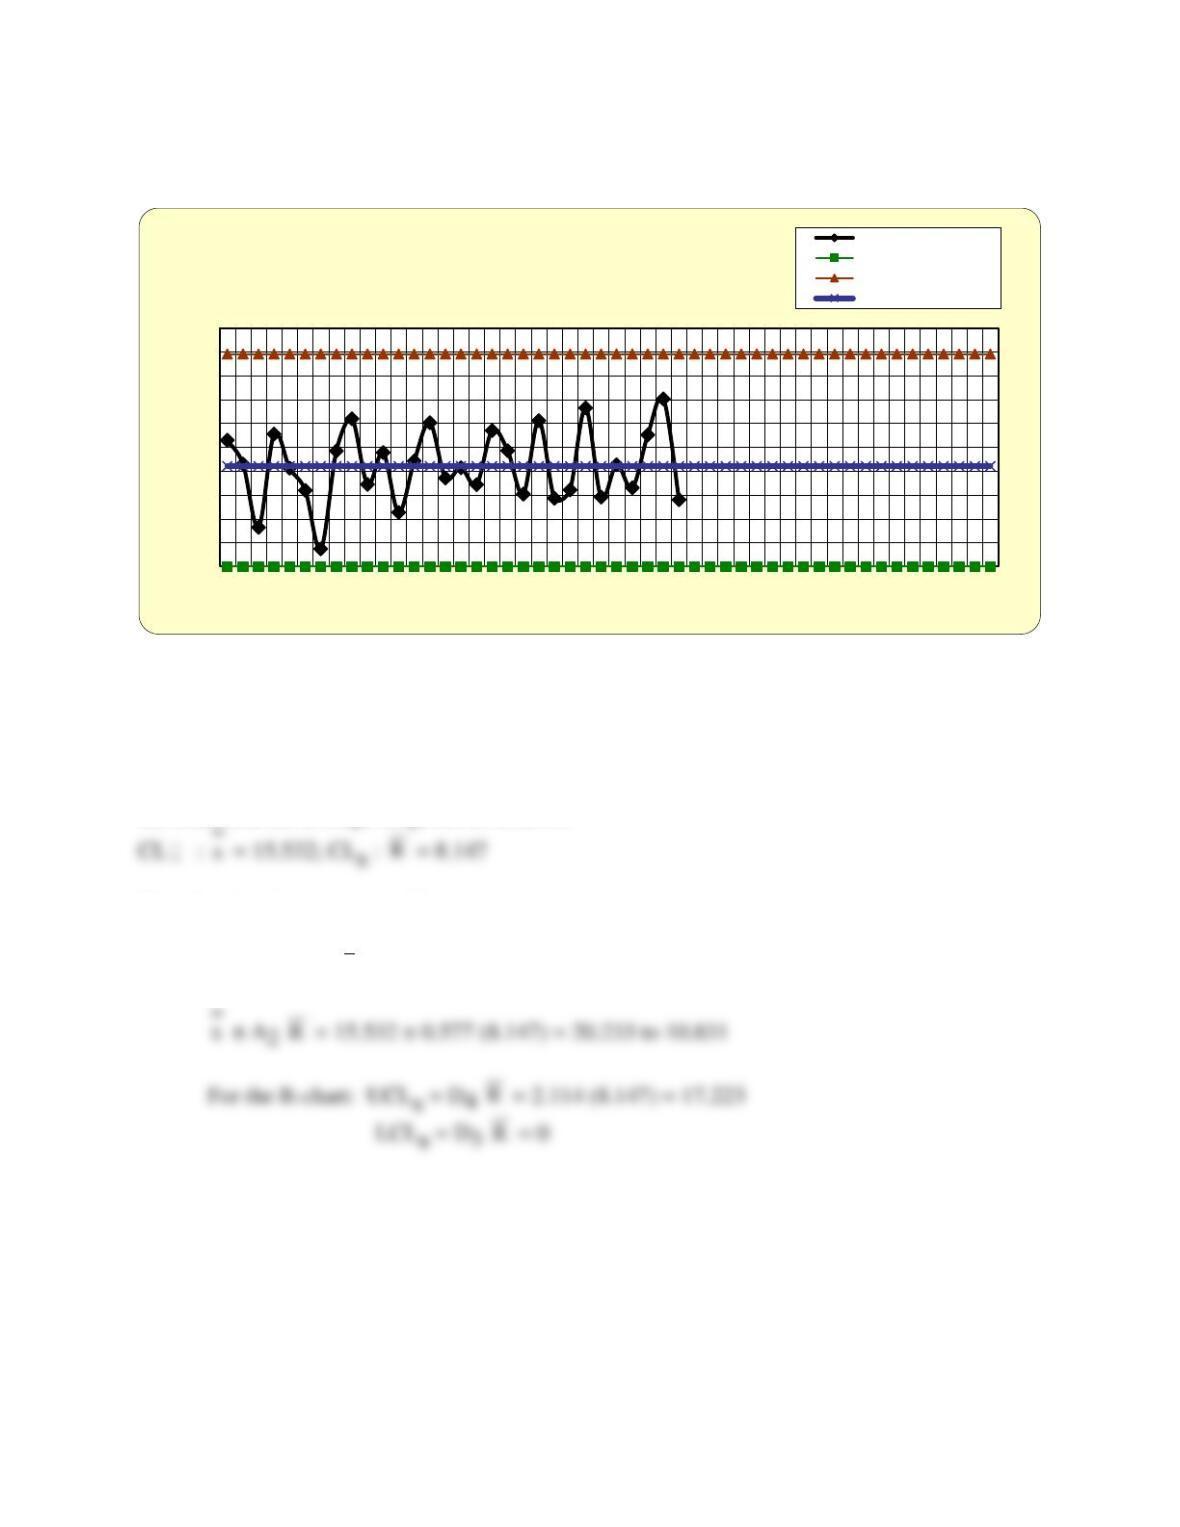
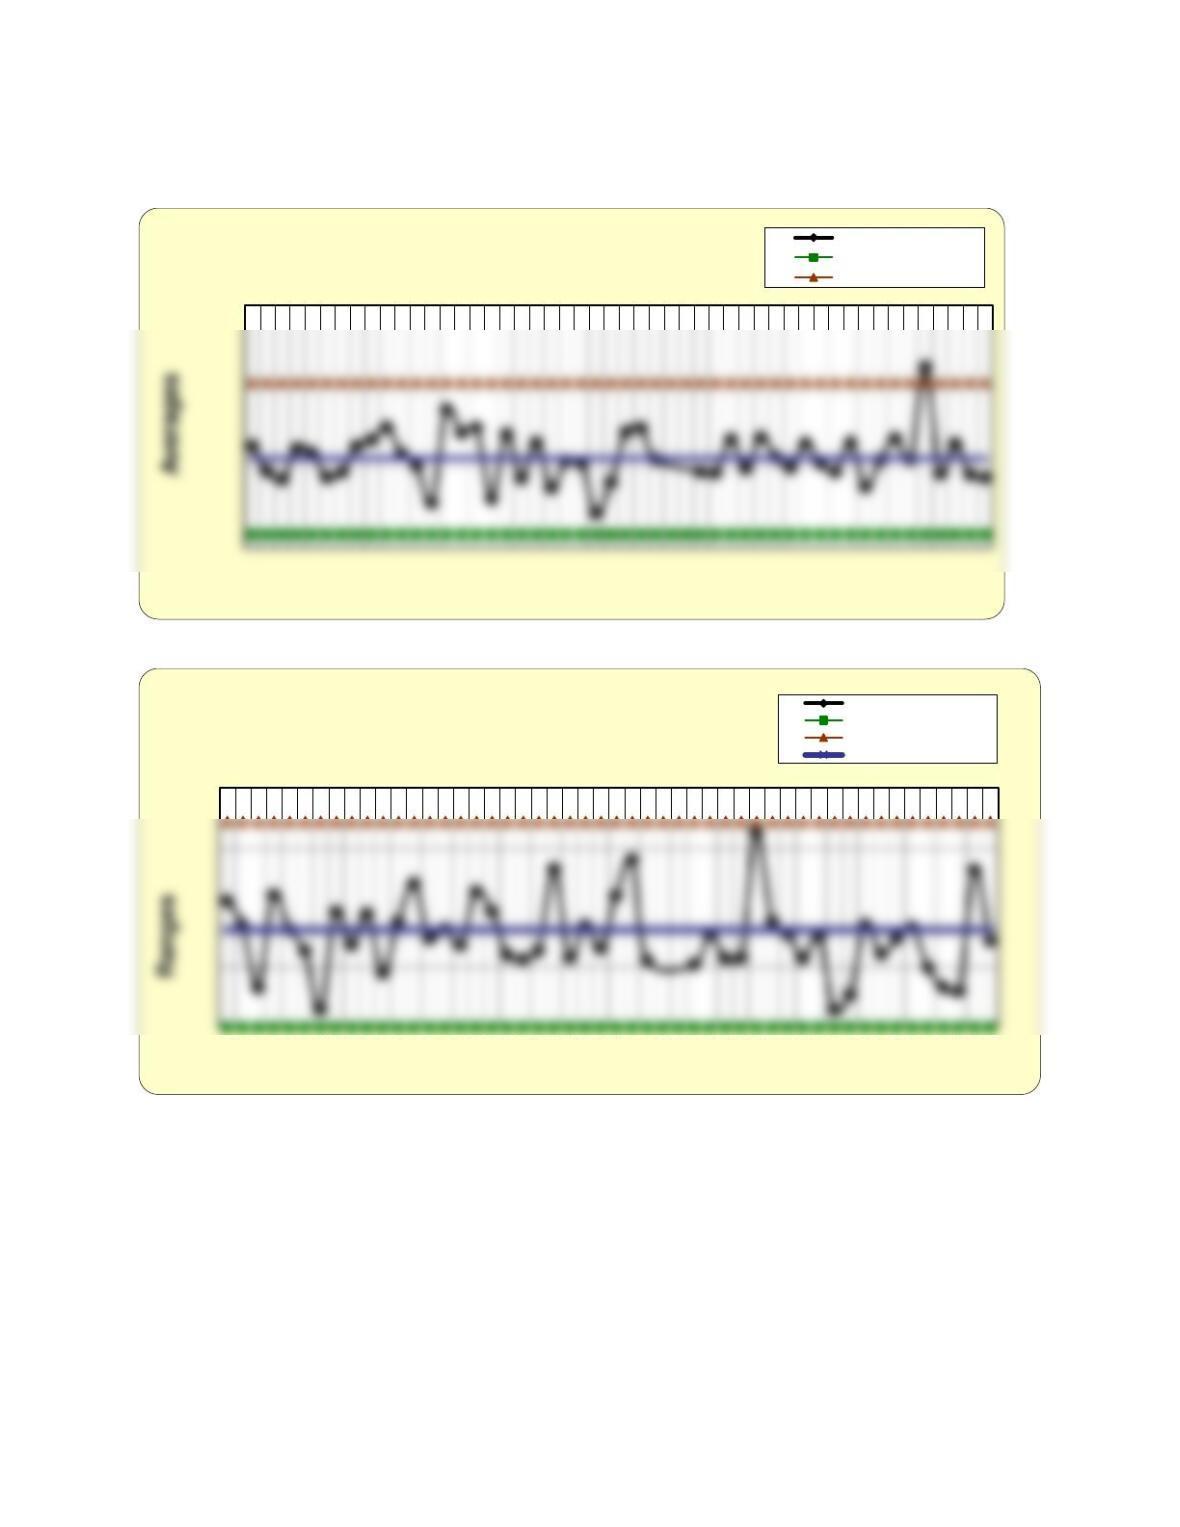
The additional 20 samples must be plotted using established control limits. It is incorrect to use
the data to find new control limits. The first set of samples established the state of control and
no process changes were made. Sample means and ranges for all 48 samples (excluding the bad
FIGURE Morelia Mortgage Co. – 3
Chapter 8 – Measuring and Controlling Quality 107
III. MONTVALLEY SHORT-HAUL LINES, INC.
The Billing Study – Part I
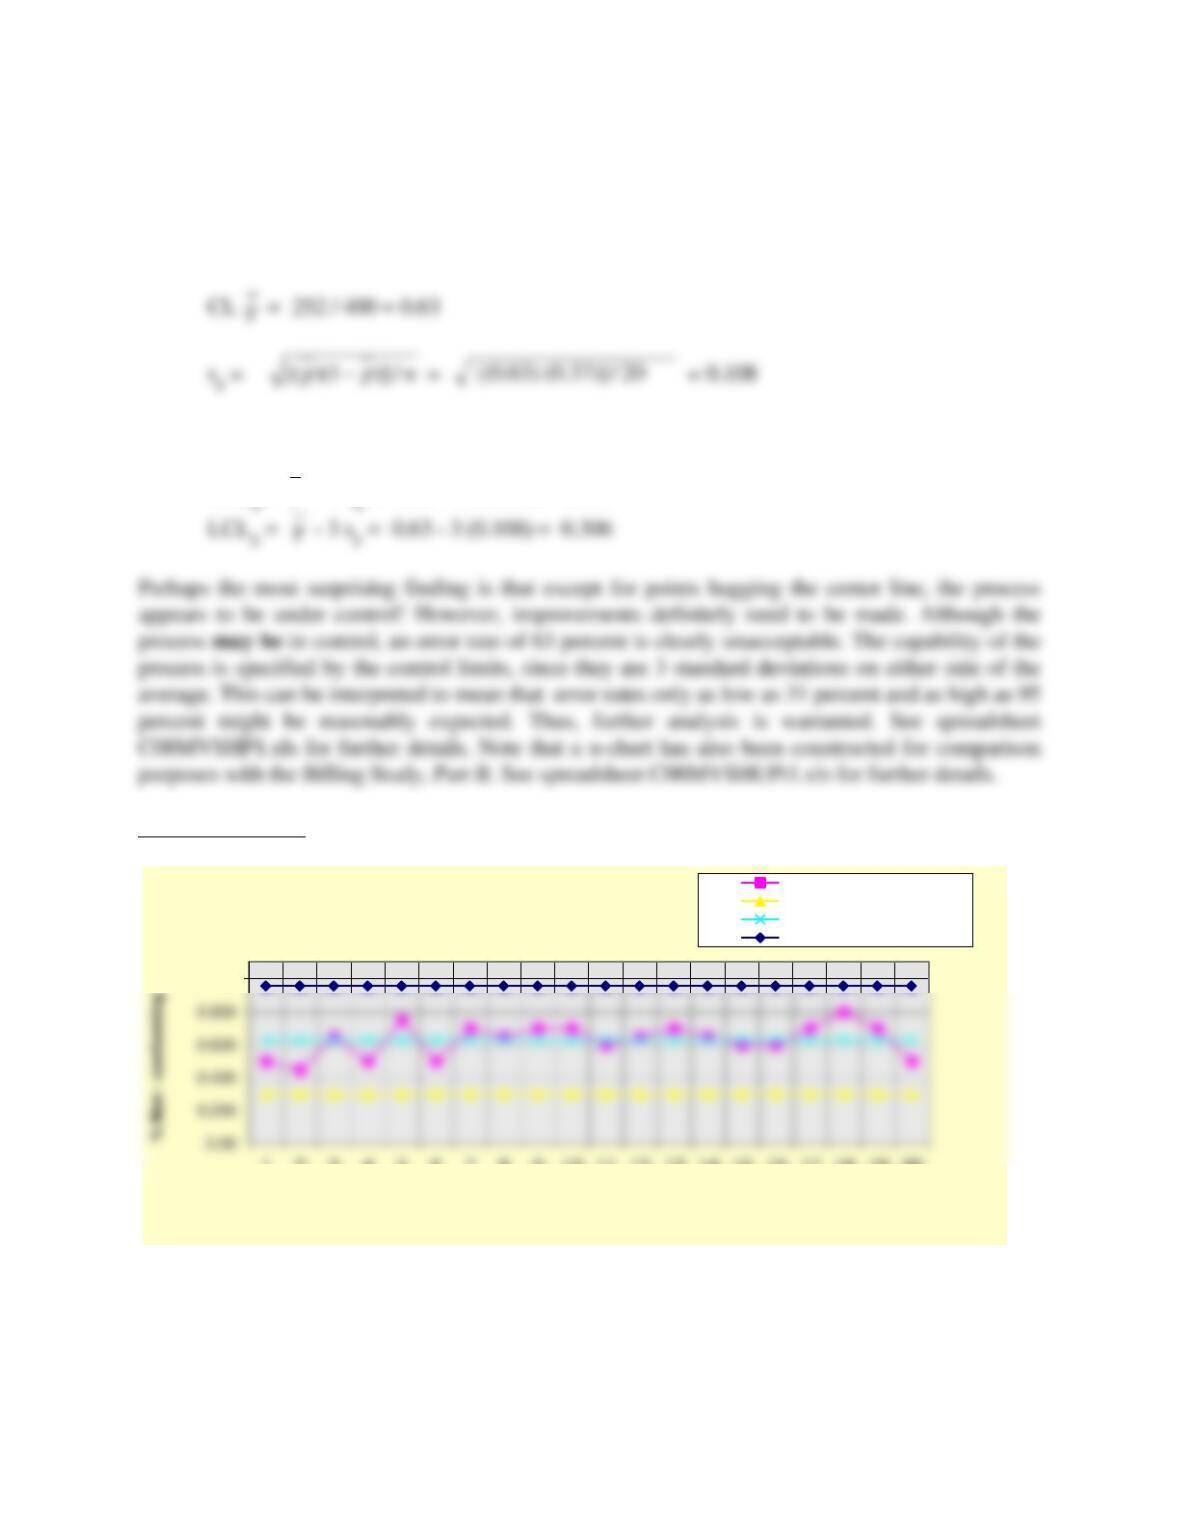
The first assignment requires the construction of a p-chart, since we are interested in the proportion
of bills in error. (Summary data is in spreadsheet C08MTISUMS.xls)The calculations are shown
below. The average proportion of bills in error is 0.63 and the standard deviation is 0.108. Using the
Sample number
X-bar Chart
Averages
Lower control limit
Upper control limit
Sample number
R-Chart
Ranges
Lower control limit
Upper control limit
Center line
Chapter 8 – Measuring and Controlling Quality 108
formulas for a p-chart, the lower and upper control limits are, respectively, 0.306 and 0.954. The
control chart is shown in Figure MVSHL-A.
Control limits:
UCLp =
p
+ 3 sp = 0.63 + 3 (0.108) = 0.954
Figure MVSHL-A
1.00
1 2 3 4 5 6 7 8 9 10 11 12 13 14 15 16 17 18 19 20
Sample number
Attribute (p) Chart p Values
Lower Control Limit
Center Line
Upper Control Limit
Chapter 8 – Measuring and Controlling Quality 109
The Billing Study After Process Improvement – Part II
The second part of the study is to analyze the distribution of actual errors identified by the
management team. The analysis consists of two phases. First, a u-chart should be constructed to
For the u-chart: 25 samples are available. Because the number of bills each day varies considerably,
individual control limits are established for each day. For the Day 1 sample, n = 54 total bills,
number of defects = 36 for all categories. The overall average,
u
, must be used to calculate the
individual control limits.
0.200
1357911 13 15 17 19 21 23 25
Sample number
Attribute (u) Chart U Values
Lower Control Limit
Center Line
Upper Control Limit
Chapter 8 – Measuring and Controlling Quality 110
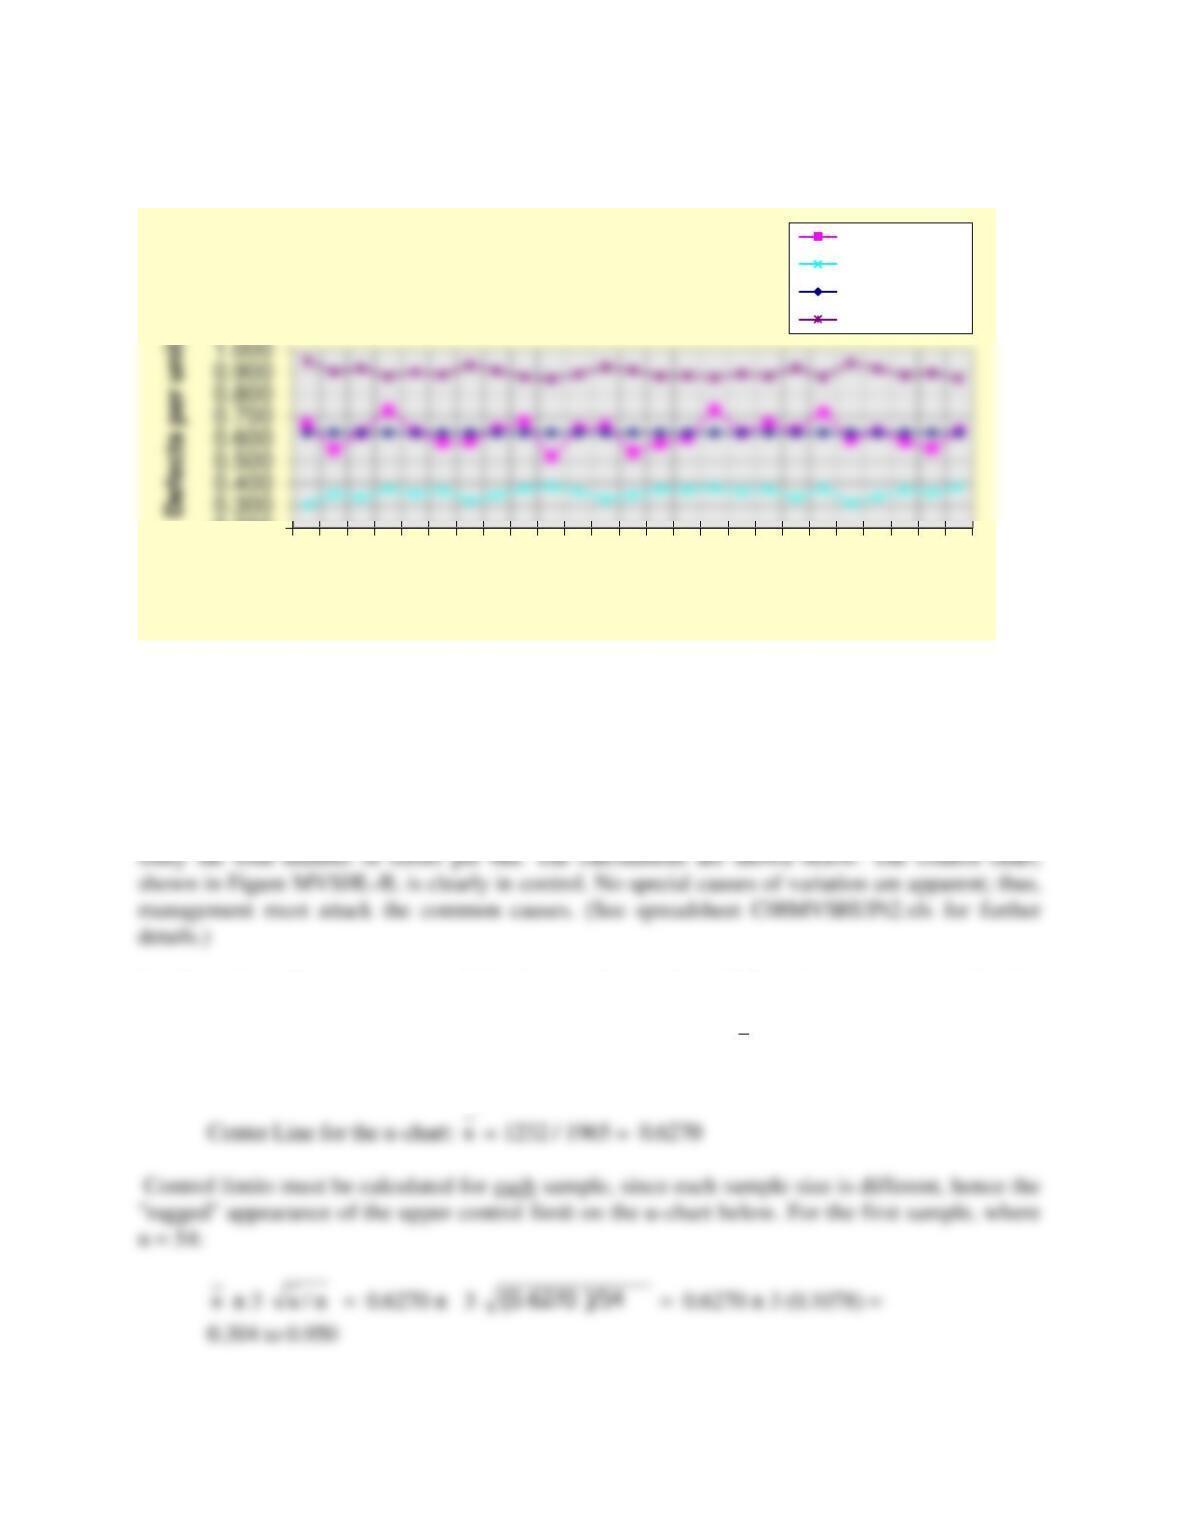
Figure MVSHL-B
Note that a p-chart has also been constructed with these data for comparison purposes with the
initial billing study, Part I, above. See spreadsheet C08MVSHP2.xls for further details.
0.500
0.550
0.600
Attribute (u) Chart
U Values
Lower Control Limit
Center Line
Upper Control Limit
0.600
0.700
Sample number
Attribute (p) Chart
p Values
Lower Control Limit
Center Line
Upper Control Limit
Chapter 8 – Measuring and Controlling Quality 111
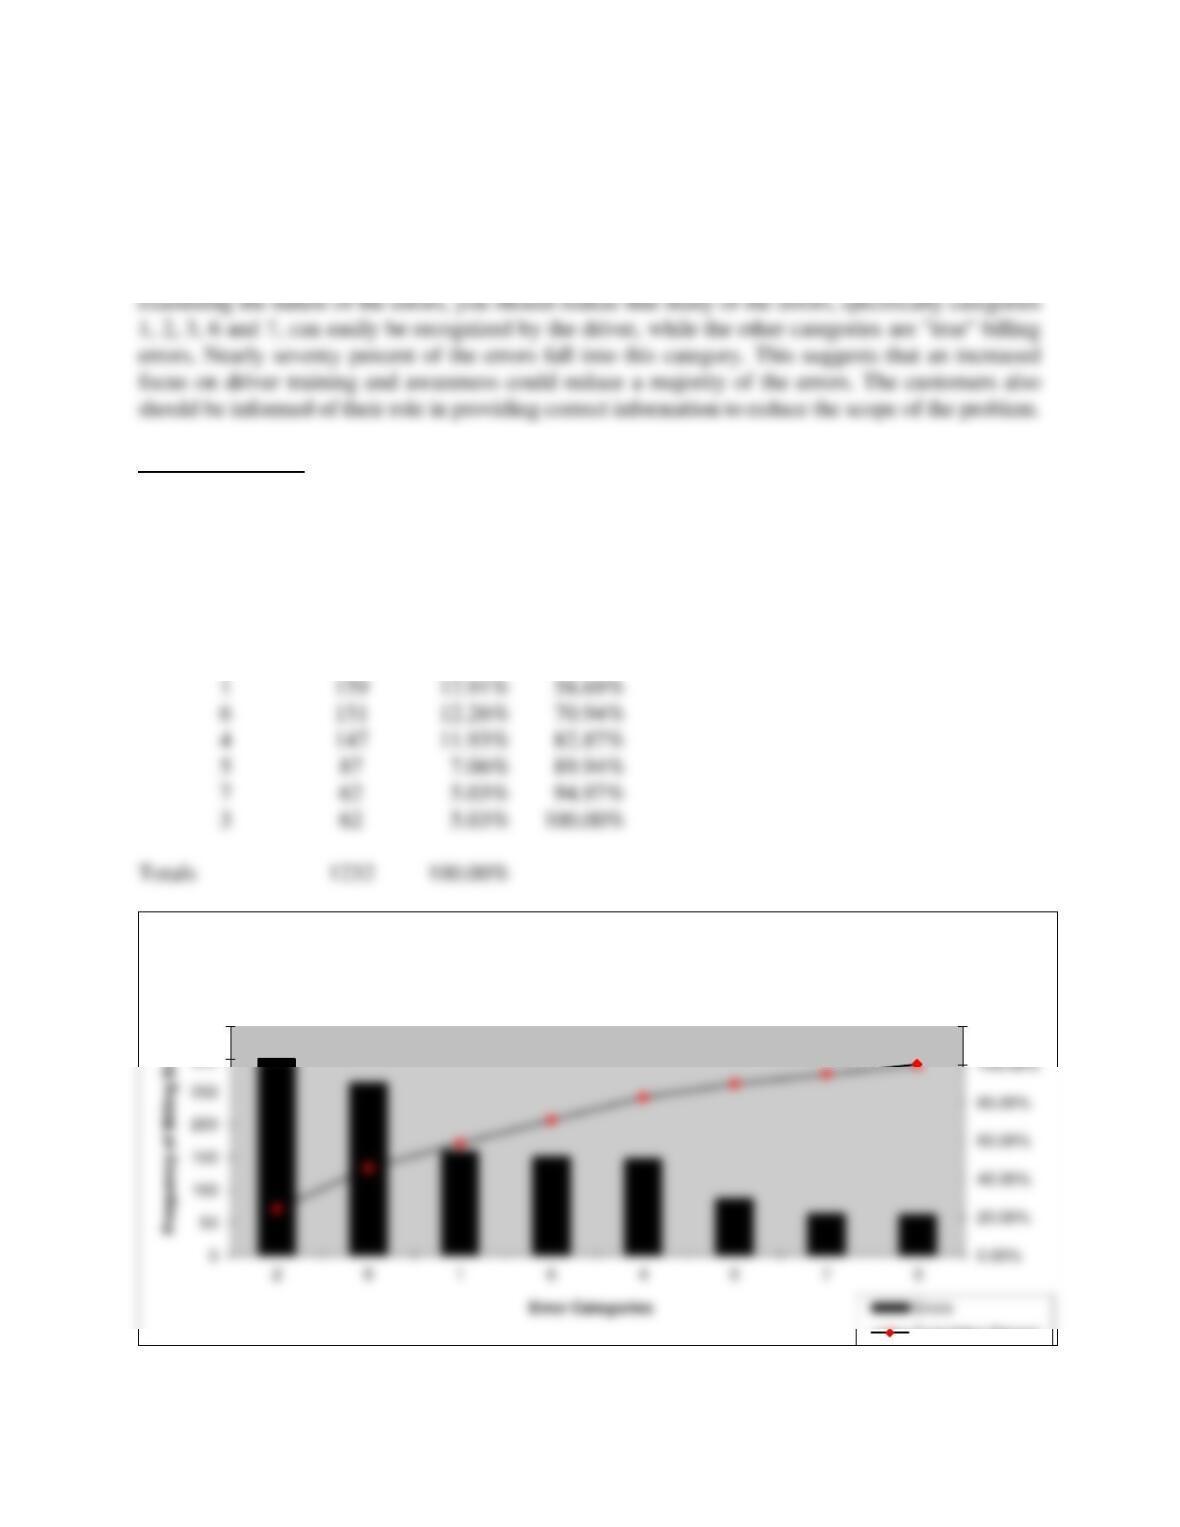
Finally, if each error category is summed, we may construct a Pareto diagram of the distribution of
errors by category as shown in Figure MVSHL-C. (See C08MVSHPARETO.xls for details.) By
Figure MVSHL-C
Montvalley Shorthaul Lines, Inc
Error Category
% of Total
Cumulative
Errors
Errors
Percent
2
300
24.35%
24.35%
8
264
21.43%
45.78%
1
159
12.91%
58.69%
6
151
12.26%
70.94%
4
147
11.93%
82.87%
5
89.94%
7
94.97%
3
Totals
120.00%
300
350
Montvalley Short-Haul Lines, Inc. Pareto
Diagram
Cumulative Percent