
Chapter 8 – Instructor Reserve Problems
1. Reboard Electronics, Inc. is a reprocessor of electronic boards used in computers. The
quality manager is trying to determine the non-conformances per unit (NPU) and the
throughput yield. The quality manager has requested that 500 board be inspected and 25
non-conformances were found.
a. Calculate the nonconformances per unit (NPU) and the throughput yield (TY).
b. If the production process consists of four steps, with step 1 having a throughput yield
of 98 percent; step 2, 99 percent; step 3, 96 percent; and step 4, 97 percent, what is the
rolled throughput yield (RTY), and the proportion nonconforming?
Answer
1. a. To calculate the NPU, use:
NPU = Number of nonconformances found/number of units inspected = 48/500 = 0.096
2. Over the last year 752 drug doses were administered at the Goodhealth clinic. Quality is
measured by the proper dosage as well as the correct drug. In two instances, the incorrect
size of pill was given, and in one case, the wrong drug was given. At what sigma level is
Goodhealth’s process?
Answer
We use 3/752 to get the number of defects per unit (DPU’s). However, there are 2
opportunities per dose (wrong size, wrong drug) to make an error. They must be
3. A gauge repeatability and reproducibility study at TenGage, Inc., collected the data for
three operators, three trials, and ten parts, as found in the worksheet Ch08Inst-Rsv.xlsx in
the Instructor Reserve folder for this chapter. Analyze these data. The part specification is
1.3 ± 0.15 inches.
Answer
3. Detailed calculations for the first operator are as follows:
x
1 = (Mijk) /nr = 38.670 /30 = 1.289
R
1 = (Rij) / n = 1.060 /10 = 0.106
x
D = max {
x
i} – min {
x
i} = 1.289 – 1.246 = 0.043
R
= (
R
i) / m = (0.096 + 0.126 +0.049) / 3 = 0.091
D4 = 2.58 ; UCLR = D4
R
= (2.58) (0.091) = 0.235, all ranges below
K1 = 3.05; K2 = 2.70 (from Table 8.3)
R
R
R
% of TV
Equipment variation = 100 0.278
0.414 = 67.15%
Operator variation [AV] = 100 0.105
0.414= 25.36%
% of Tolerence
Equipment variation = 100 0.278
0.30 = 92.67%
Operator variation [AV] = 100 0.105
0.30 = 35.00%
Variance Ratios
EV% of Total Variance = 100 𝐸𝑉2
𝑇𝑉2 = 100 0.2782
0.4142 = 45.1%
AV% of Total Variance = = 100 𝐴𝑉2
𝑇𝑉2 = 100 0.1052
0.4142 = 6.43%
For detailed spreadsheet data, see Prob08-03IRR.xlsx. Spreadsheet results confirm prior
calculations, such as these that follow:
% of Total Variation
% of Tolerance
Variance Ratios
EV
66.94%
EV
92.04%
EV
44.81%
25.40%
34.93%
4. A gauge repeatability and reproducibility study was done at EngineBlader, Inc., which
makes and repairs compressor blades for jet engines. The quality analyst collected the
data for three operators, two trials, and ten parts, as found in the worksheet Ch08Inst-
Rsv.xlsx in the Instructor Reserve folder for this chapter. Analyze these data. The part
specification is 4.7 ± 0.1 inches. Calculate the process capability indexes for the parts.
What does this tell you about the relative importance of part variation versus equipment
variation and appraiser (operator) variation in assessing the gauging system?
Answer
4. a) Detailed calculations for the first operator are as follows:
x
1 = (Mijk) /nr = 93.960 /20 = 4.698
R
1 = (Rij) / n = 0.18 /10 = 0.018
x
x
x
x
x
R
% of TV
Equipment variation = 100 0.106
0.129 = 82.17%
% of Tolerance
Equipment variation = 100 0.106
0.20 = 53.00%
Operator variation [AV] = 100 0.057
0.20 = 28.50%
Variance Ratios
EV% of Total Variance = 100 𝐸𝑉2
𝑇𝑉2 = 100 0.1062
0.1292 = 67.52%
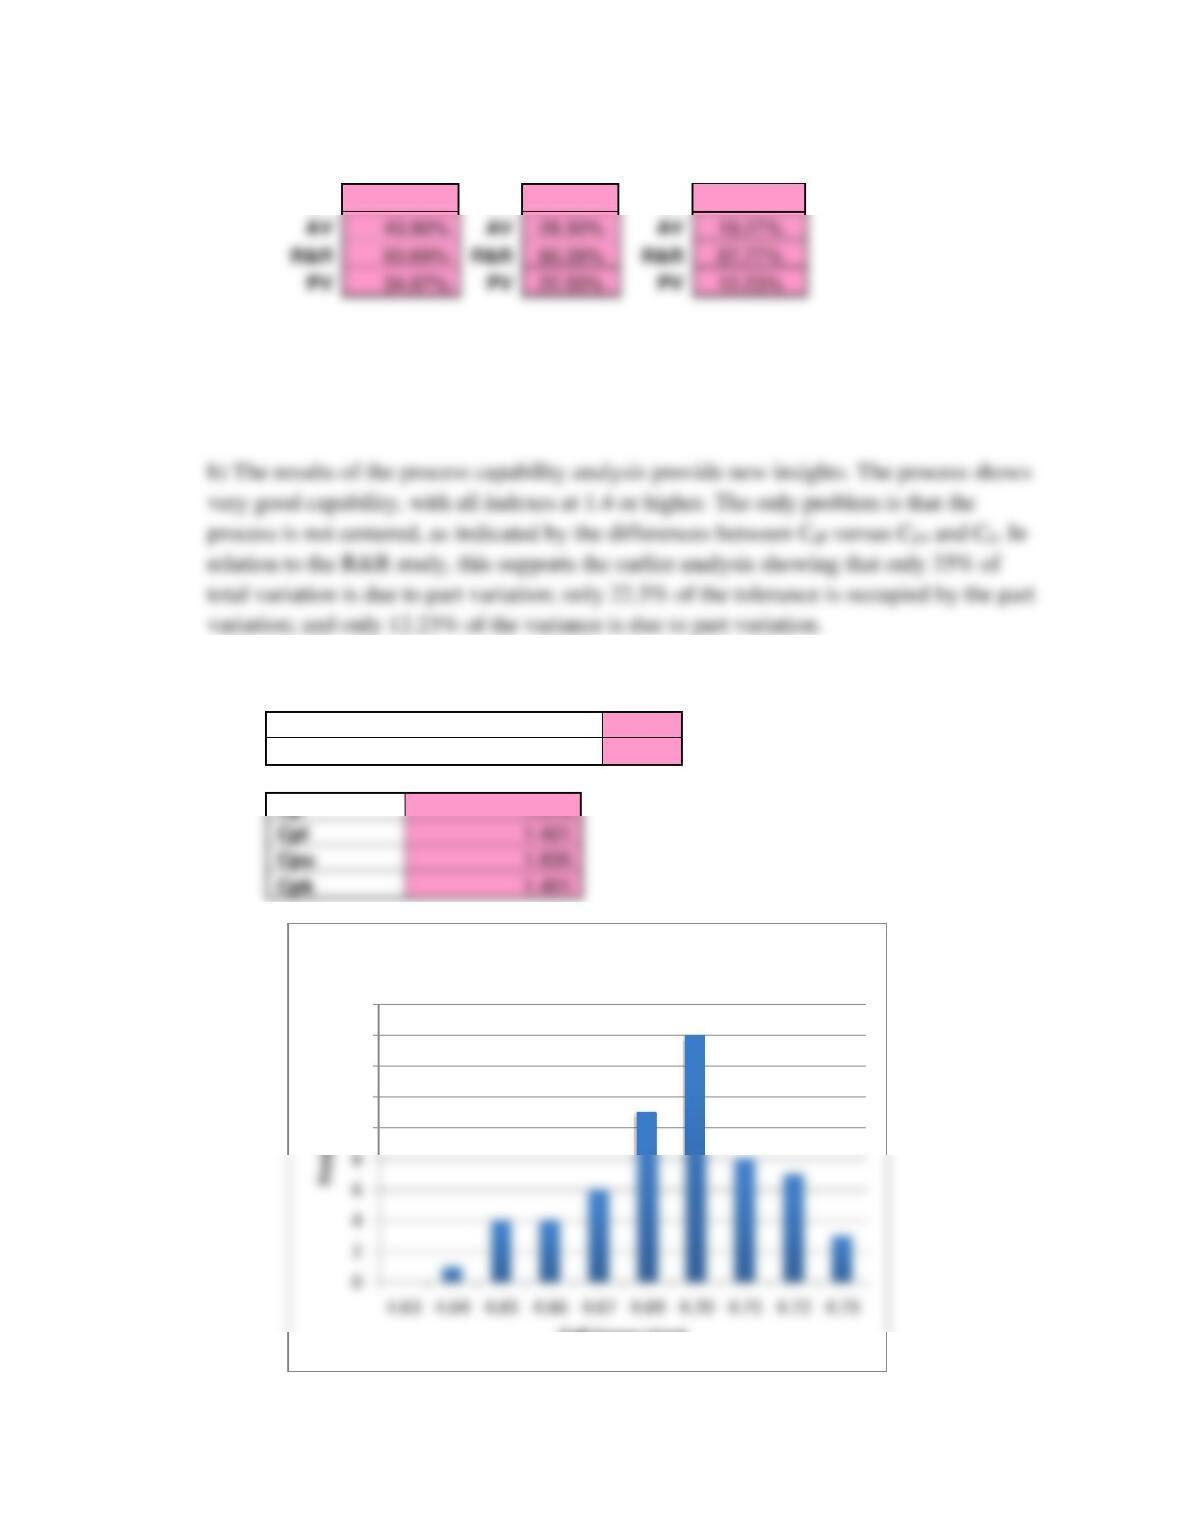
% of Total
Variation
% of Tolerance
Variance Ratios
EV
82.76%
EV
53.35%
EV
68.50%
Note that the calculator values, shown in the detailed calculations above, and computer
values do not match precisely, because a greater number of decimal places are used by
the computer to carry out calculations. All formulas are identical, however.
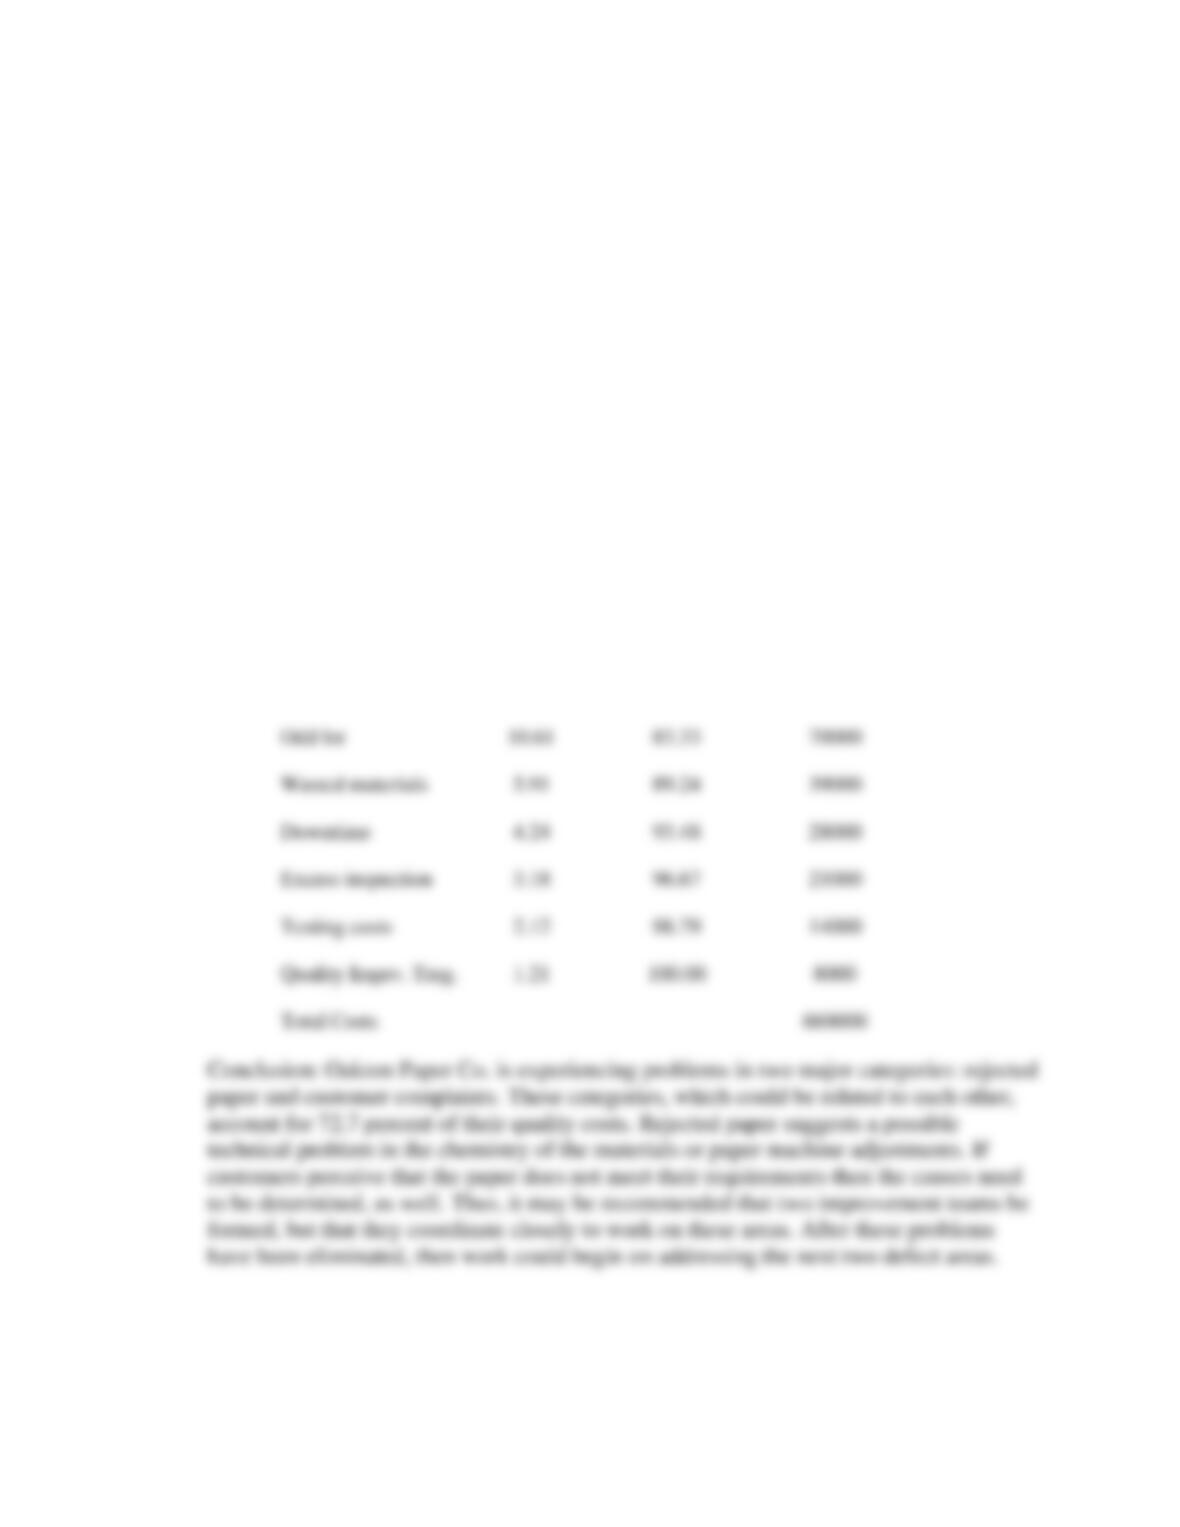
Process Capability Index Calculations
Average
4.6866
Standard deviation
0.0206
Cp
1.618
Cpl
1.401
Cpu
1.835
Cpk
1.401
10
12
14
16
18
Cell Upper Limit
Histogram
28.30%
19.27%
R&R
60.39%
87.77%
PV
PV
22.55%
PV
12.23%
5. The cost data found in worksheet C08DataInsRsv.xlsx was taken from a paper
manufacturing process at Oakton Paper Company by cost category. Prepare a spreadsheet
and perform graphical analysis to show the “significant few” cost categories on which
Oakton should concentrate. Based on your analysis make a recommendation for
management on how they should act to improve quality.
Answer
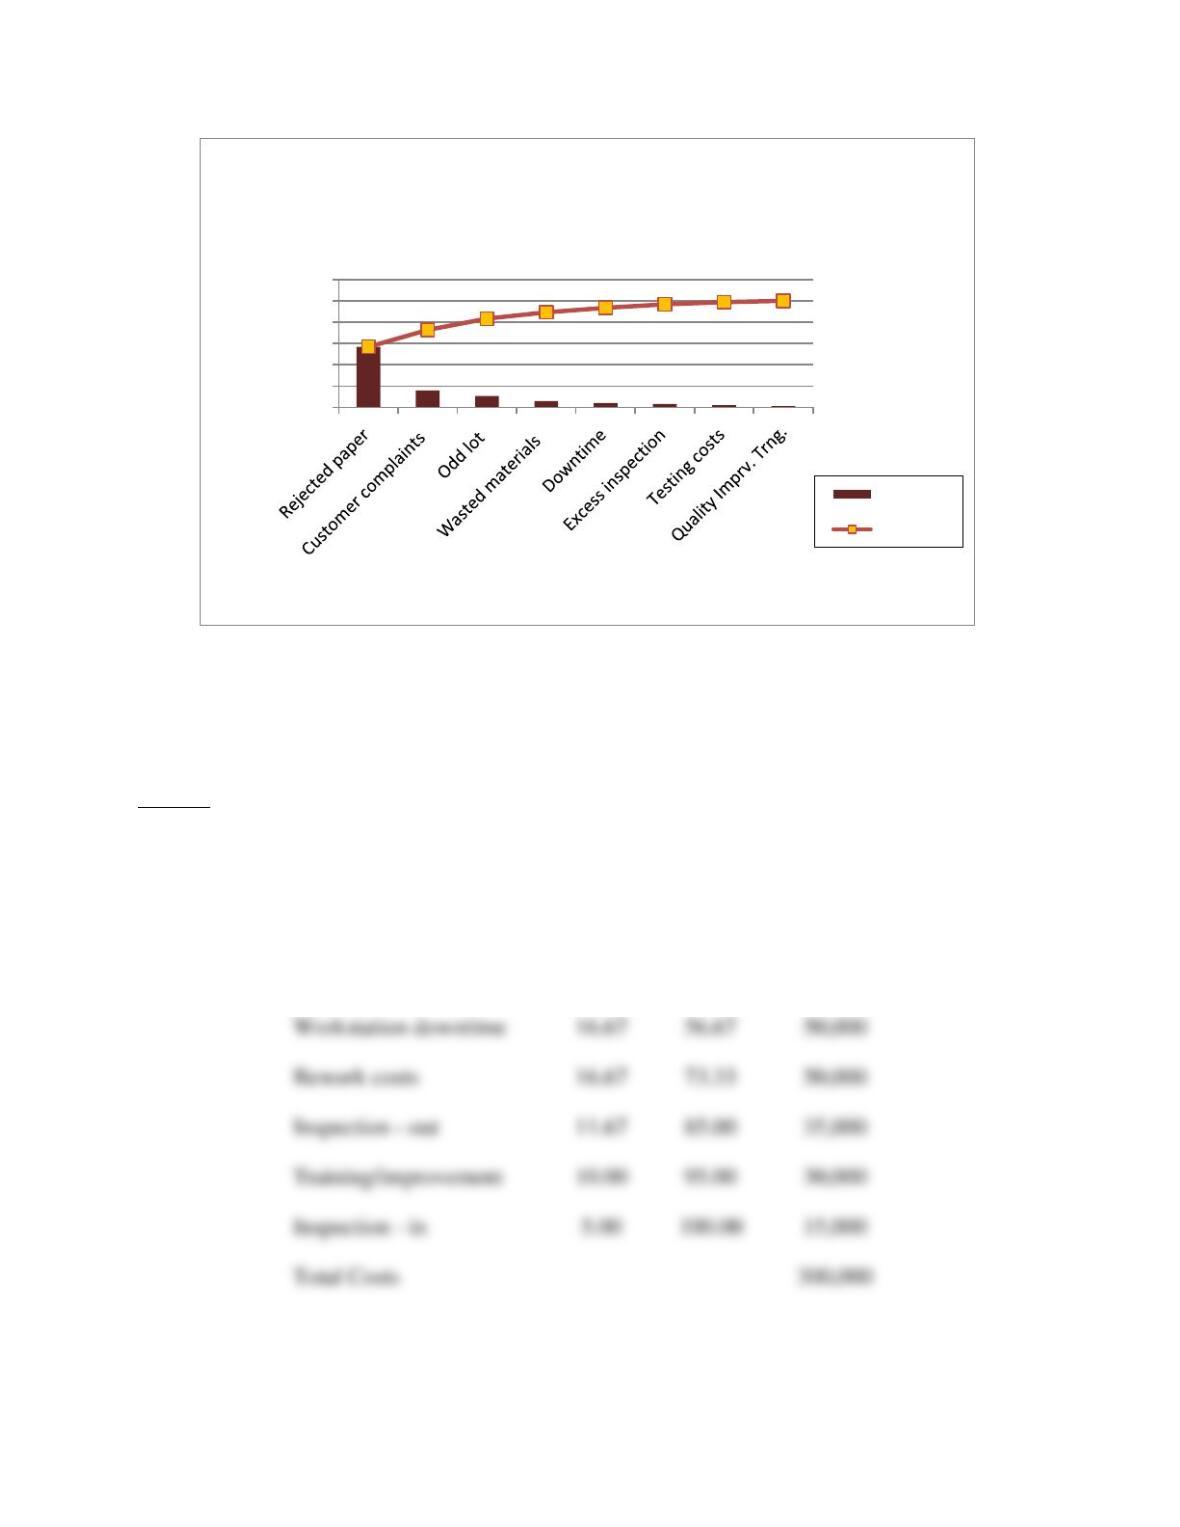
See the following table and figure for Pareto analysis, based on the data in spreadsheet
C08DataInsRsv.xlsx.
OAKTON PAPER COMPANY
QUALITY COSTS AND PERCENTAGES
Percent
Cumulative %
Cost
Rejected paper
56.82
56.82
375000
Customer complaints
15.91
72.73
105000
Odd lot
10.61
83.33
Downtime
4.24
93.48
Excess inspection
3.18
96.67
Testing costs
2.12
98.79
Quality Imprv. Trng.
1.21
Total Costs
6. Data for Worldwide Measursys Repairs, Inc. cost of quality categories are found in the
spreadsheet C08DataInsRsv.xlsx. Determine which categories contribute the most to the
cost of quality at Worldwide. Show this, graphically, in a spreadsheet, and make a
recommendation to management.
Answer The Pareto chart for Worldwide Measursys Repairs, Inc. is shown below.
WORLDWIDE MEASURSYS REPAIRS, INC.
QUALITY COSTS AND PERCENTAGES
Percent
Cumulative %
Cost
Customer returns
40.00
40.00
$120,000
0.00%
20.00%
40.00%
60.00%
80.00%
100.00%
120.00%
Percent within Cost Categories
Quality Cost Categories
Pareto Chart for Oakton Paper Co.
Percent
Cumulative
Workstation downtime
Rework costs
Inspection – out
Training/improvement
Inspection – in
5.00
Total Costs
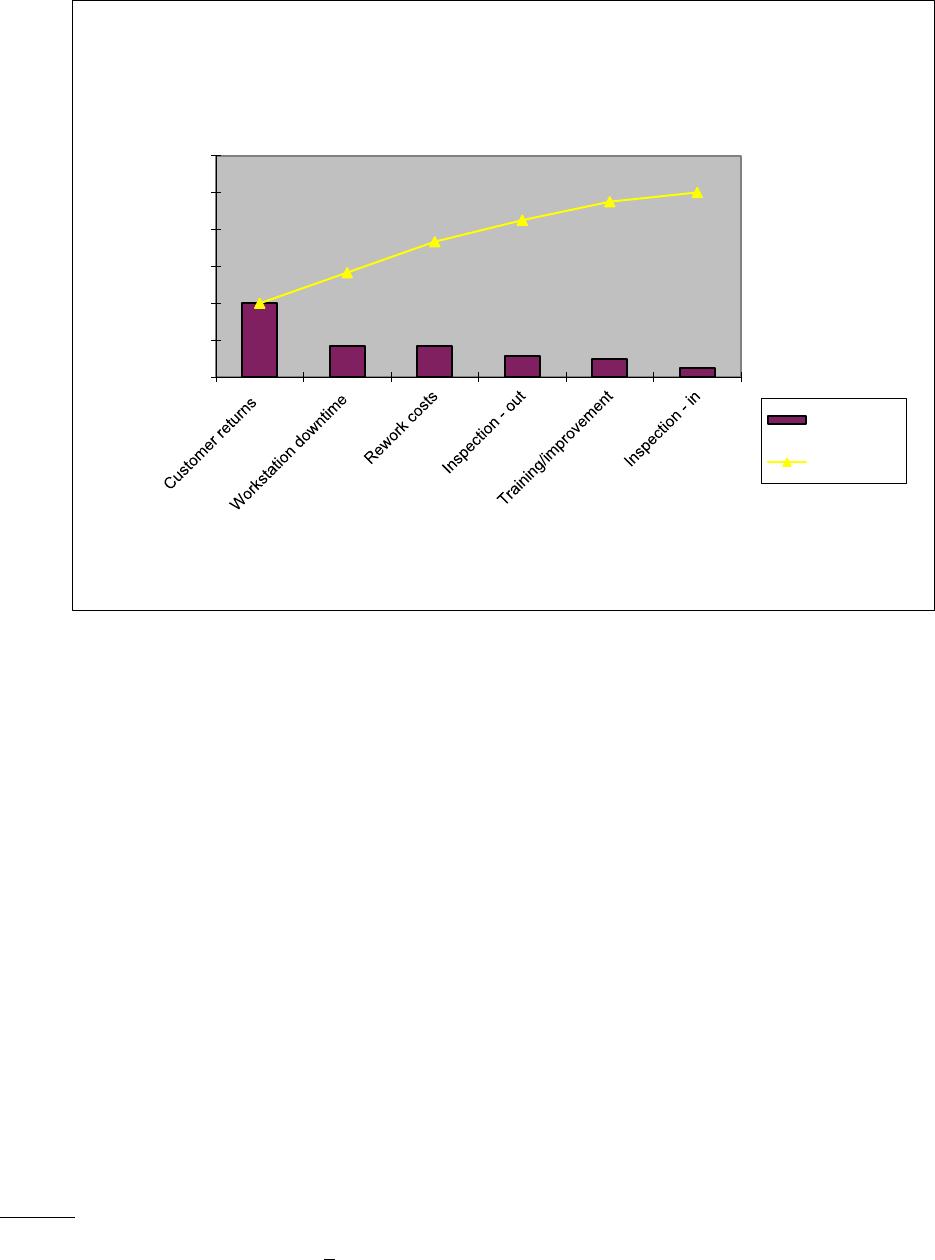
The data show that two categories of customer returns and workstation downtime total
56.7 percent of the defects. These two are possibly related, and may indicate “short
staffing,” and lack of training of setup personnel. Only 10% of total quality cost is
allocated to prevention (training/improvement). Steps should be taken to analyze root
causes for these problem areas in order to correct them as quickly as possible.
7. The temperature in a computer lab at Coyote University is very important for proper
functioning of the computer equipment. The data in the worksheet C08DataInsRsv.xlsx
show the results of 30 samples of 5 each, taken at random at different times of day over a
three month time period. Calculate the process capability statistics for the temperature in
the computer lab at Coyote University. The upper tolerance limit is 76 and the lower
tolerance limit is 68. What recommendation would you make to management concerning
the process, based on these findings?
Answer
The sample statistics are:
x
= 72.071; s = 1.268
0.00%
20.00%
40.00%
60.00%
80.00%
100.00%
120.00%
Percent Within Defect Category
Defect Categories
Pareto Chart for Worldwide Measursys Repairs
Percent
Cumulative %
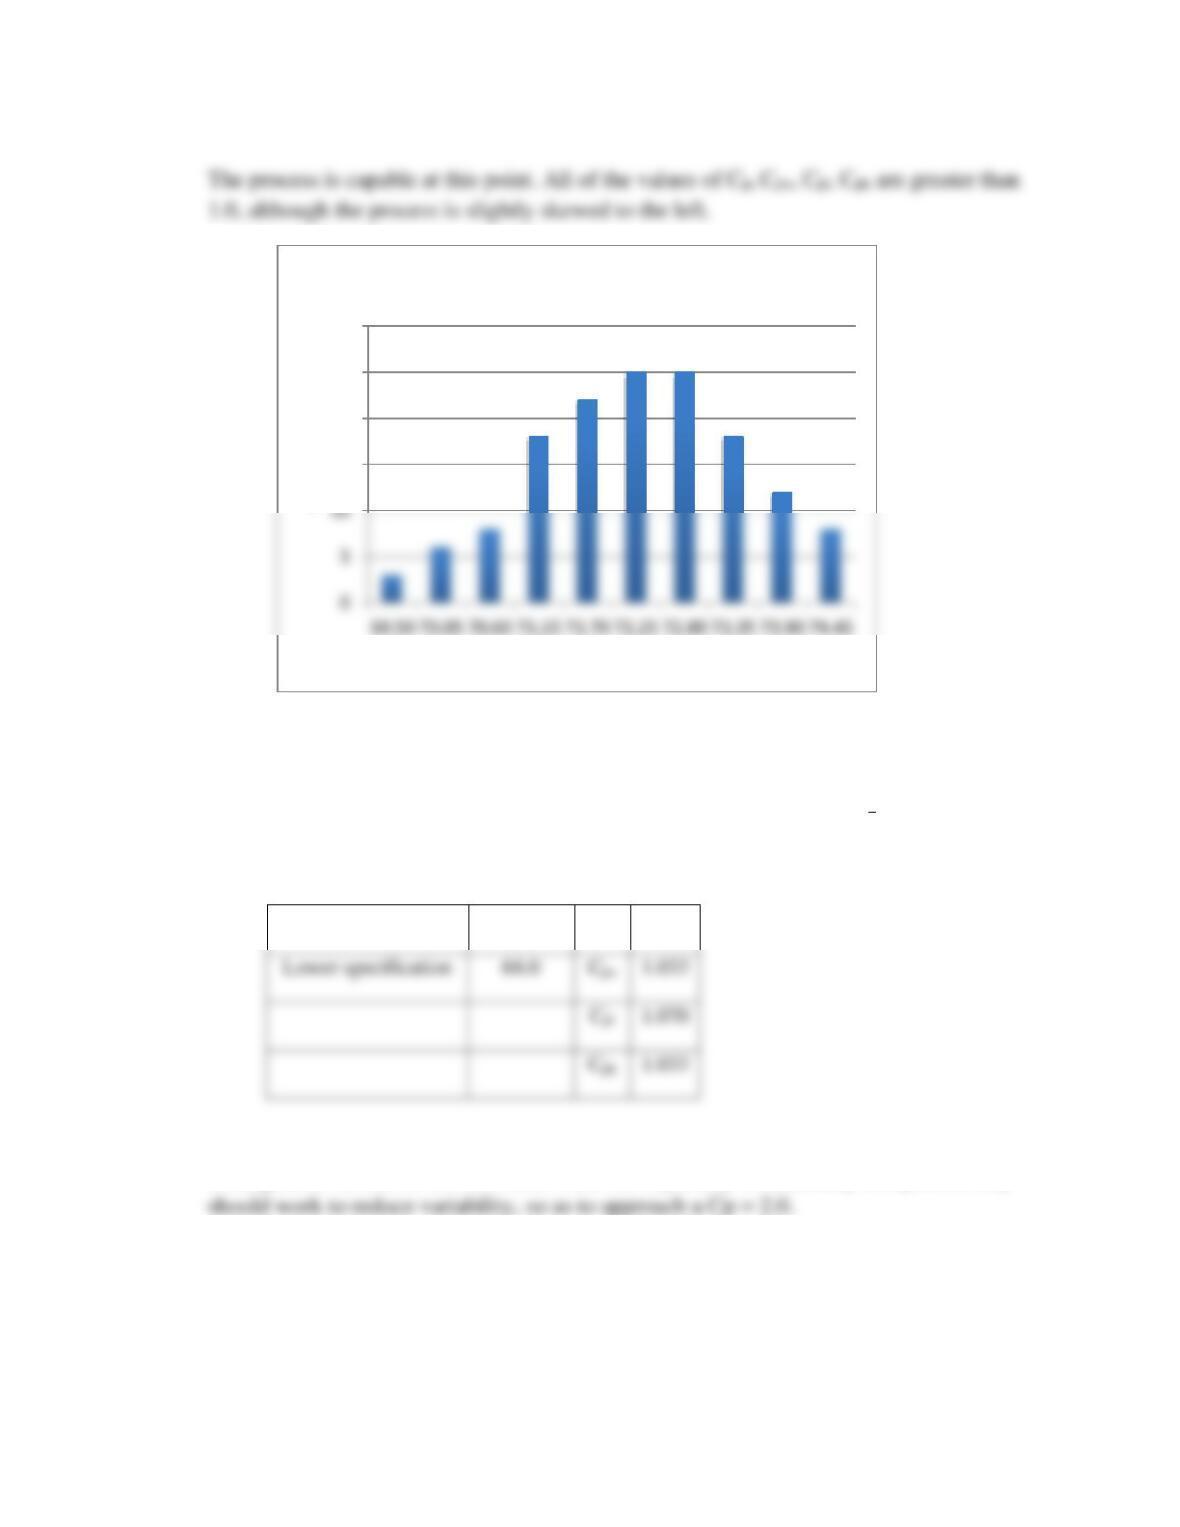
Note that the spreadsheet uses an actual standard deviation of s = 1.268 calculated from
all of the sample values. This numeric value is the overall standard deviation for all
sample values, and is not the same average statistic, such would be obtained by summing
the standard deviations of each group of 10, then dividing by 15 to get
s
.
Process Capability
Upper specification
76.0
Cp
1.051
68.0
1.033
1.070
1.033
Management should be advised that, while the capability is minimally acceptable, they
8. Metropole Hospital is working on reducing waiting time in order to give customers better
service in their waiting rooms. Fifty samples of size 6 were taken at random times from
their main waiting room. These data can be found in the worksheet C08Data-InstRsv.xlsx
for this problem.
15
20
25
30
Frequency
Cell Upper Limit
Histogram
a. Compute the mean and range of each sample, and the control limits, and plot them on
x
and R control charts.
b. Does the process appear to be in statistical control? Why or why not?
Answer
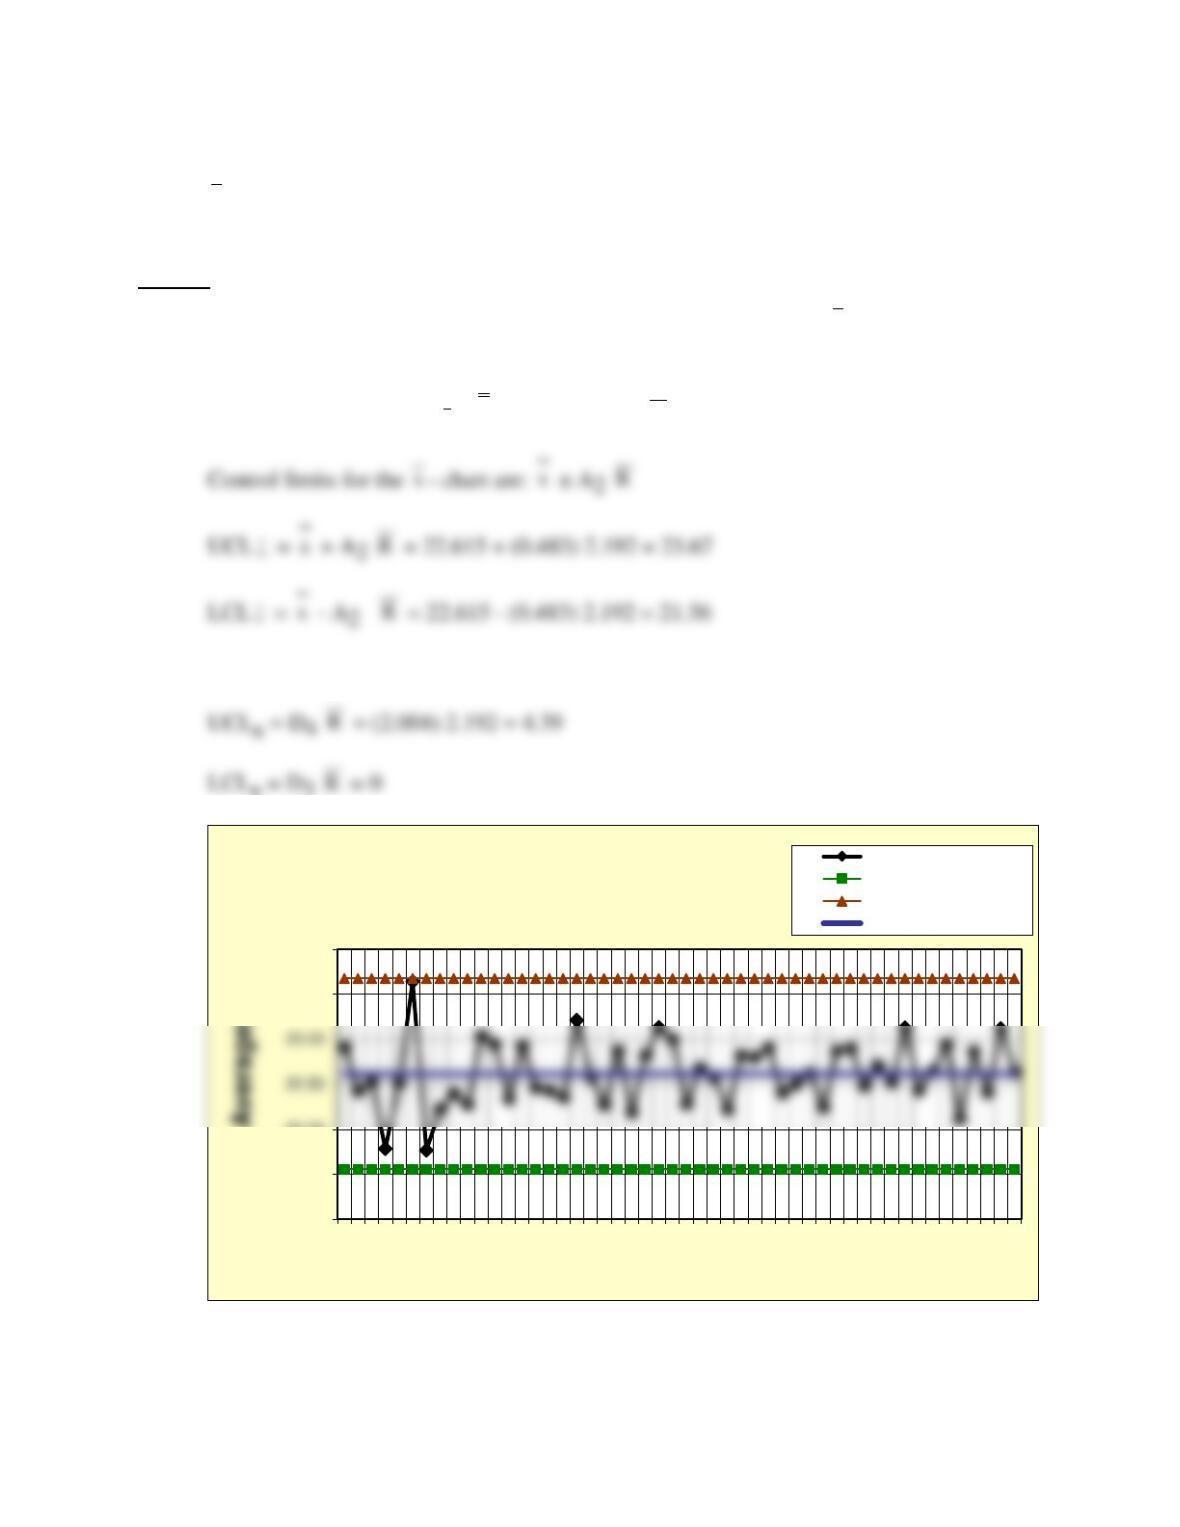
Results from the 50 samples of 6 for Metropole show that both the
x
and R charts are
apparently out of control. (See spreadsheet Prob08-08InsRsvXR.xls for details).
For the Center Lines, CL
x
:
x
= 22.615; CLR:
R
= 2.192
For the R-chart:
R
21.00
21.50
22.00
23.50
24.00
1 3 5 7 9 11 13 15 17 19 21 23 25 27 29 31 33 35 37 39 41 43 45 47 49
Averages
Sample number
Prob. 8-08 X-bar Chart
Averages
Lower control limit
Upper control limit
Center line
x
x
x
R
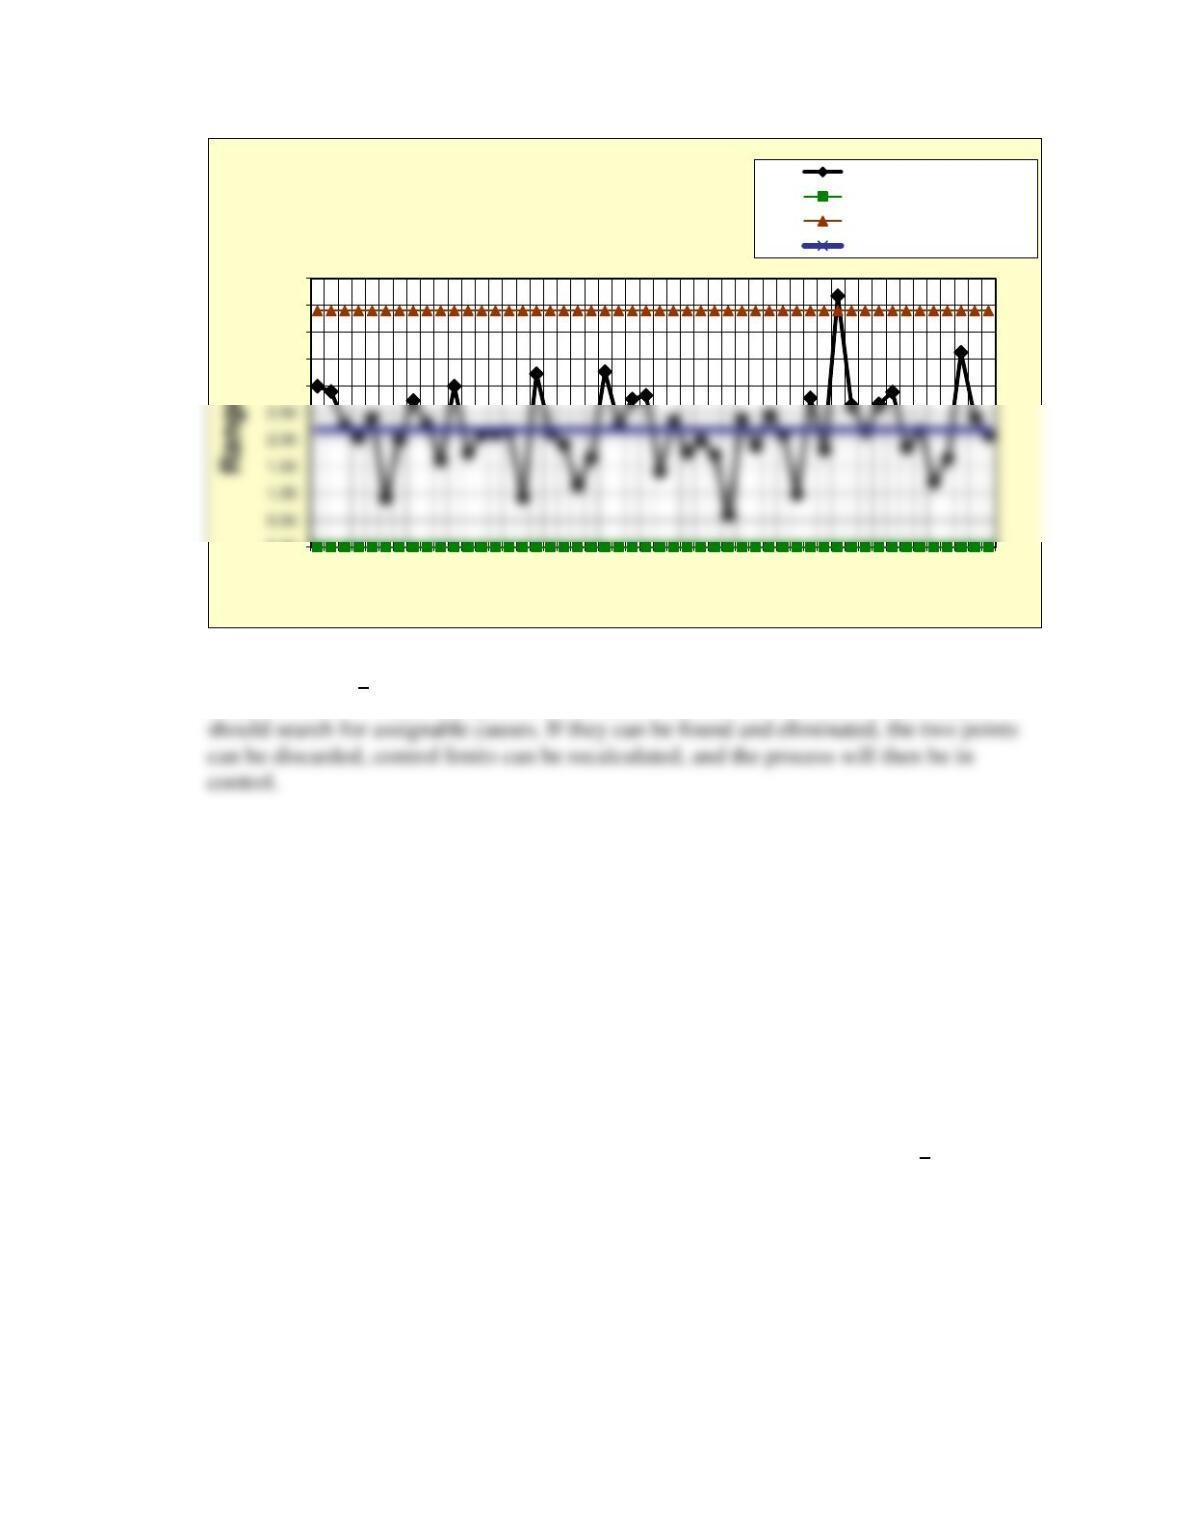
Point #6 on the
x
– chart and point #39 on the R chart are out of control. The analyst
9. The data in worksheet C08Data-Rsvprob.xlsx for Prob. 8-09 list electrical resistance
values (ohms) for 50 samples of size 5 that were taken from Babbage Chips, Inc.’s
computer chip-making process over a 25-hour period.
a. Compute the mean, standard deviation and other descriptive statistics for the data.
b. Calculate the control limits and construct the x– and R-charts, using the first 30
samples. Is the process under control at that point?
c. Specifications for the process are 9.2 ± 3.2 ohms. If the process is under control,
calculate the capability indexes, Cpu, Cpl, Cp, and Cpk using the part of the
x
and R-
charts Excel template that calculates the process capability. What do the indexes
indicate?
d. After calculating the control limits, the last 20 samples were collected. When plotted
using the control limits calculated earlier, does the process appear to be in statistical
control? Why or why not? What should be done if it is not under control?
0.00
3.00
3.50
4.00
4.50
5.00
1 3 5 7 9 11 13 15 17 19 21 23 25 27 29 31 33 35 37 39 41 43 45 47 49
Sample number
Prob. 8-08 R-Chart
Ranges
Lower control limit
Upper control limit
Center line
Answer
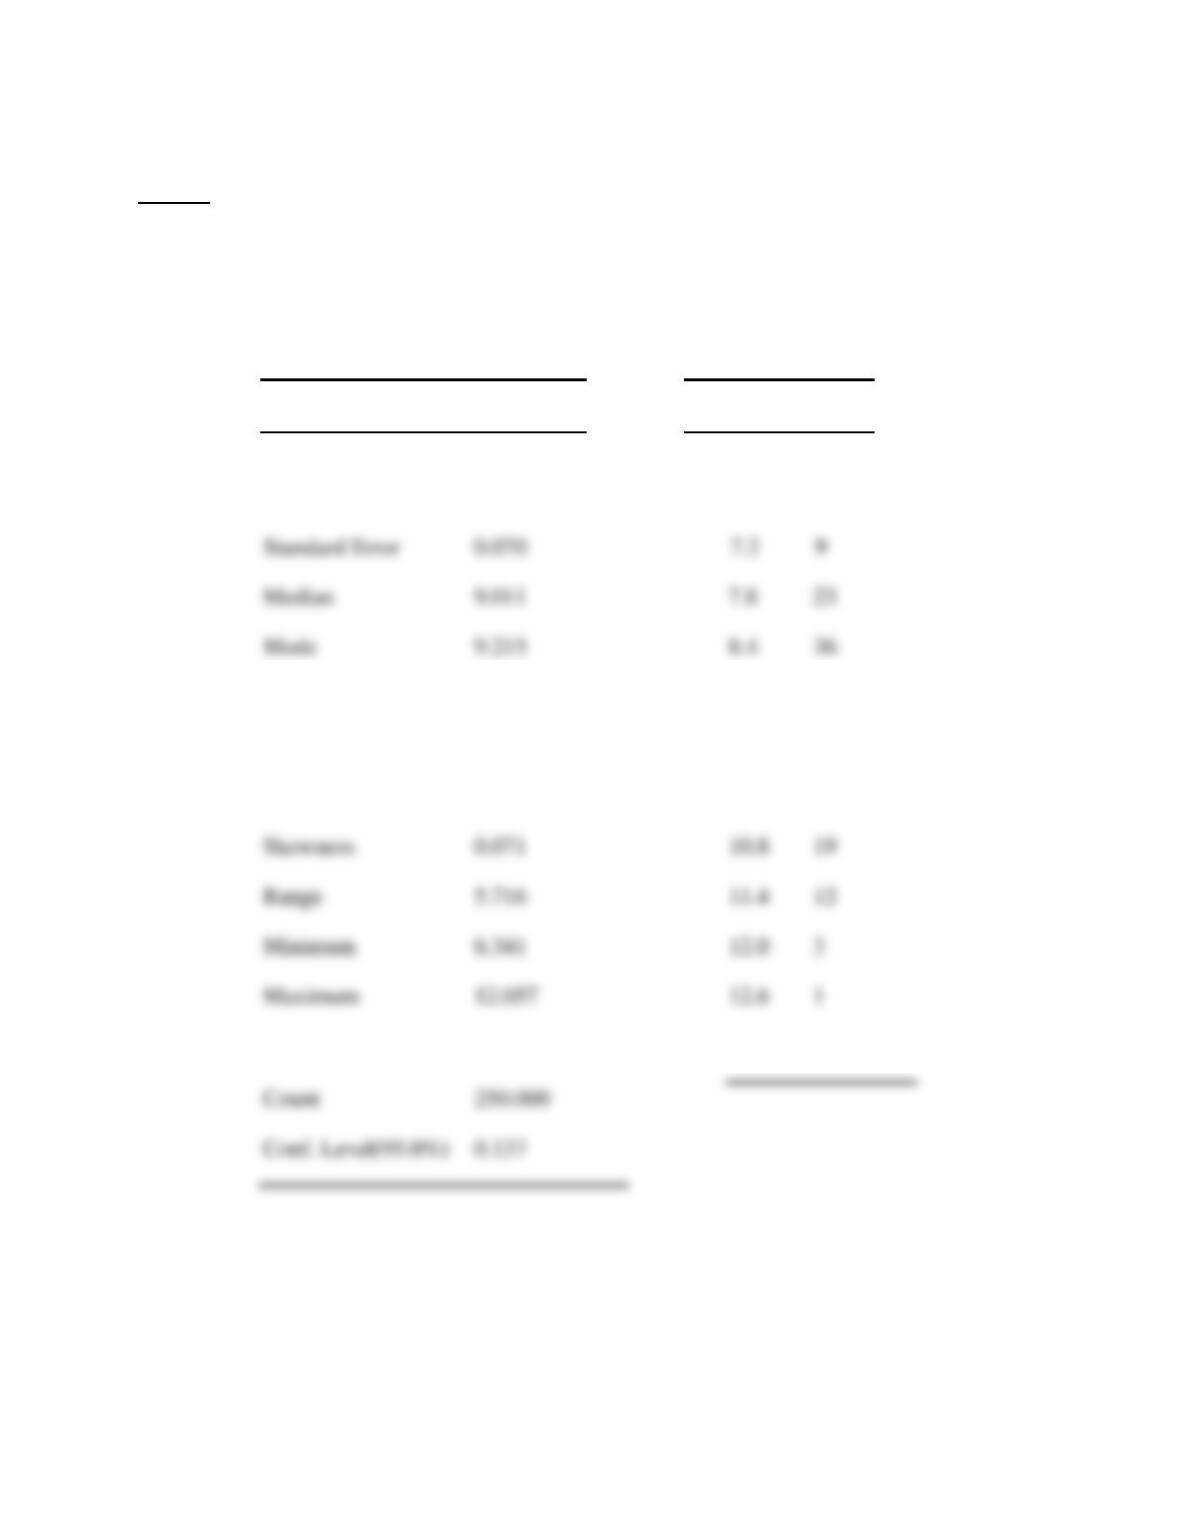
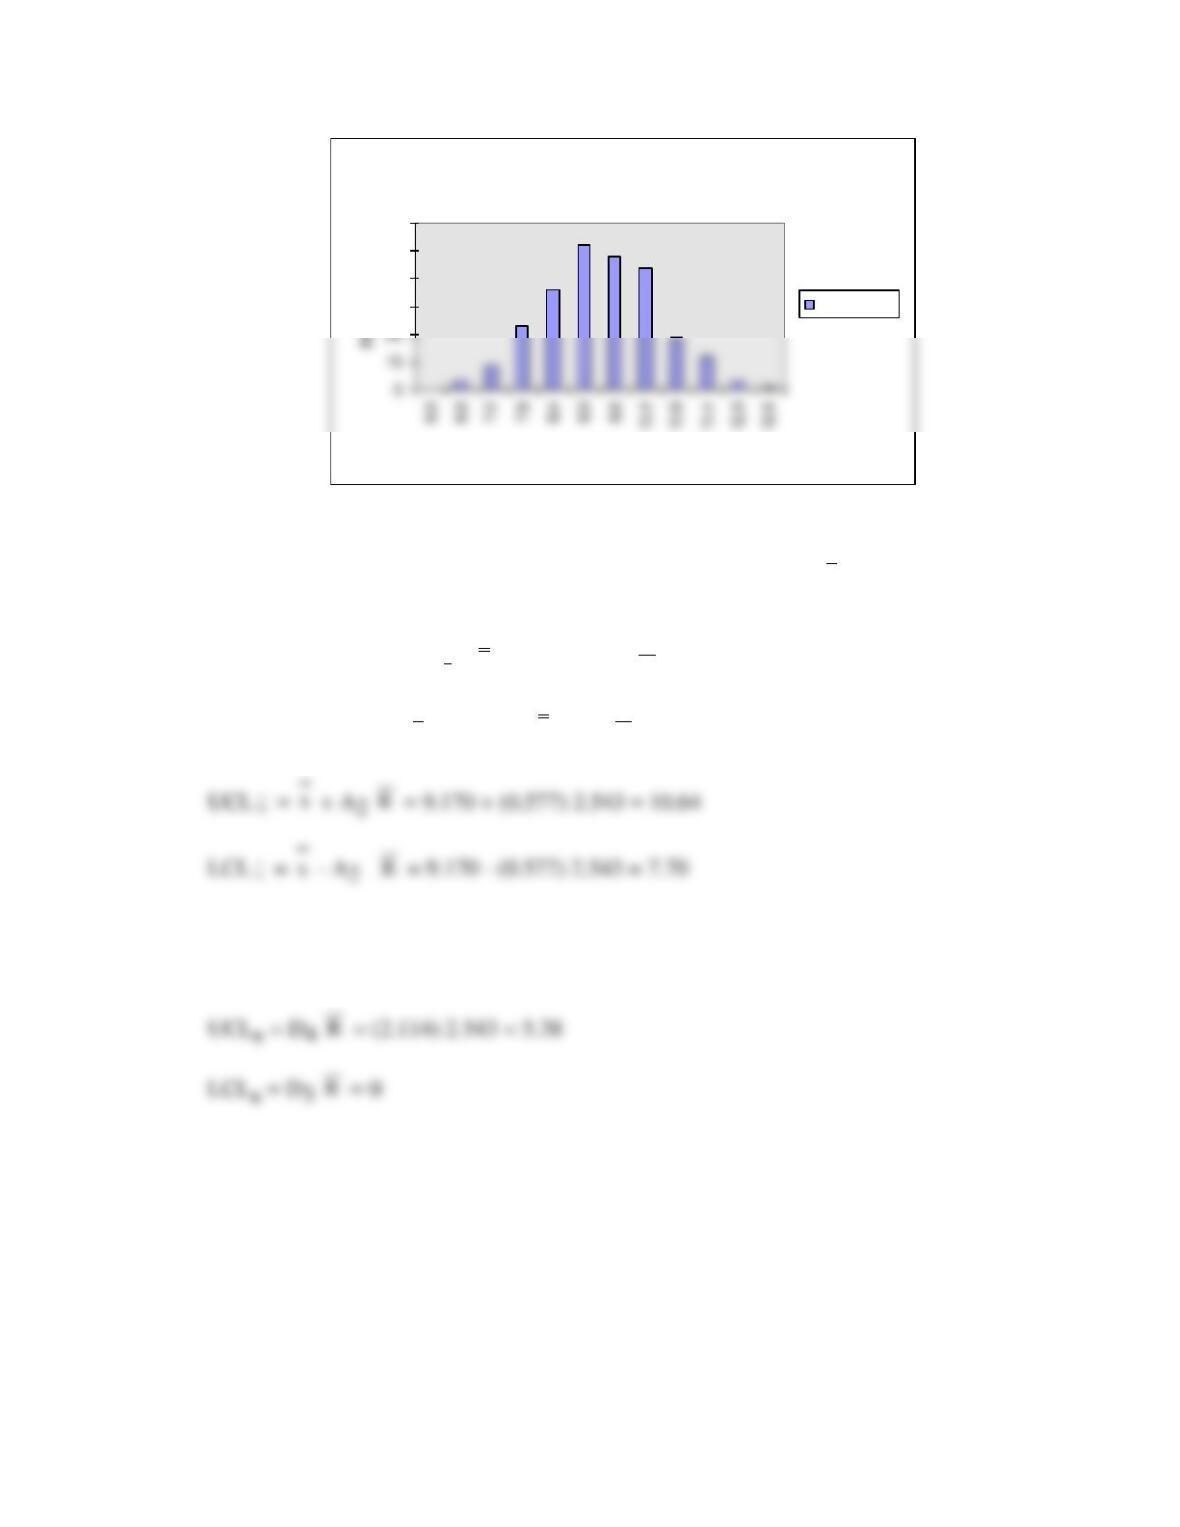
a) Descriptive statistics for Babbage Chips, Inc., based on all 50 samples, are shown
below. The histogram shows the “classic” bell curve shape.
Descriptive Statistics – Prob. 8-09
Bin
Frequency
6.0
0
Mean
9.046
6.6
3
Standard Deviation
1.103
9.0
52
Sample Variance
1.218
9.6
48
Kurtosis
-0.323
10.2
44
Skewness
0.071
10.8
19
Range
5.716
11.4
12
Minimum
6.341
12.0
3
Maximum
12.057
12.6
1
Sum
2261.440
Count
250.000
Conf. Level(95.0%)
0.137
Standard Error
0.070
7.2
9
Median
9.011
7.8
23
Mode
9.215
8.4
36
Histogram
30
40
50
60
Bin
Frequency
b) Results from first 30 samples of 5 for Babbage show that both the
x
and R charts are
apparently in control. (See spreadsheet Prob08-09InsRsvAXR.xls for details).
For the Center Lines, CL
x
:
x
= 9.170; CLR:
R
= 2.543
Control limits for the
x
– chart are:
x
± A2
R
x
x
R
x
x
R
For the R-chart:
R
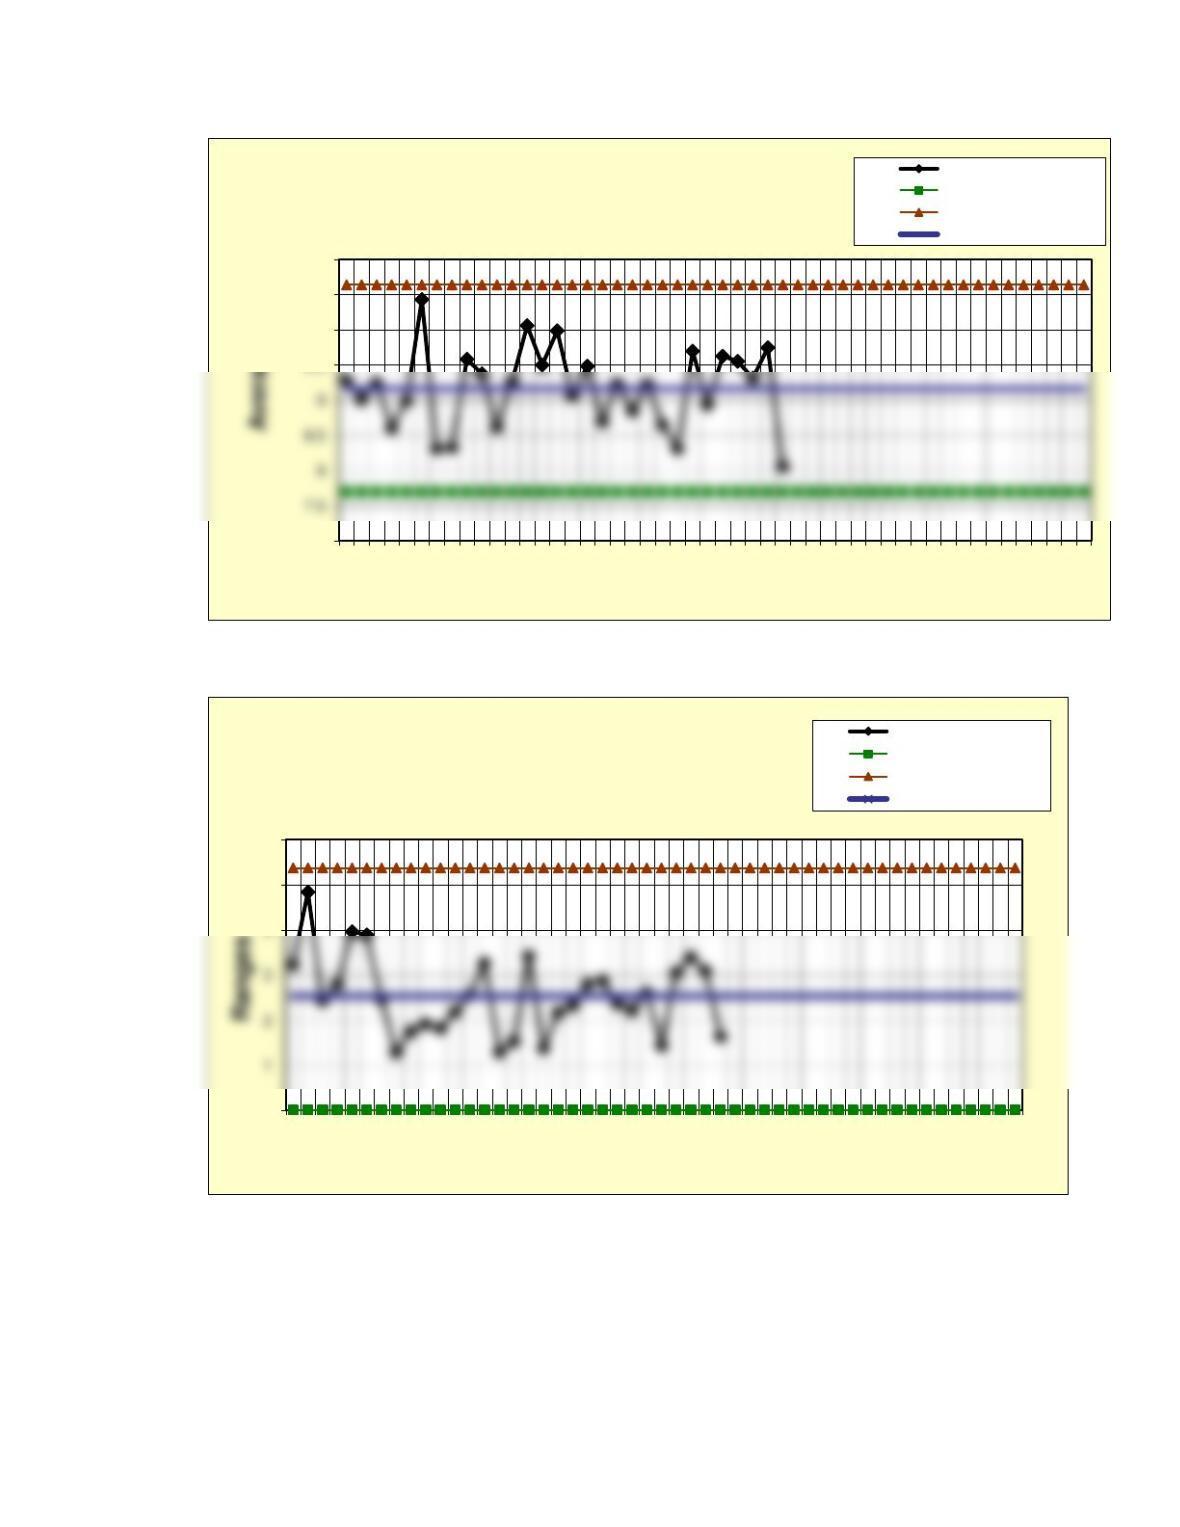
c) The computations for the process capability, taken from the spreadsheet template,
show that the process is not quite capable (see spreadsheet Prob08-
09InsRsvAXR.xlsx for details).
7
9.5
10
10.5
11
1 3 5 7 9 11 13 15 17 19 21 23 25 27 29 31 33 35 37 39 41 43 45 47 49
Sample number
Prob. 8-09A X-bar Chart
Averages
Lower control limit
Upper control limit
Center line
0
5
6
1 3 5 7 9 11 13 15 17 19 21 23 25 27 29 31 33 35 37 39 41 43 45 47 49
Sample number
Prob. 8-09A R-Chart Ranges
Lower control limit
Upper control limit
Center line