Chapter 8
Hallenvale Hospital Case
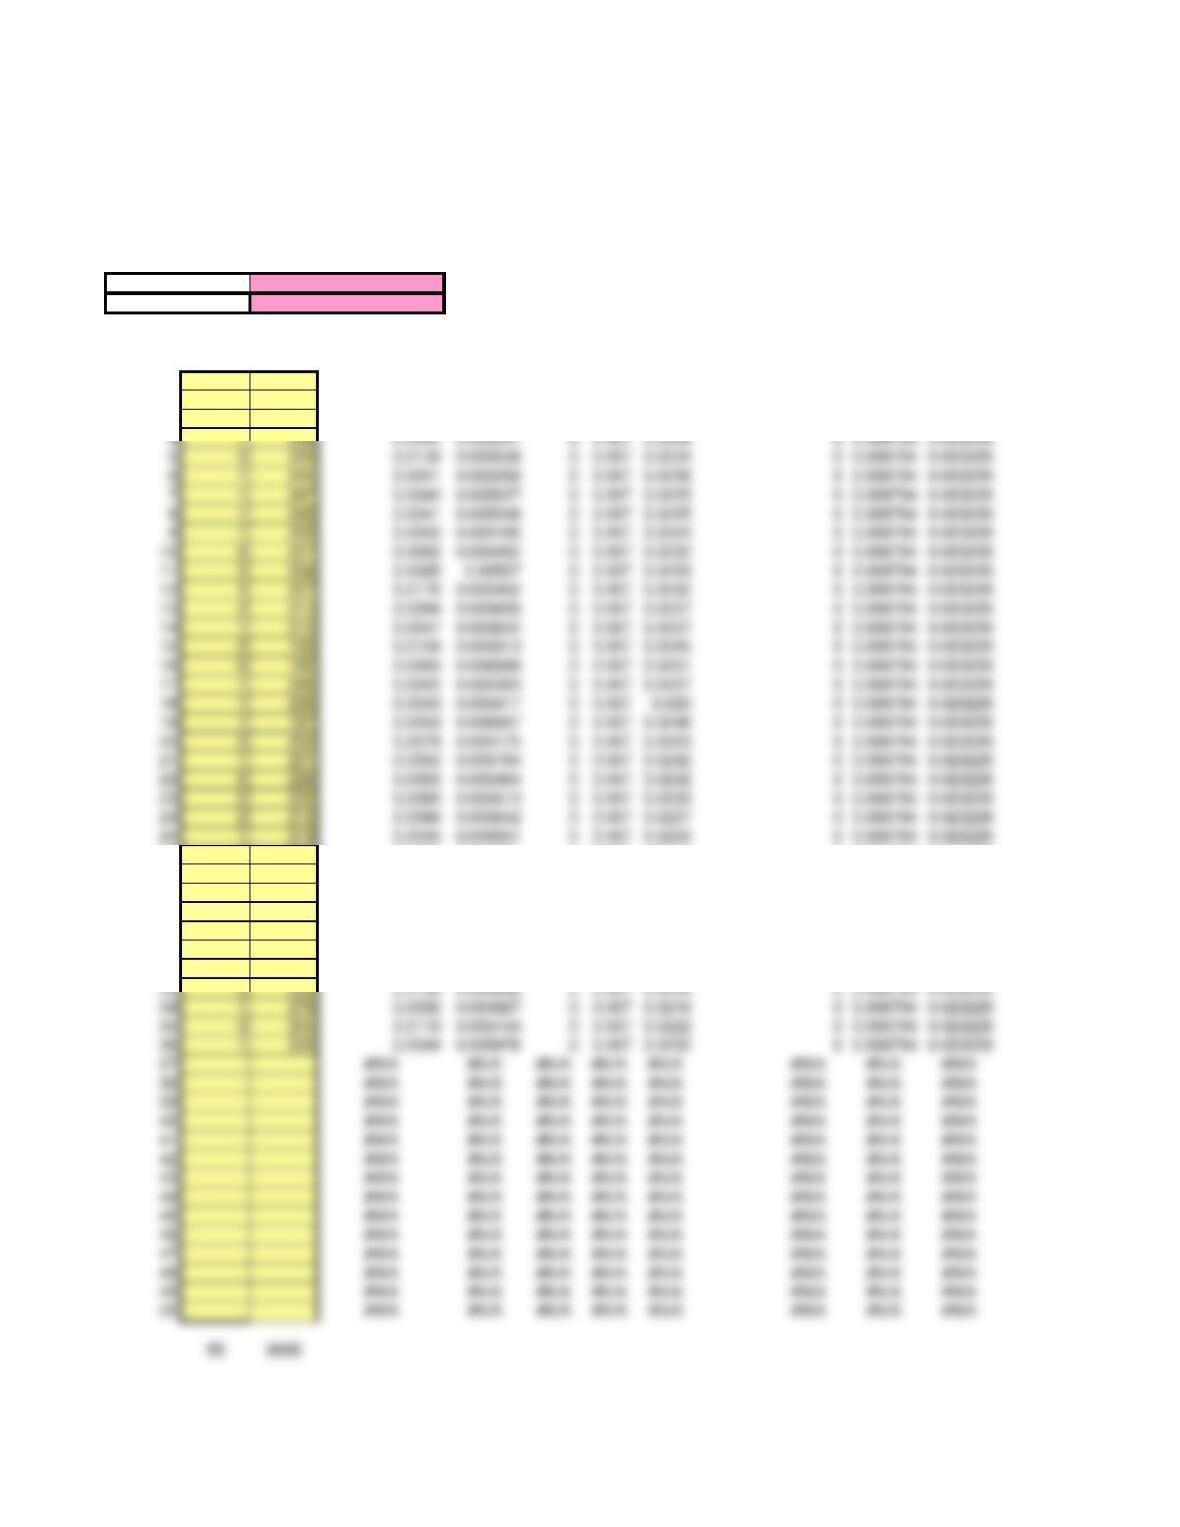
Fraction Nonconforming (p) Chart
This spreadsheet is designed for up to 50 samples. Enter data ONLY in yellow-shaded cells.
Click on the sheet tab to display the control chart (some rescaling may be needed).
Average (p-bar)
Avg. sample size
Approximate Control Limits Using
Sample Fraction Standard Average Sample Size Calculations
Sample Value Size Nonconforming Deviation LCLp CL UCLp LCLp CL UCLp
1 1 208 0.0048 0.005696 0 0.007 0.0239 0 0.006794 0.023229
2 3 225 0.0133 0.005476 0 0.007 0.0232 0 0.006794 0.023229
3 3 201 0.0149 0.005794 0 0.007 0.0242 0 0.006794 0.023229
26 2223 0.0090 0.005501 0 0.007 0.0233 0 0.006794 0.023229
27 1191 0.0052 0.005944 0 0.007 0.0246 0 0.006794 0.023229
28 0222 0.0000 0.005513 0 0.007 0.0233 0 0.006794 0.023229
29 3231 0.0130 0.005405 0 0.007 0.023 0 0.006794 0.023229
30 1239 0.0042 0.005314 0 0.007 0.0227 0 0.006794 0.023229
31 2217 0.0092 0.005577 0 0.007 0.0235 0 0.006794 0.023229
32 1241 0.0041 0.005292 0 0.007 0.0227 0 0.006794 0.023229
0.0068
224.8611
0.0300
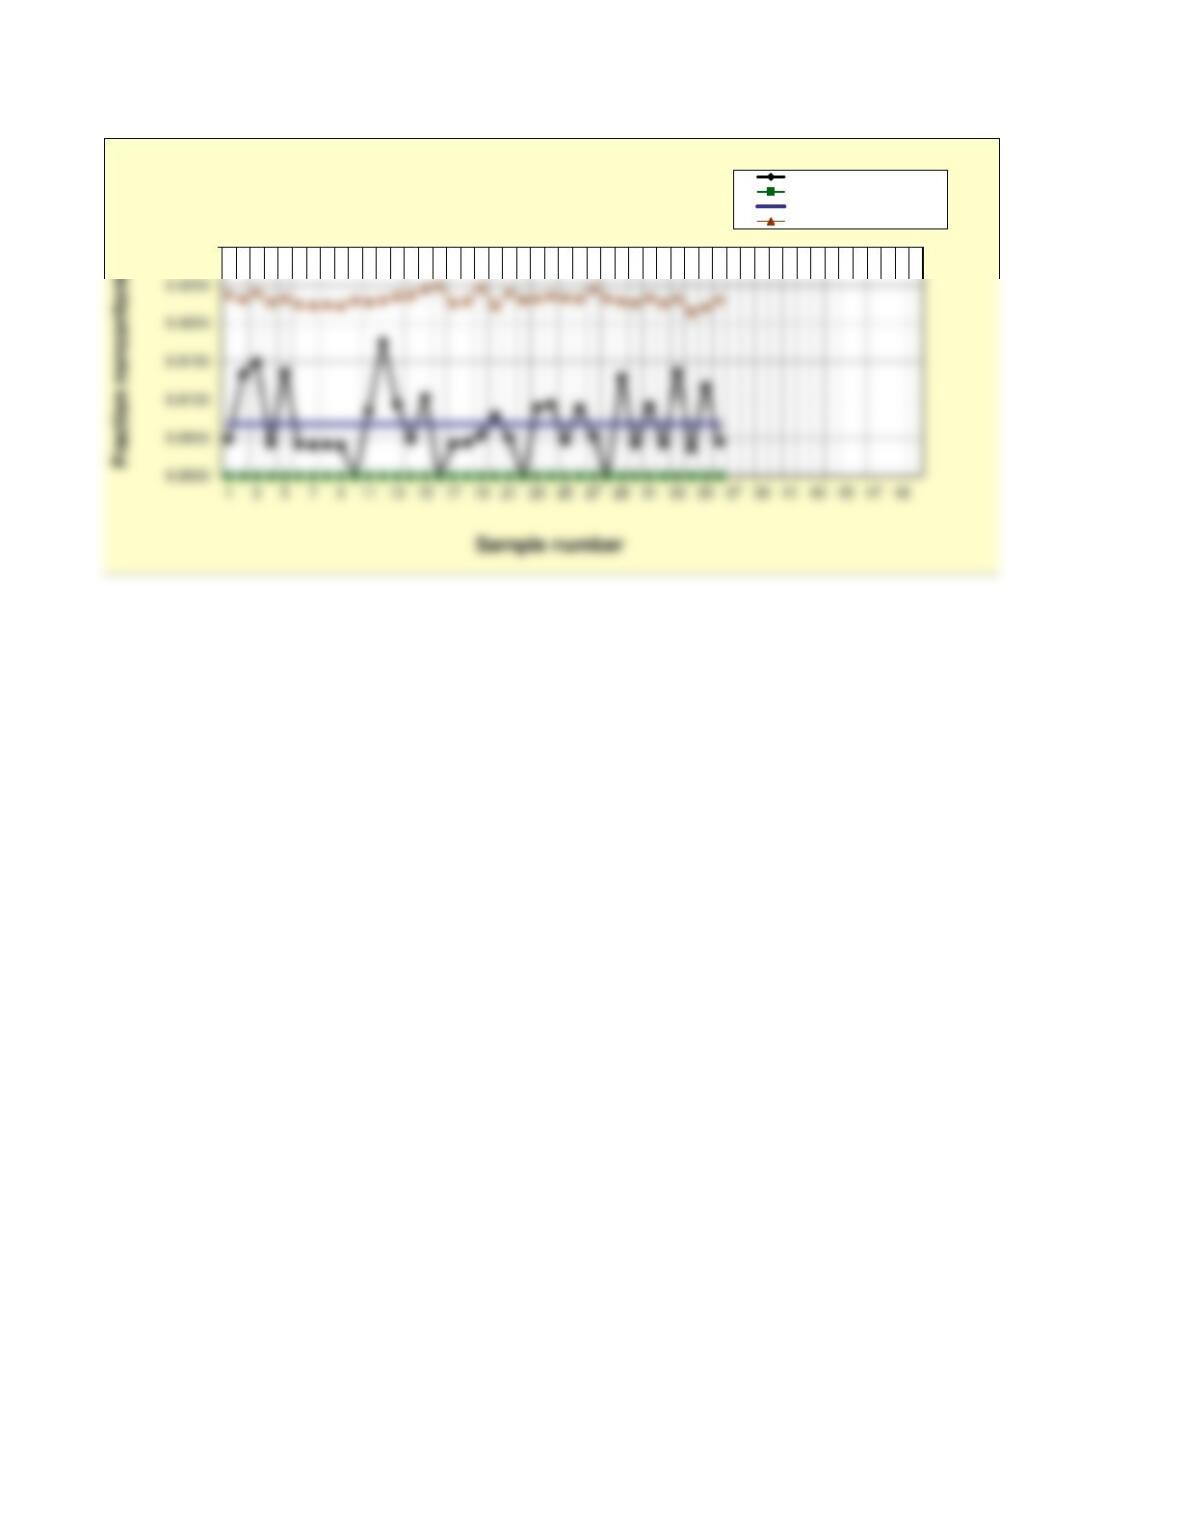
Hallenvale Hospital
Attribute (p) Chart
Fraction nonconforming
Lower control limit
Center line
Upper control limit
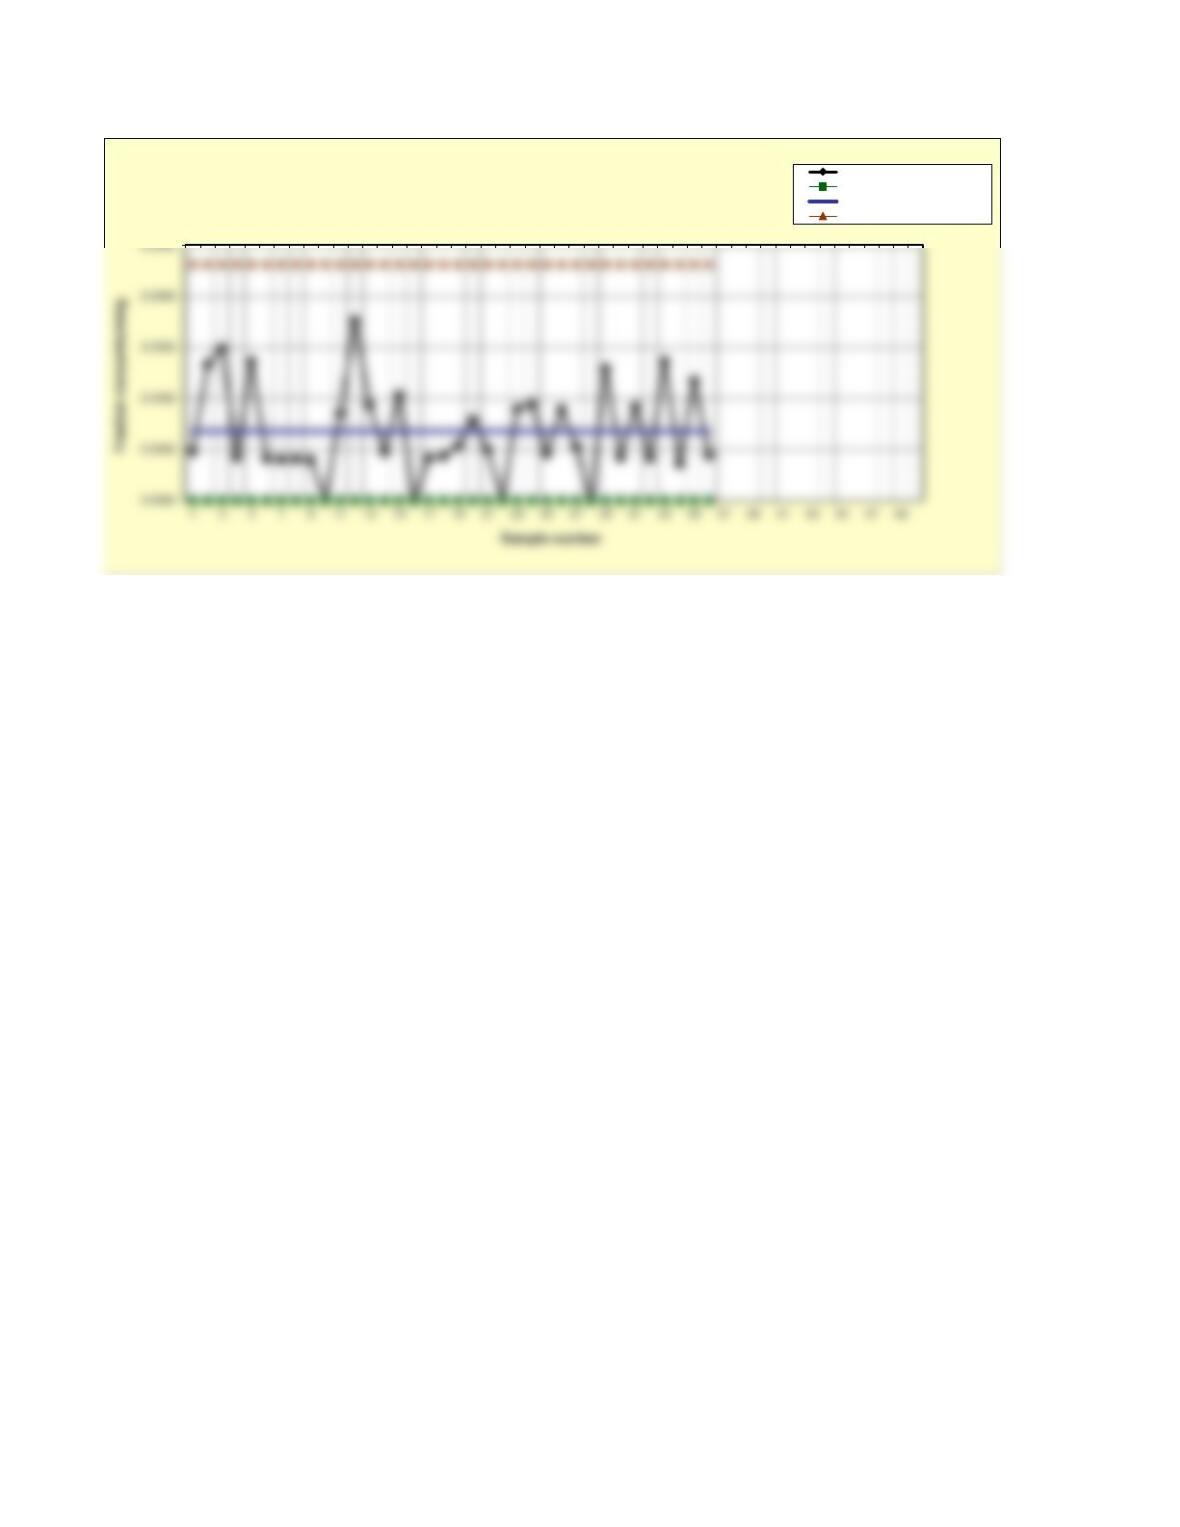
Hallenvale Hospital
Attribute (p) Chart (approx. limits)
Fraction nonconforming
Lower control limit
Center line
Upper control limit