College Mathematics: Learning Worksheets Chapter 8
215
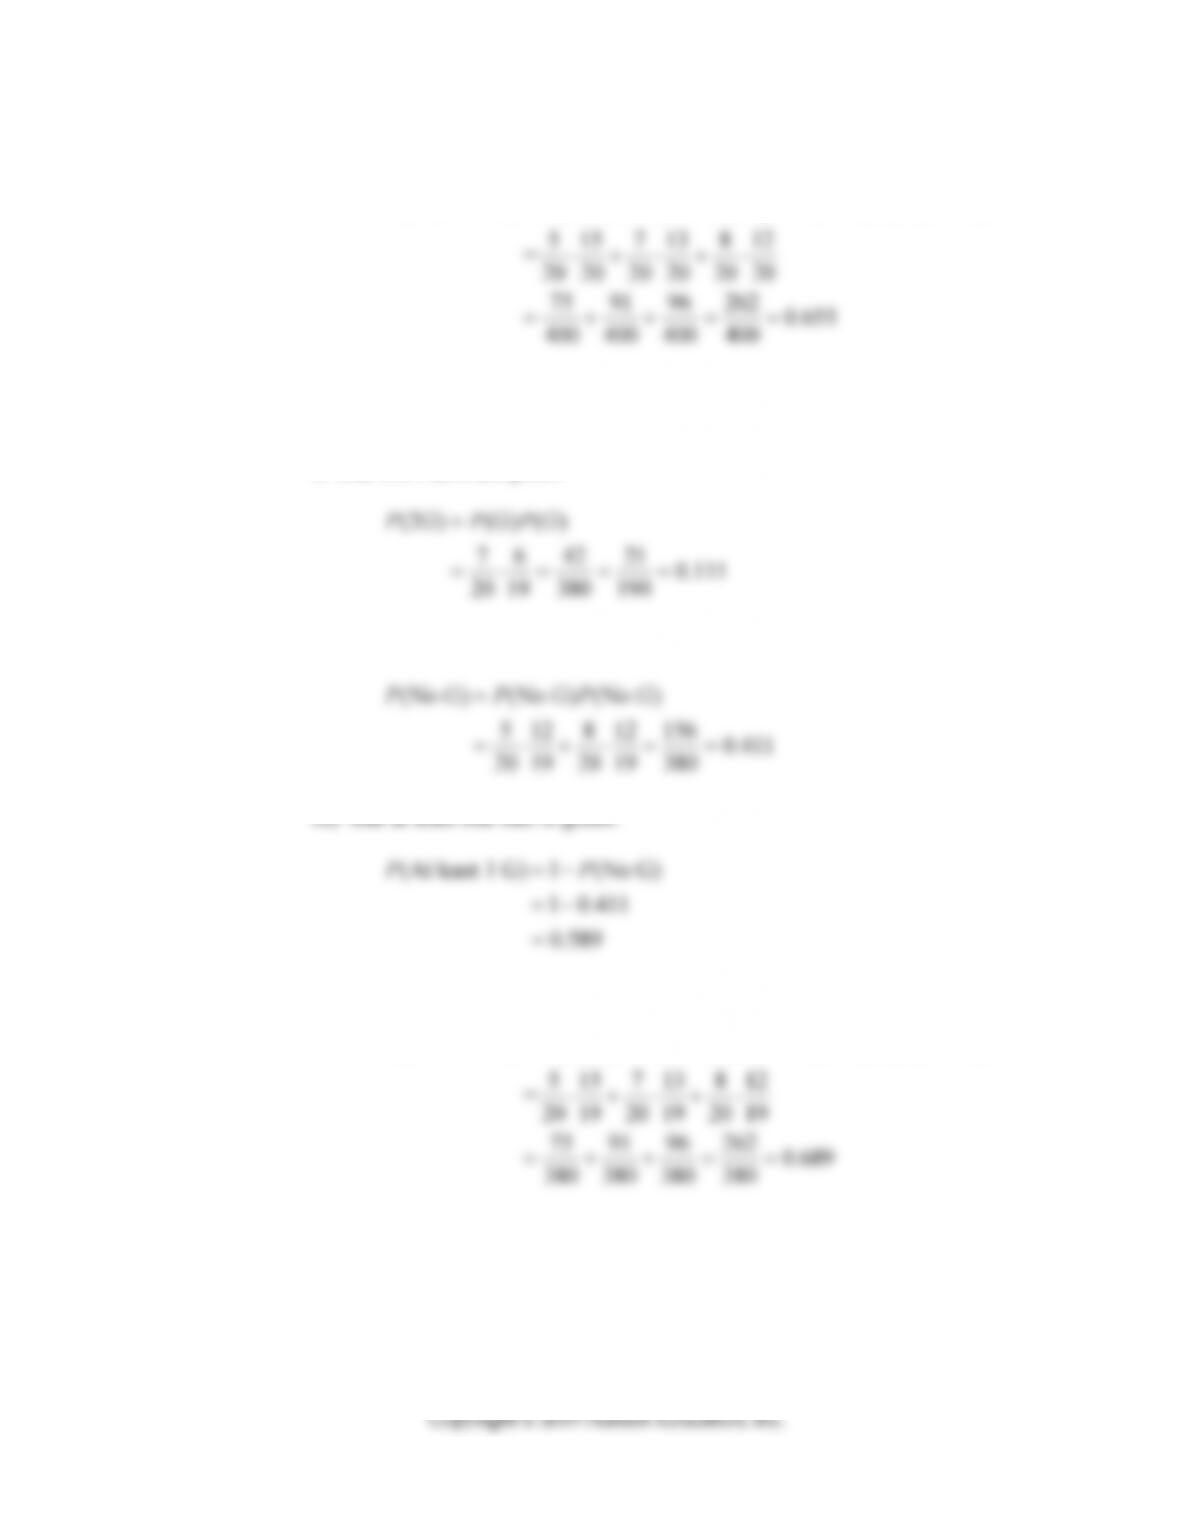
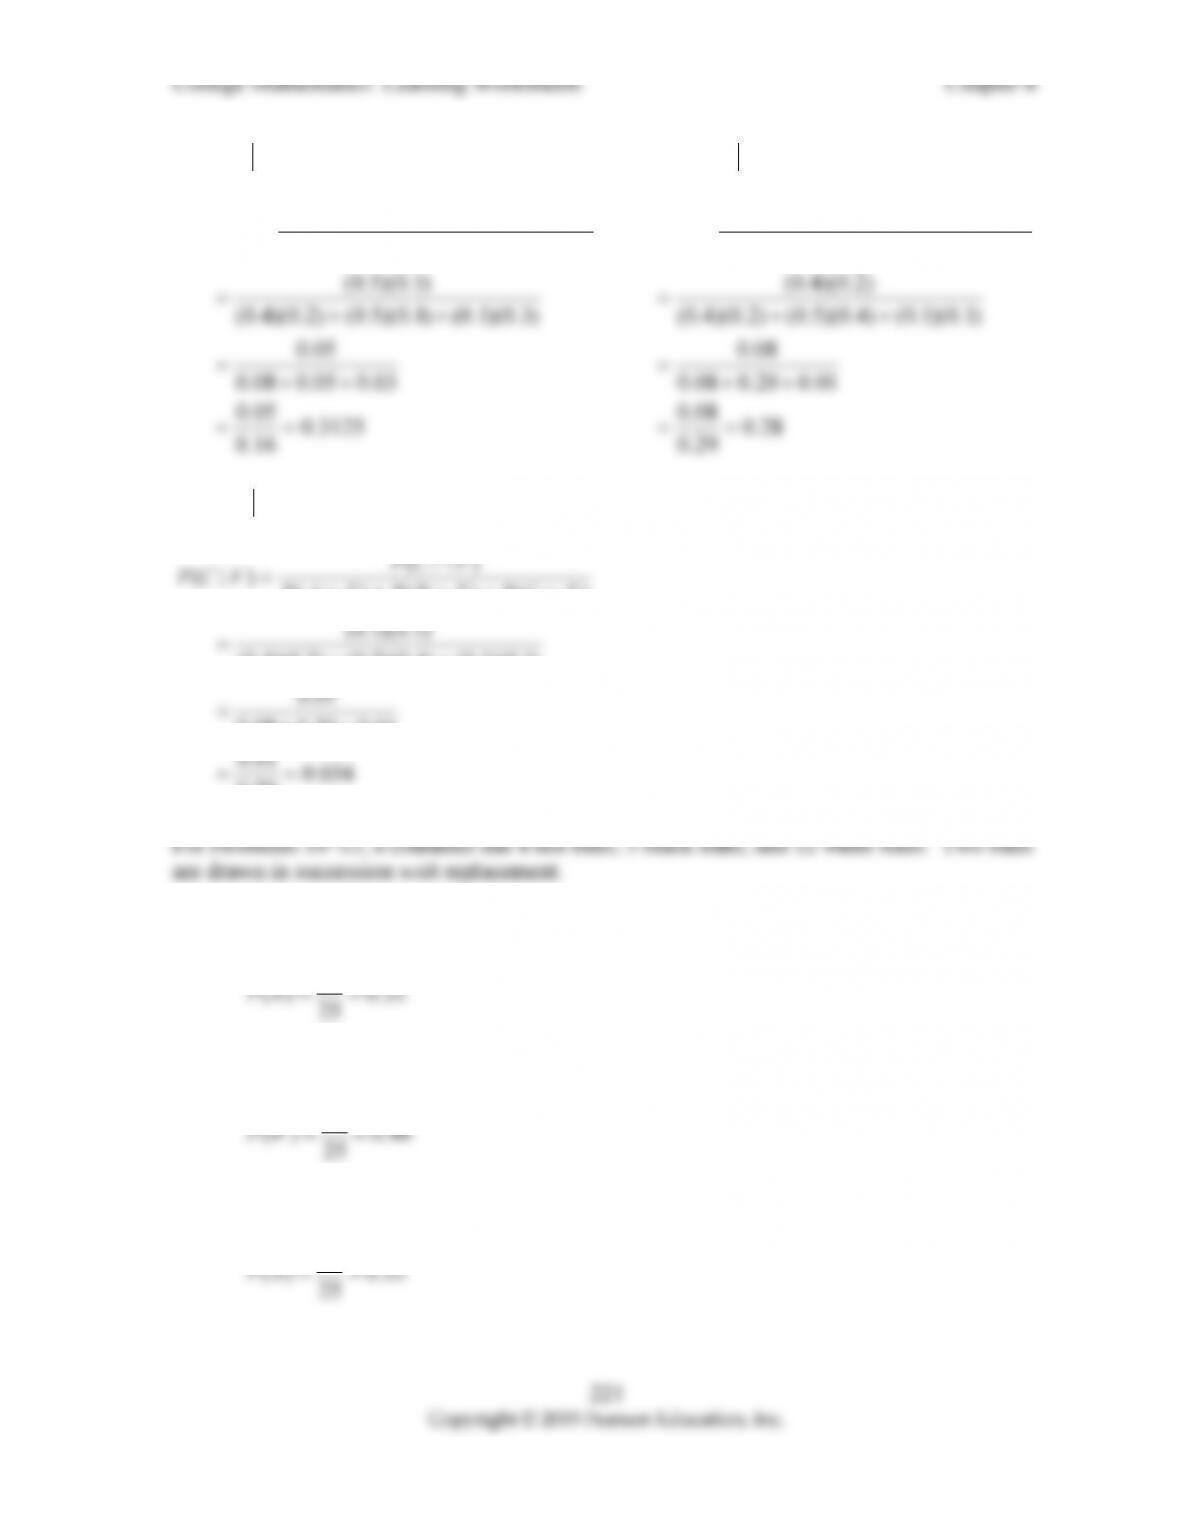
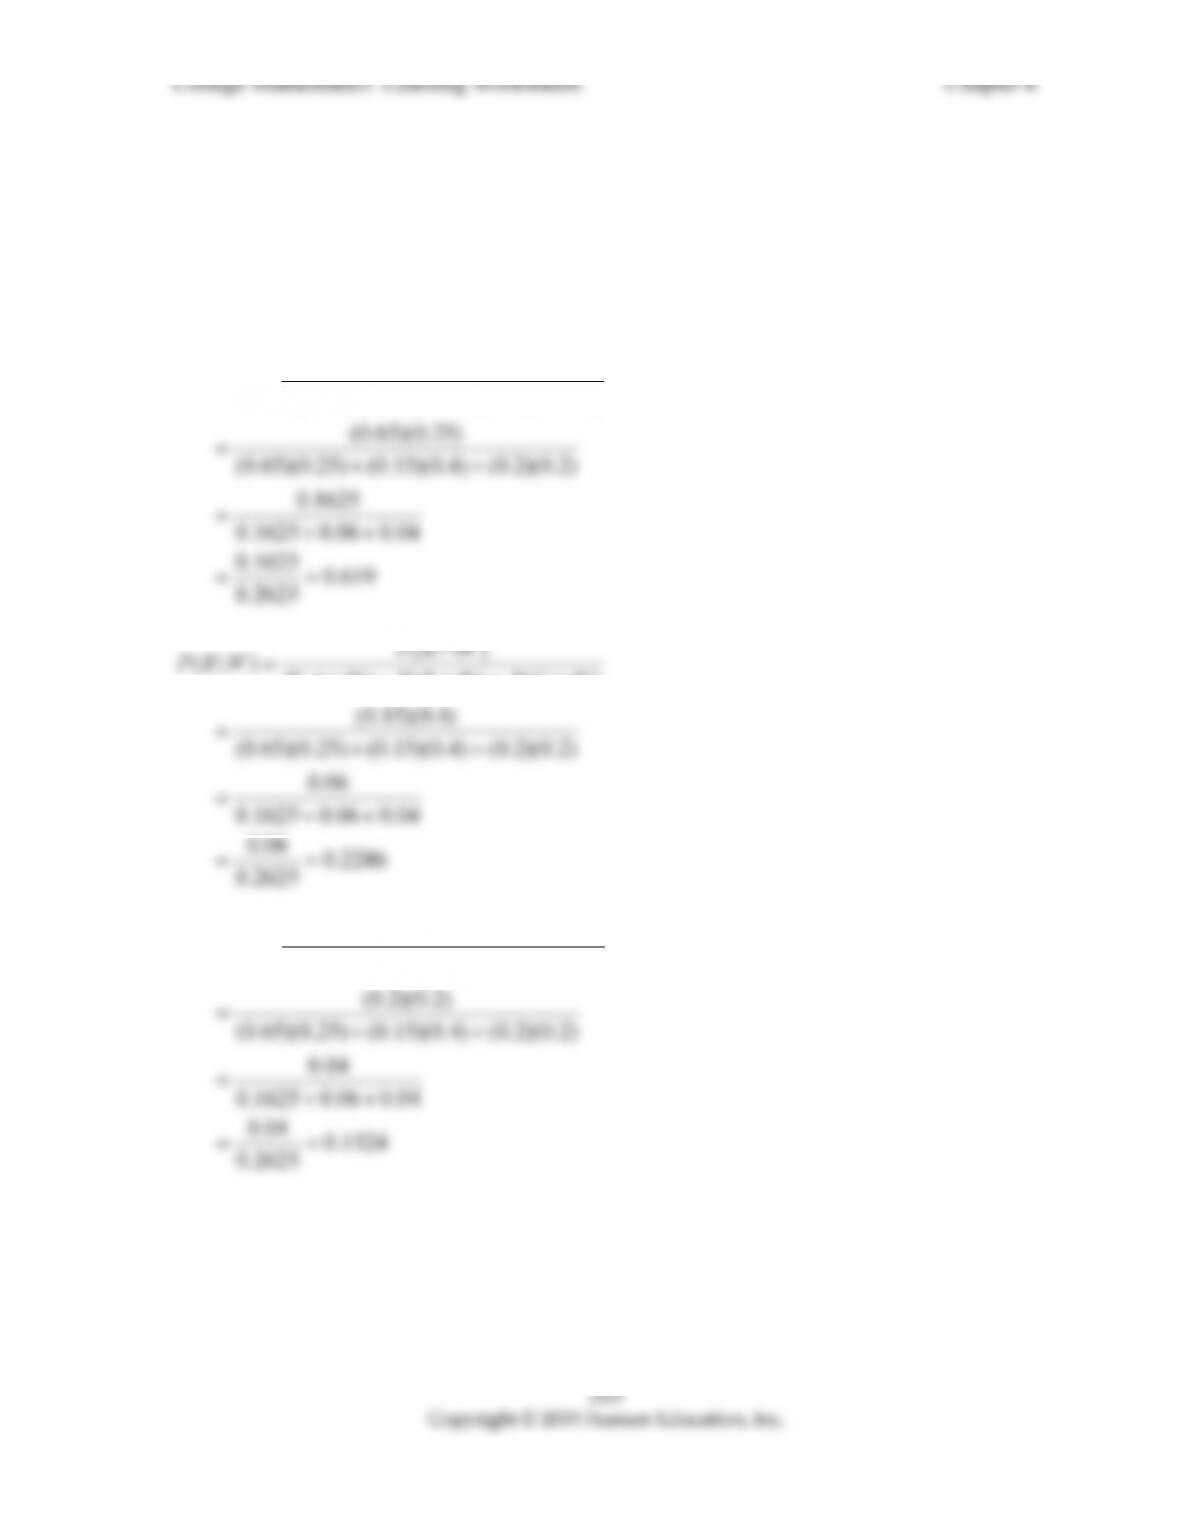
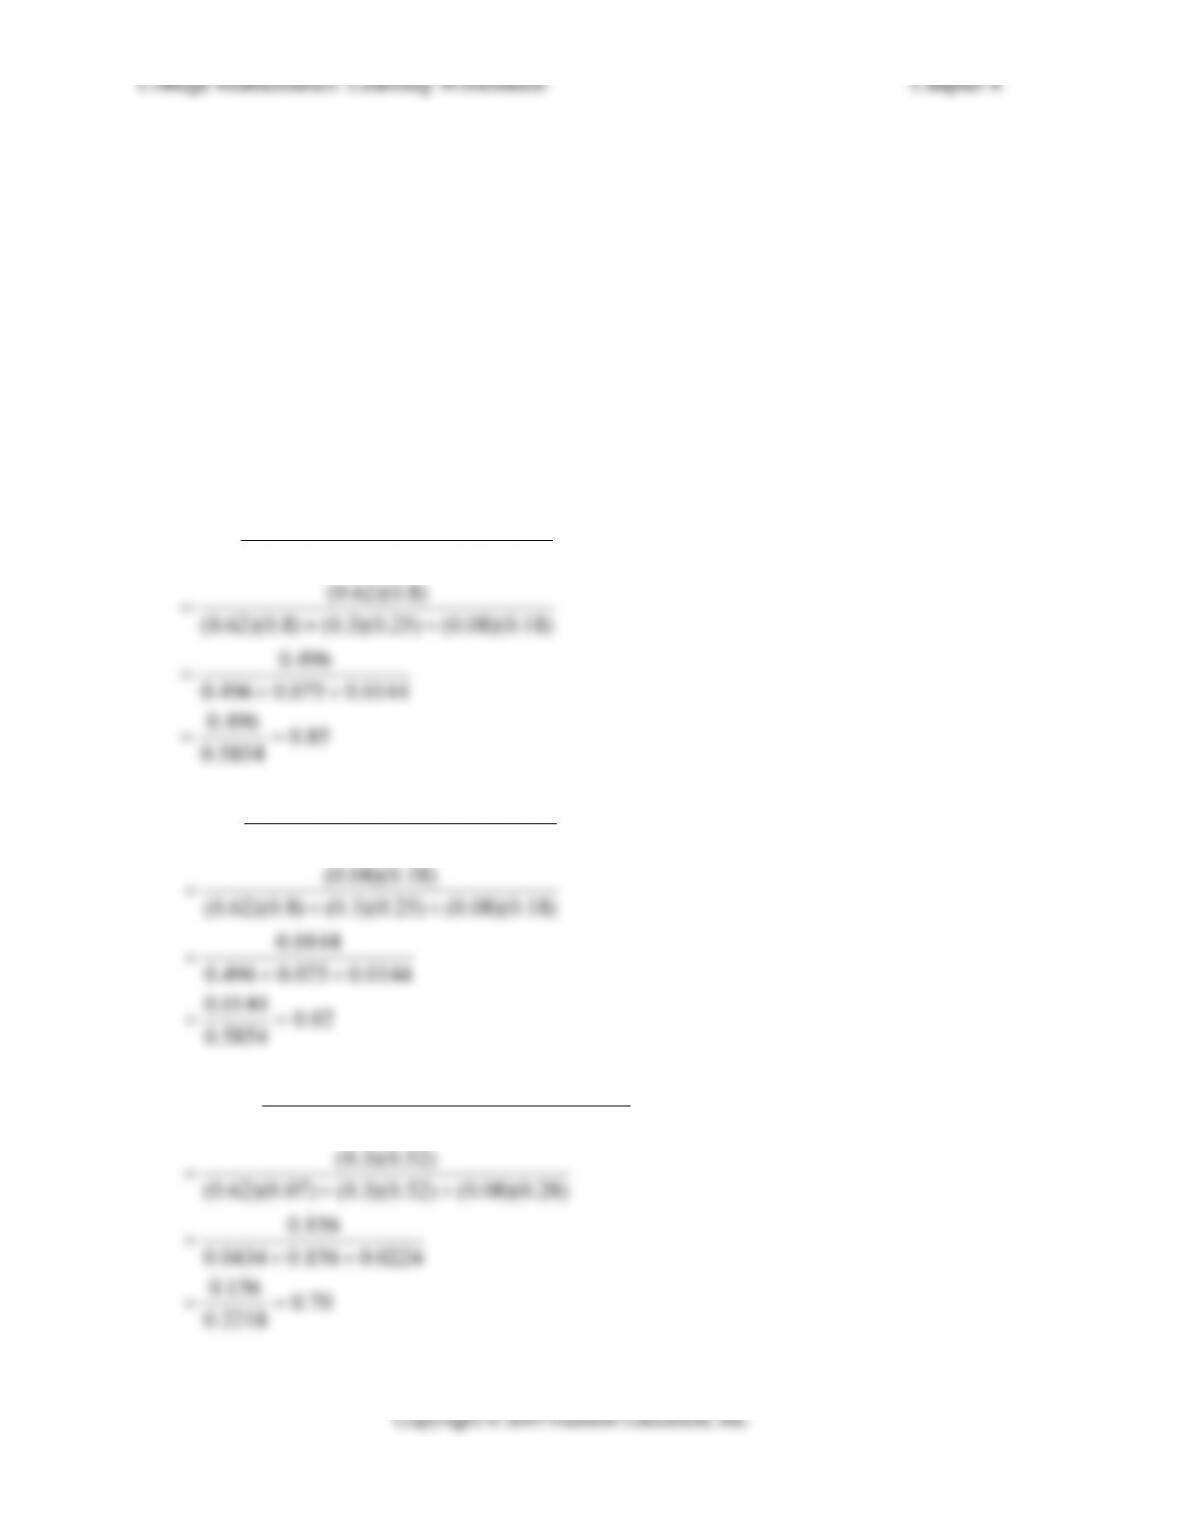
iv) that the two balls are not the same color.
(Diff. Color) ( ) (No R) ( ) (No G) ( ) (No W)
PPRPPGPPWP
b) If the first ball drawn is not replaced before the second ball is drawn, find the
following probabilities:
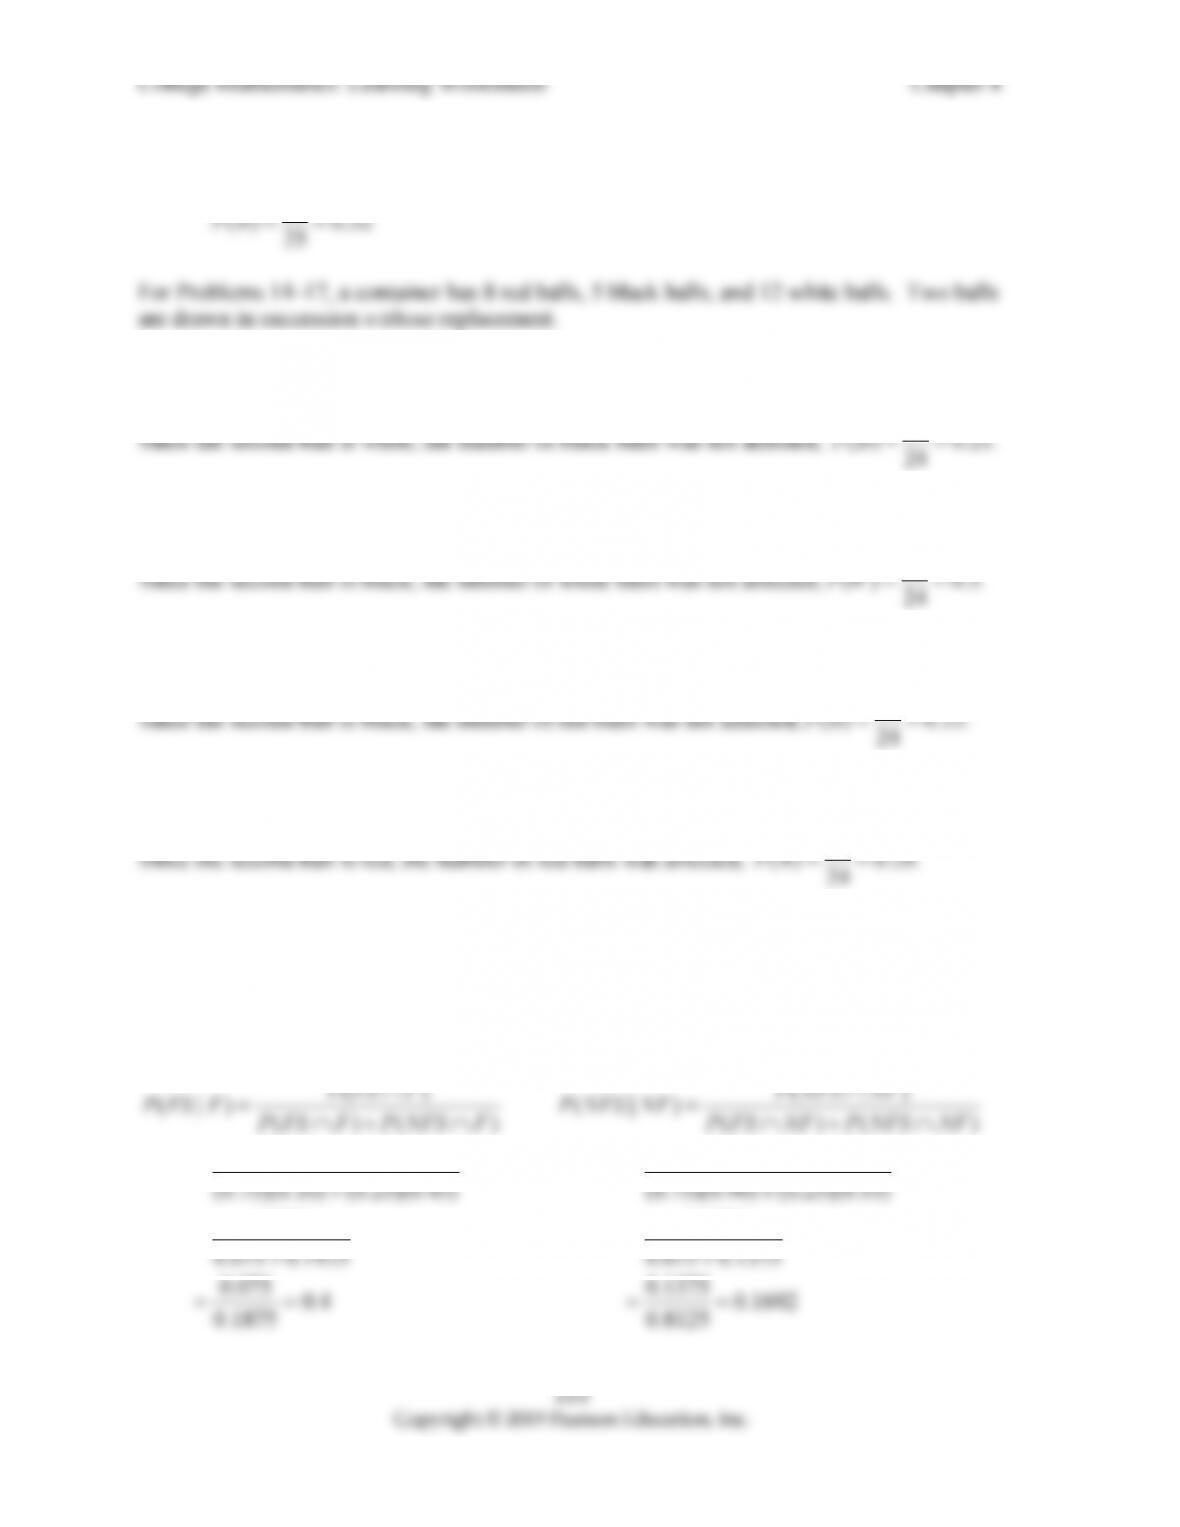
i) that both balls are green.
7 6 42 21 0.111
20 19 380 190
ii) that neither ball is green.
5 12 8 12 156 0.411
20 19 20 19 380
iii) that at least one ball is green.
1 0.411
0.589
iv) that the two balls are not the same color.
(Diff. Color) ( ) (No R) ( ) (No G) ( ) (No W)
PPRPPGPPWP
217
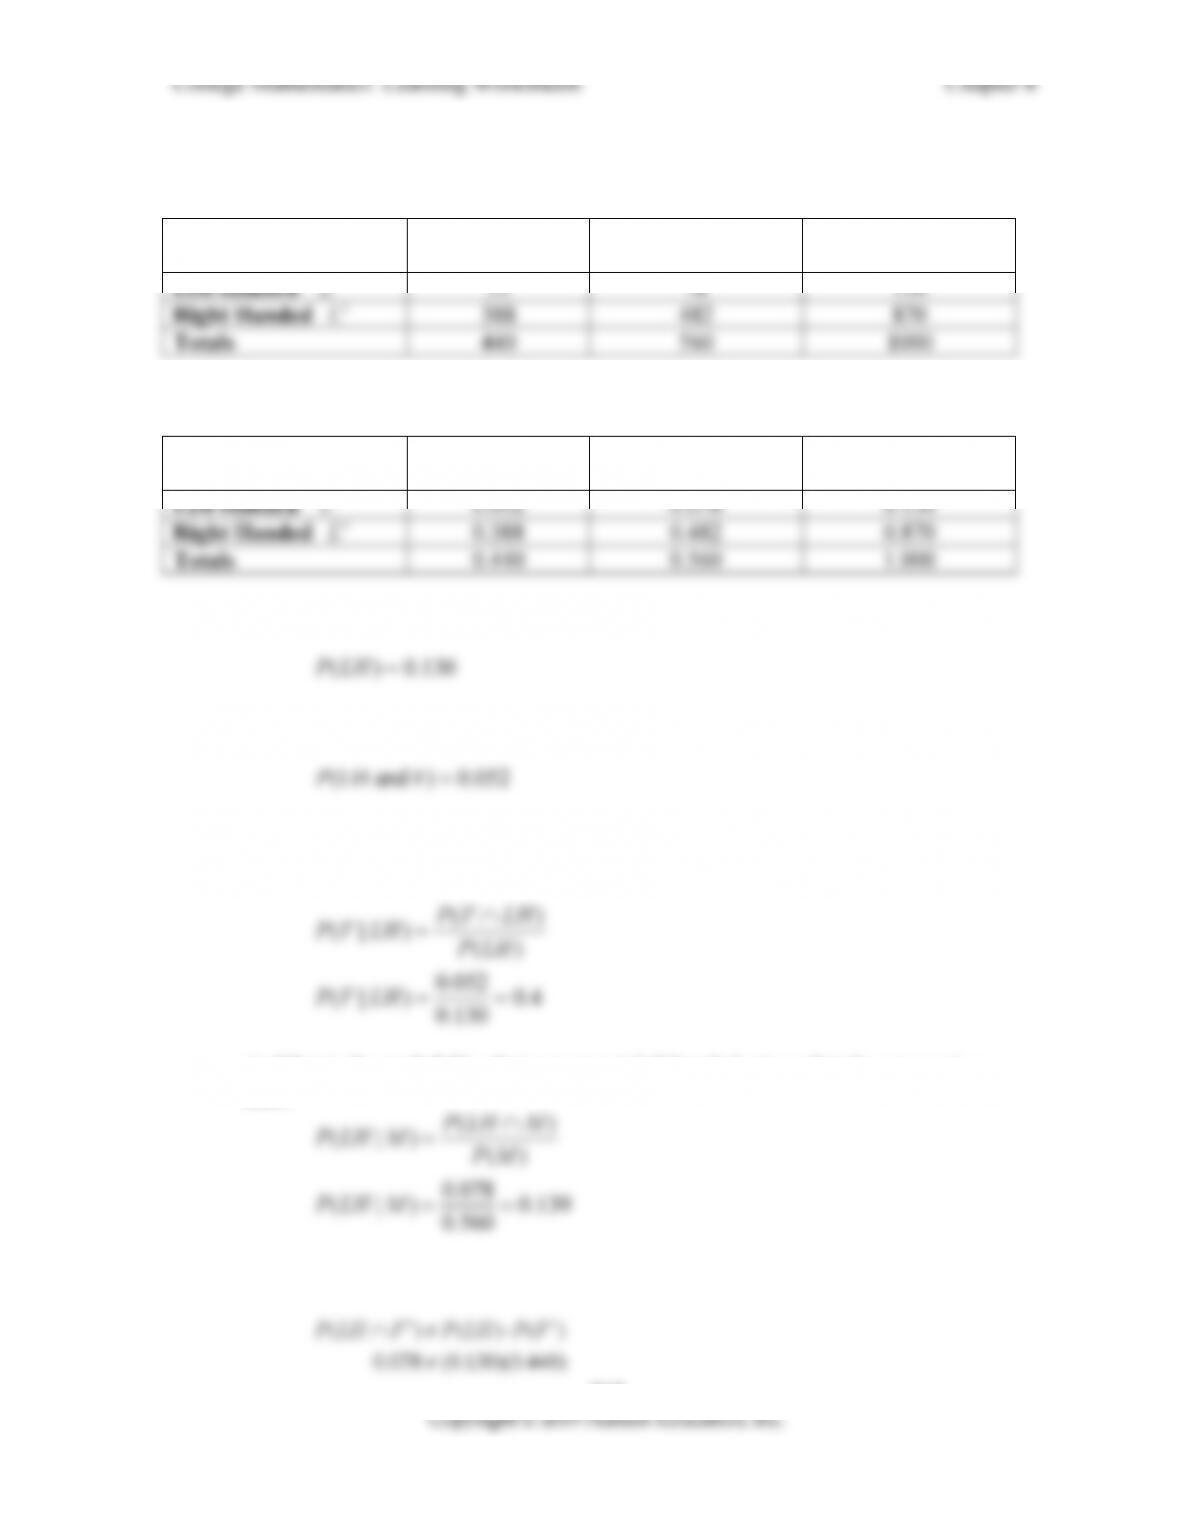
14. In a study to determine the frequency and dependency of left handedness relative to
females and males, 1,000 people were chosen at random and the following results recorded:
Female
F
Male
F
Totals
a) Convert this table to a probability table by dividing each entry by 1000.
Female
F
Male
F
Totals
b) What is the probability that a person chosen at random is left handed?
c) What is the probability that a person chosen at random is a left handed woman?
d) What is the probability that a person is a woman given that the person is left
handed?
PF LH
e) What is the probability that a person is left handed, given that the person is a
male?
0.078
( | ) 0.139
0.560
PLH M
PLH M
f) Are the events left handedness and male independent? Why or why not?
0.078 (0.130)(0.440)

College Mathematics: Learning Worksheets Chapter 8
218
College Mathematics: Learning Worksheets Chapter 8
Name ________________________________ Date ______________ Class ____________
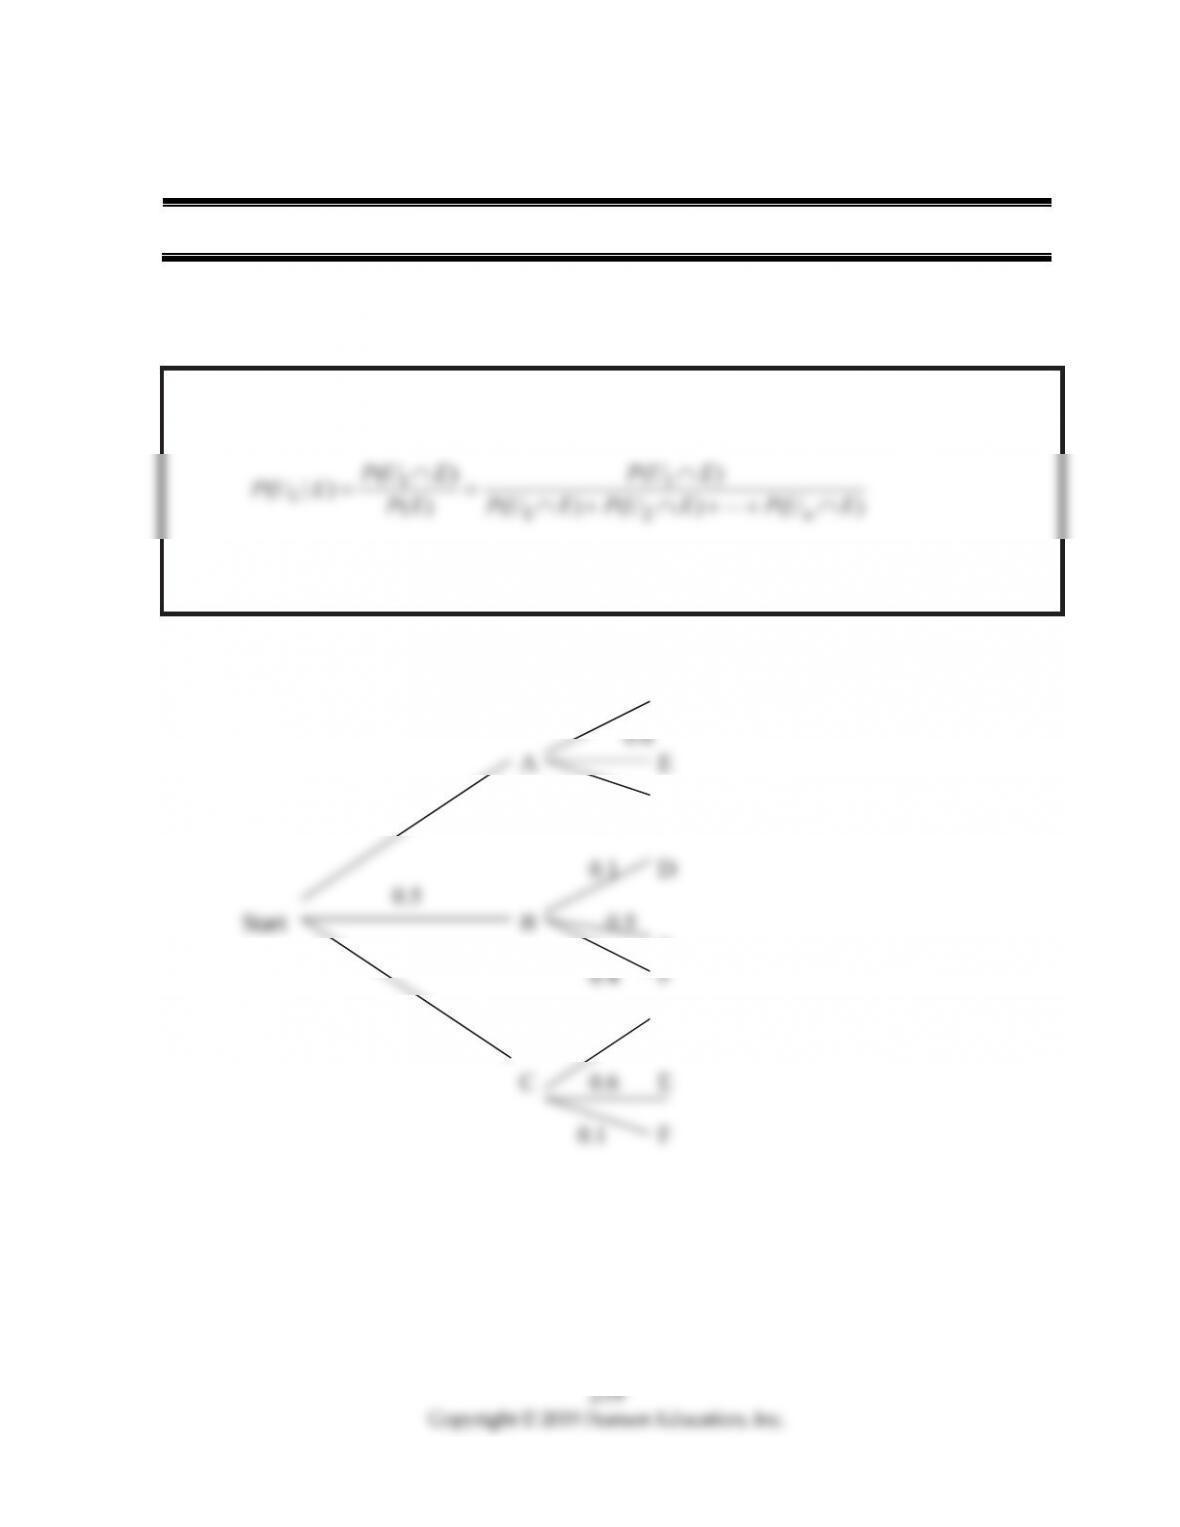
Goal: To find probabilities using Bayes’ Theorem
Find the probabilities in Problems 1–9, by referring to the following tree diagram and using
Bayes’ formula.
0.2 D
0.4 0.2 F
E
0.1 0.3 D
Section 8-4 Bayes’ Formula
Bayes’ Formula:
12
() ()
n
PU E PU E
Similar results will hold for 23
,,,
n
UU U
224
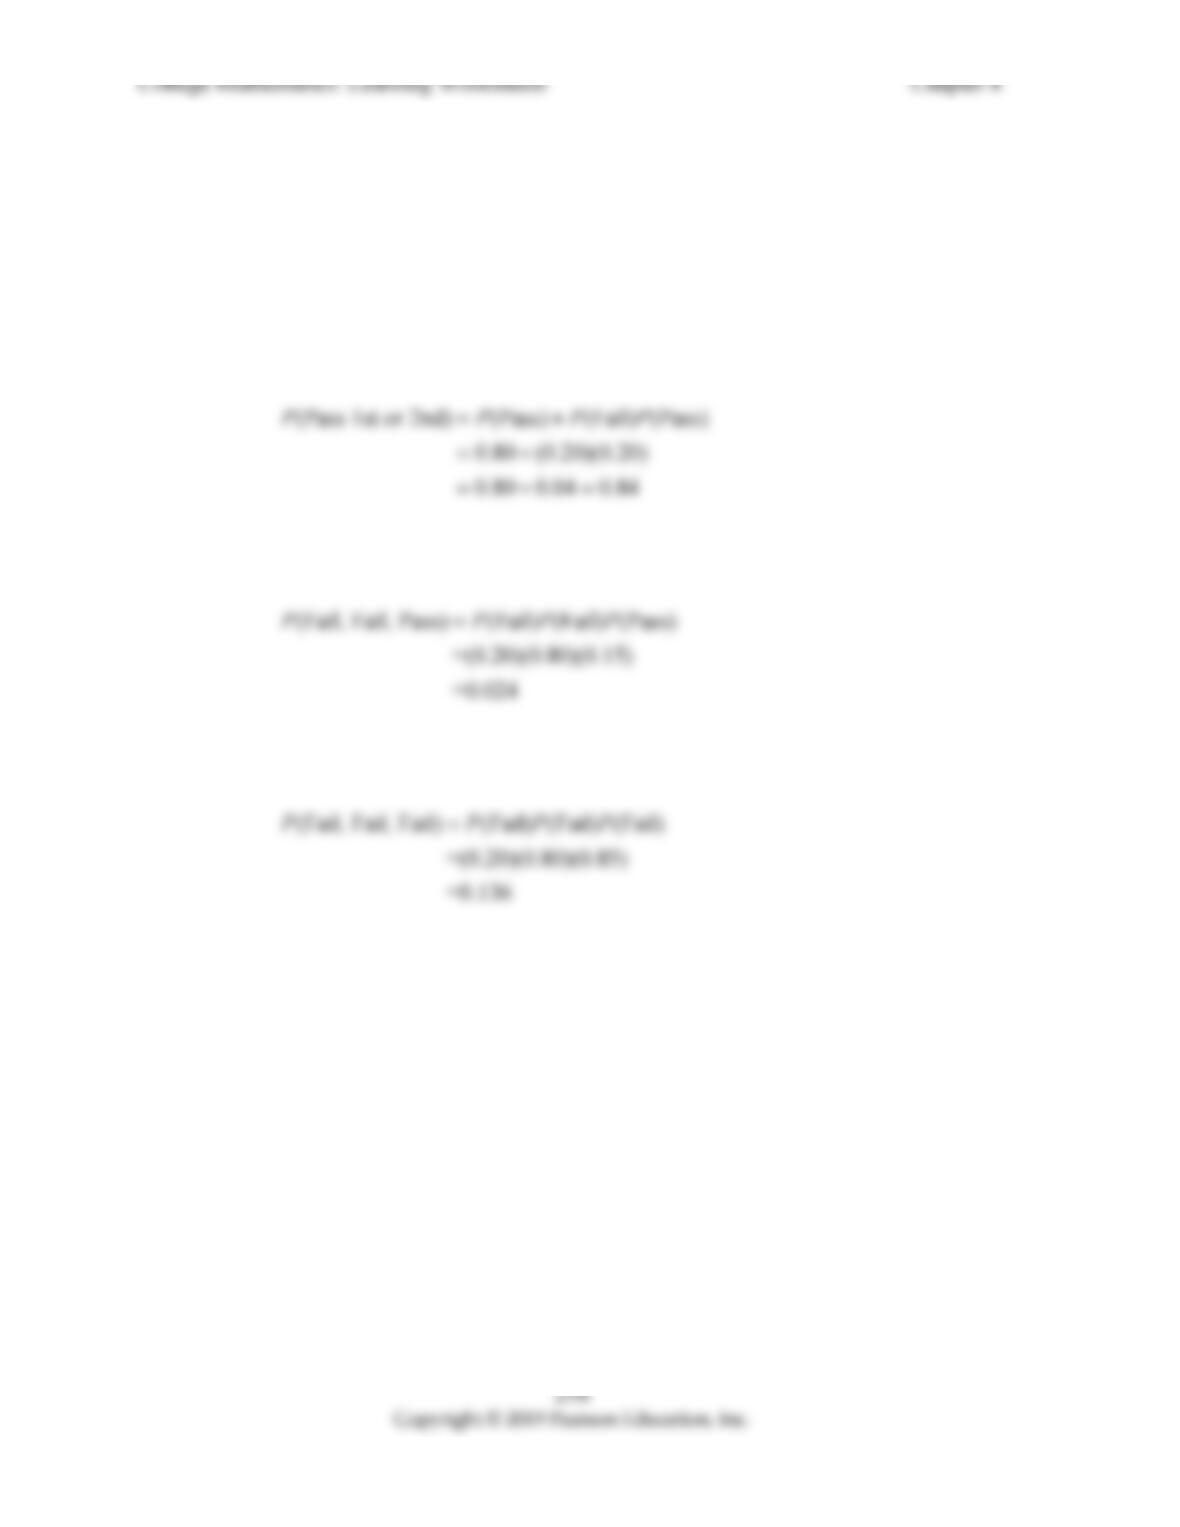
20. A survey of registered voters asked the question “Do you support legislation to ban
smoking in all public facilities?” 62% agreed, 30% did not agree, and 8% had no opinion.
Then each person was asked “Will you vote for Joe Vader (a candidate who supports the ban)
in the upcoming election?” Of those who agreed with the smoking ban, 80% said that they
would vote for Joe Vader, 7% said they would not, and 13% said they did not know who they
would vote for. Of those who disagreed with the ban, 25% said they would vote for Joe
Vader, 52% said they would not vote for him, and 23% said they did not know who they
would vote for. Of those who had no opinion on the ban, 18% said they would vote for Joe,
28% said they would not vote for him, and 54% said they did not know who they would vote
for. If a person votes for Joe Vader, what is the probability that they support the smoking
ban? If a person votes for Joe Vader, what is the probability that they have no opinion on the
smoking ban? If a person does not vote for Joe, what is the probability that they do not
support the smoking ban?
()
(|) ()( )( )
PA V
PAV PA V PD V PN V
()
(|) ()( )( )
PN V
PN V PA V PD V PN V
()
(| ) ()()( )
PD NV
PD NV P A NV P D NV P N NV
College Mathematics: Learning Worksheets Chapter 8
Name ________________________________ Date ______________ Class ____________
Goal: To find probabilities and expectation given a probability distribution
In Problems 1–3, if the probability distribution for the random variable X is given in the
table, what is the expected value of X?
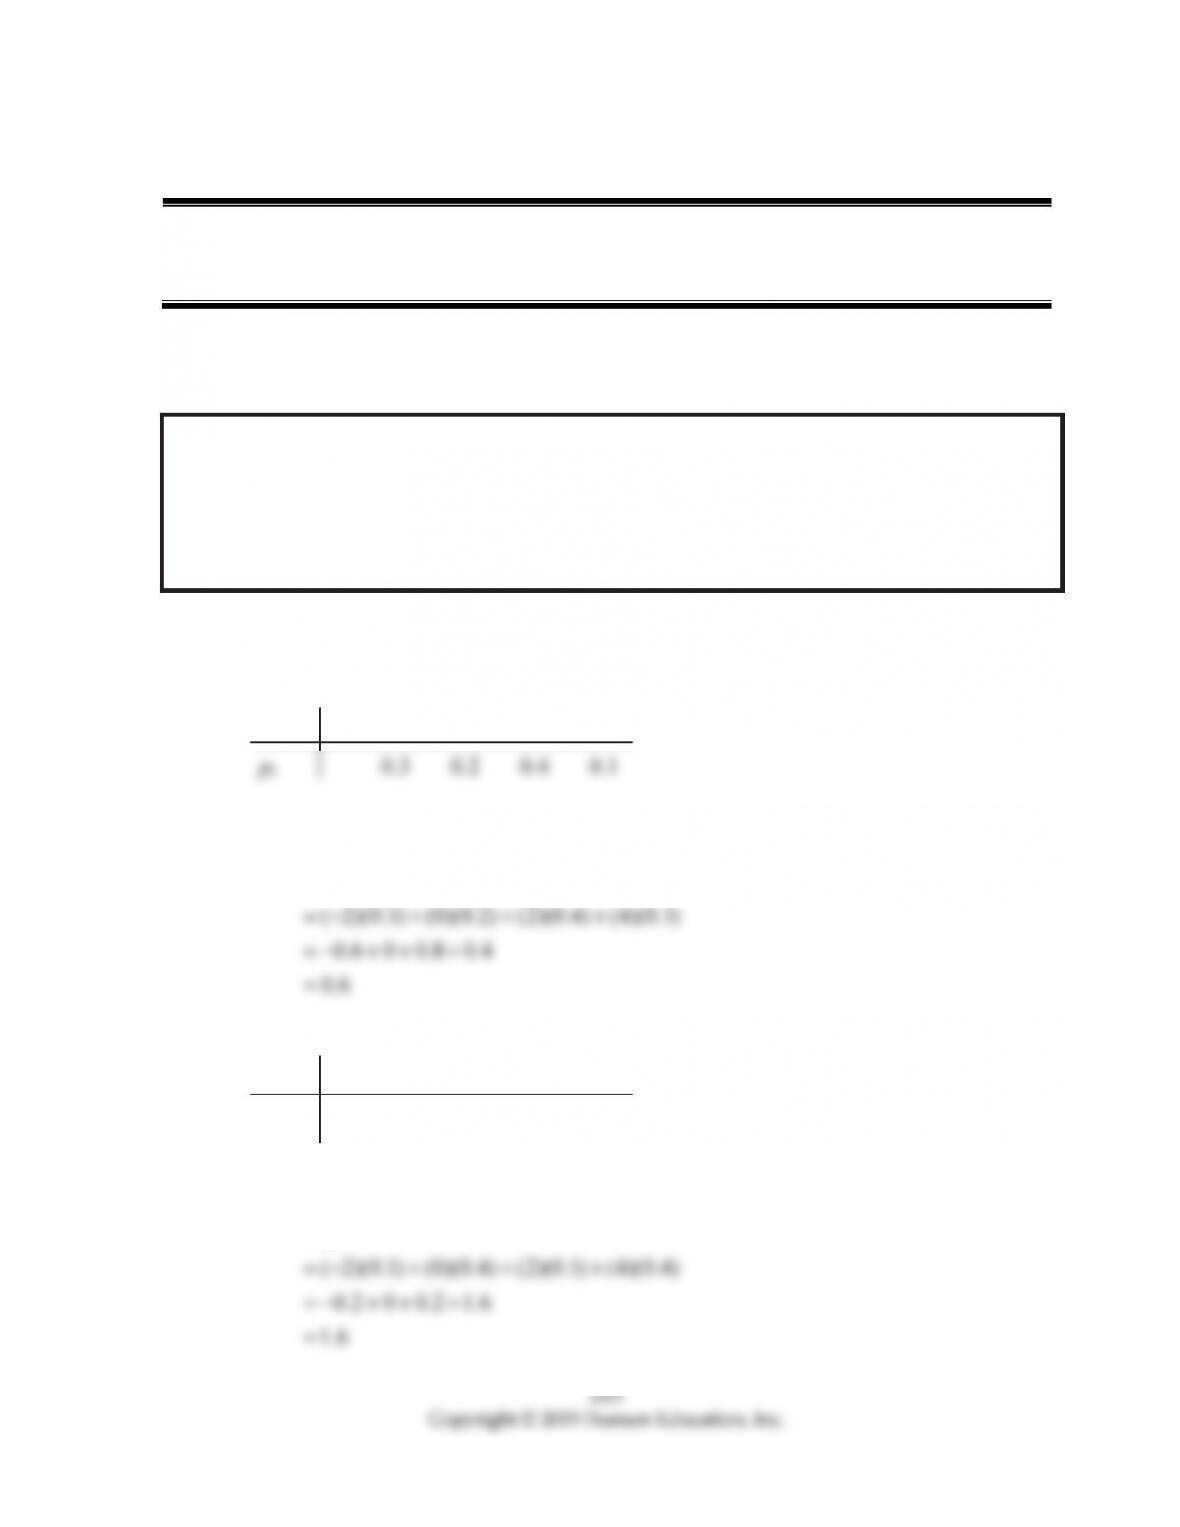
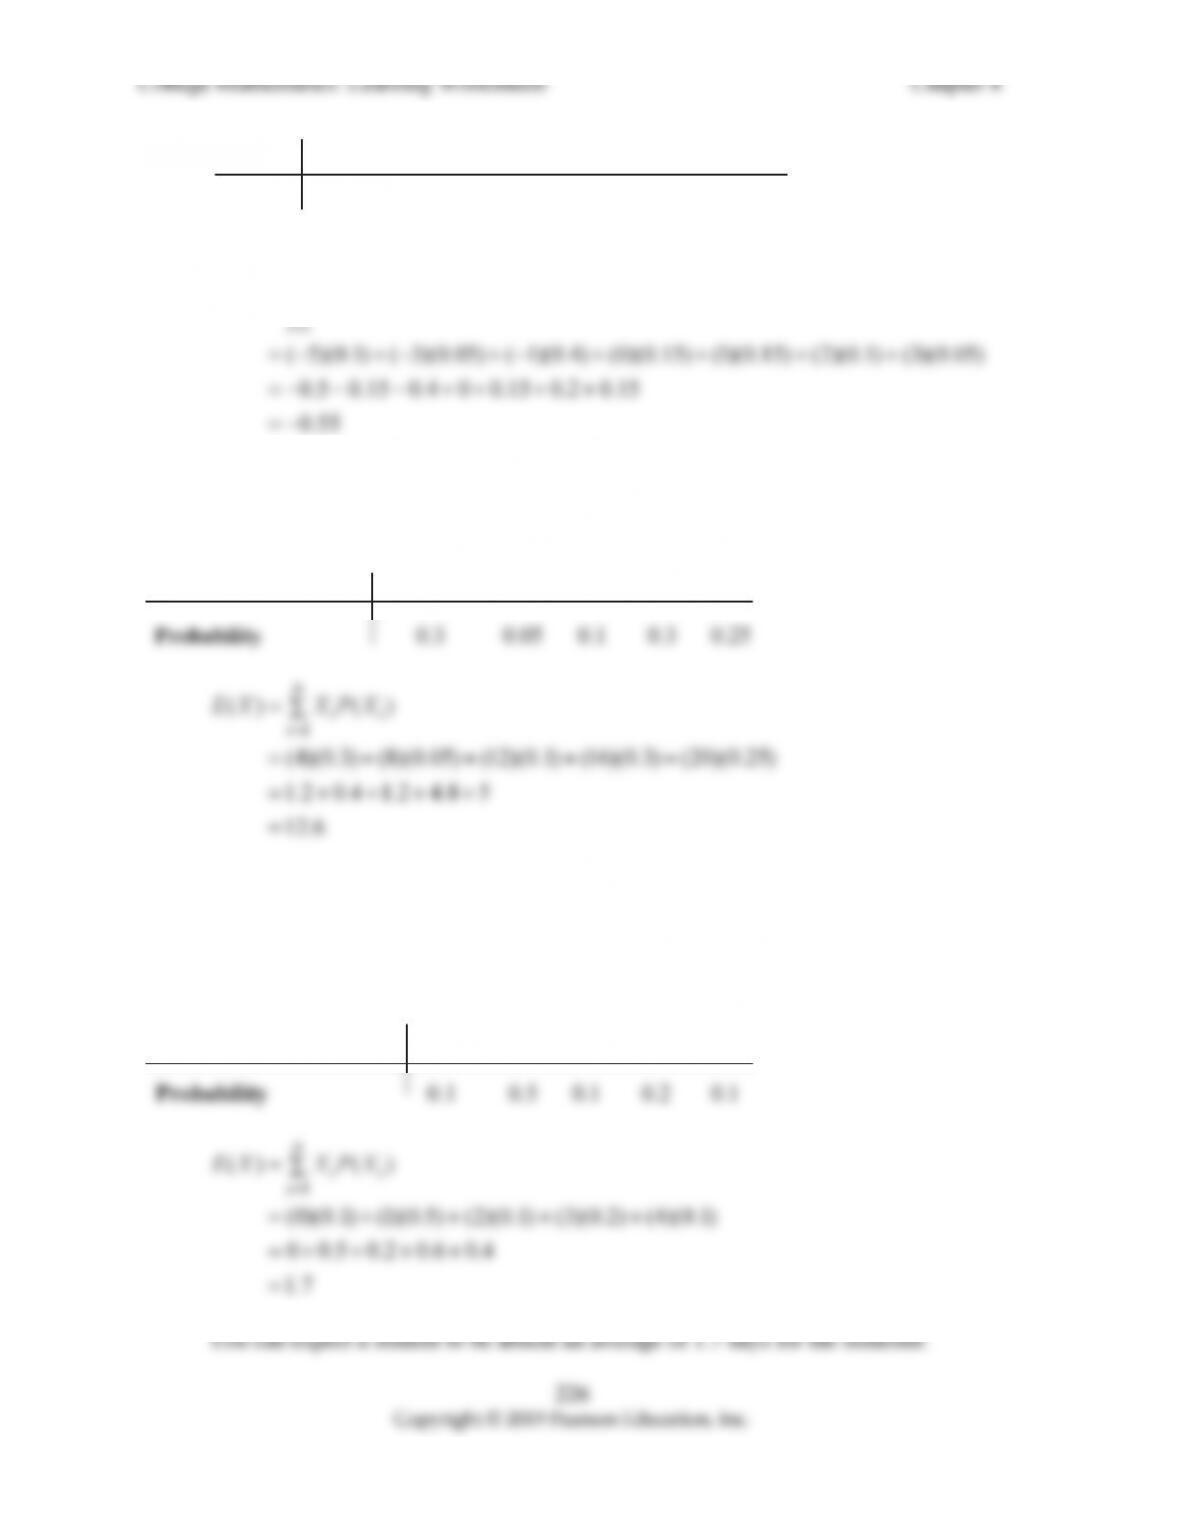
1. xi –2 0 2 4
1
() ( )
n
ii
i
EX XPX
=
=∑
2. xi –2 0 2 4
pi 0.1 0.4 0.1 0.4
1
() ( )
n
ii
i
EX XPX
=
=∑
Section 8-5 Random Variables, Probability
Distribution, and Expected Value
Expected Value of a Random Variable:
11 2 2 3 3
() nn
EX xp xp xp xp
227
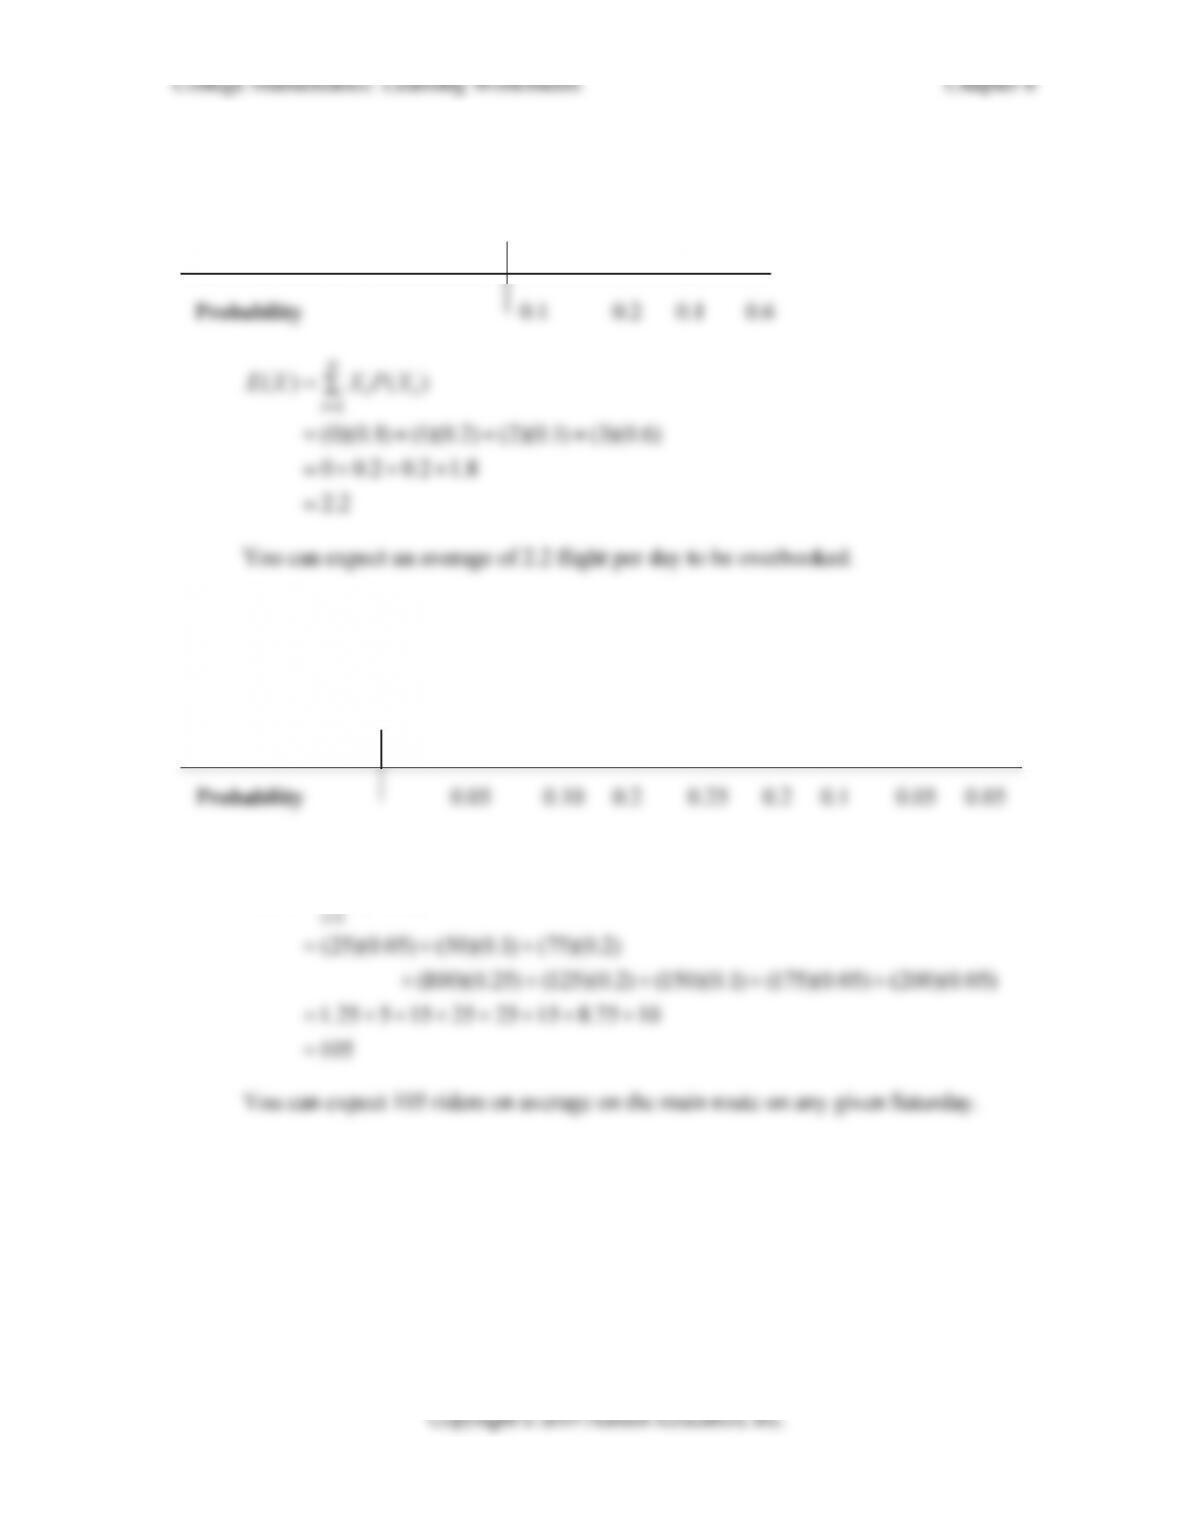
6. The following table gives the probability distribution of the number of flights that are
overbooked per day for Flying High Airlines. Find the expected number of flights that are
overbooked per day.
Number of Flights Overbooked 0 1 2 3
7. The following table gives the probability distribution of the number of people who ride
on the public transportation system on the main route on Saturdays in a large city. Find the
expected number of people on the transportation system on the main route on a Saturday.
Number of Riders 25 50 75 100 125 150 175 200
() ( )
n
ii
EX XPX

College Mathematics: Learning Worksheets Chapter 8
228