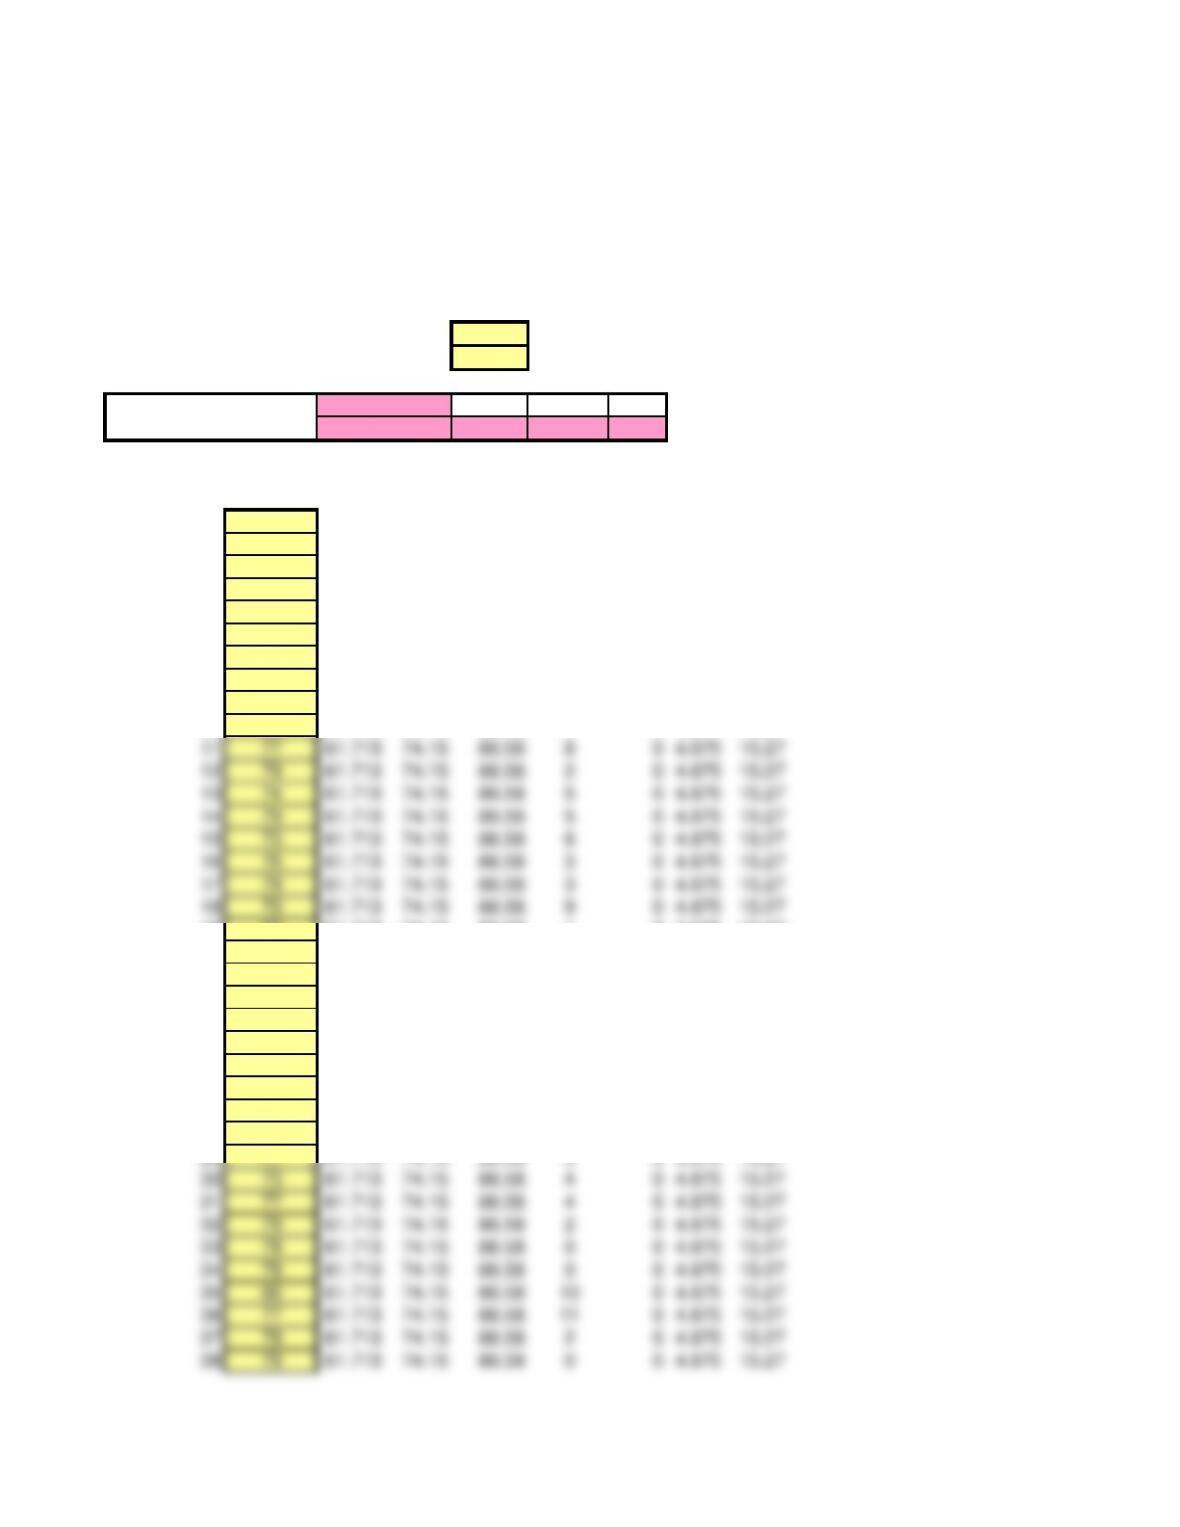
Knight Industries
Viscosity Measures
X and Moving Range Chart
This spreadsheet is designed for up to 50 observations and a moving range from 2 to 5. Enter data ONLY in yellow-shaded cells.
Enter the number of samples in cell E6 and the sample size in cell E7. Then enter your data in the grid below.
Click on sheet tabs to display the control charts (some rescaling may be needed).
Number of samples (<= 50) 41
2
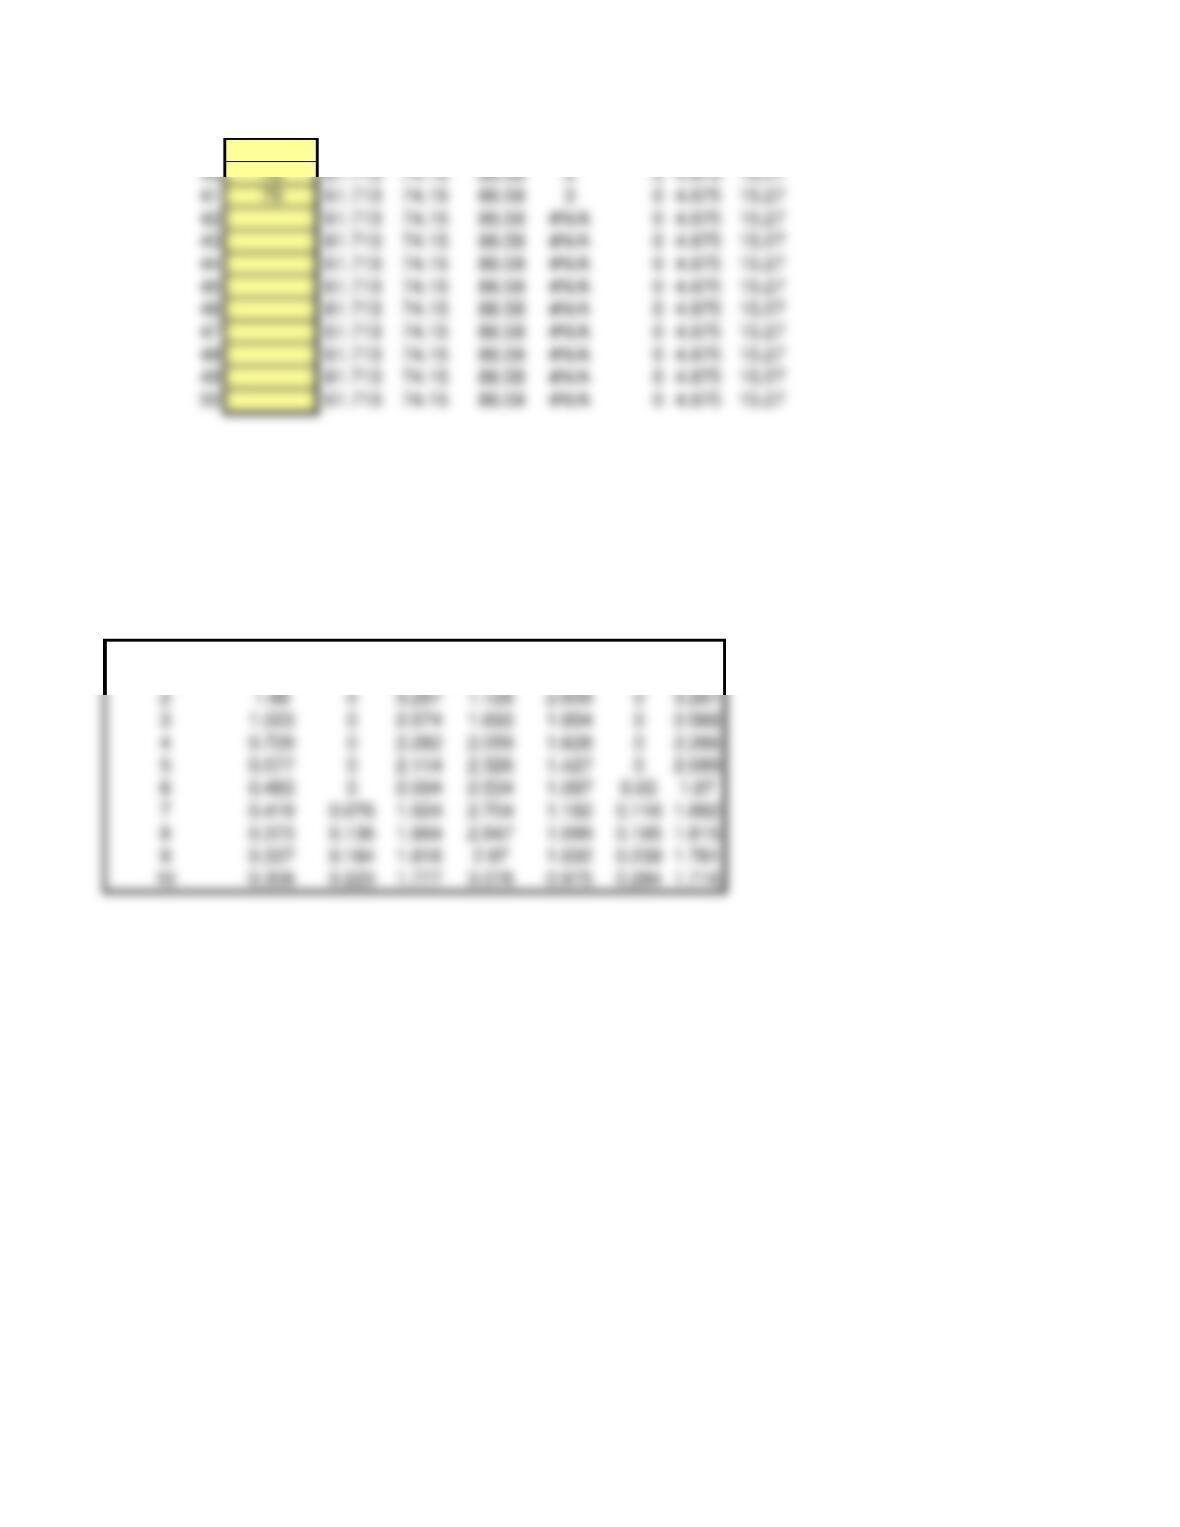
Grand Average D3 D4 d2
Average Range 0 3.267 1.128
Moving
Observation Value LCLx CLx UCLx Range LCLr CLr UCLr
174 61.713 74.15 86.58
269 61.713 74.15 86.58 5 0 4.675 15.27
379 61.713 74.15 86.58 10 04.675 15.27
475 61.713 74.15 86.58 4 0 4.675 15.27
562 61.713 74.15 86.58 13 04.675 15.27
669 61.713 74.15 86.58 7 0 4.675 15.27
773 61.713 74.15 86.58 4 0 4.675 15.27
879 61.713 74.15 86.58 6 0 4.675 15.27
968 61.713 74.15 86.58 11 04.675 15.27
10 69 61.713 74.15 86.58 1 0 4.675 15.27
19 69 61.713 74.15 86.58 1 0 4.675 15.27
20 74 61.713 74.15 86.58 5 0 4.675 15.27
21 75 61.713 74.15 86.58 1 0 4.675 15.27
22 74 61.713 74.15 86.58 1 0 4.675 15.27
23 70 61.713 74.15 86.58 4 0 4.675 15.27
24 75 61.713 74.15 86.58 5 0 4.675 15.27
25 65 61.713 74.15 86.58 10 04.675 15.27
26 69 61.713 74.15 86.58 4 0 4.675 15.27
27 74 61.713 74.15 86.58 5 0 4.675 15.27
28 72 61.713 74.15 86.58 2 0 4.675 15.27
Sample size for moving range(2 – 5)
74.146
4.675
39 79 61.713 74.15 86.58 0 0 4.675 15.27
DO NOT MODIFY THIS TABLE
nA2 D3 D4 d2 A3 B3 B4
Control Chart Factors
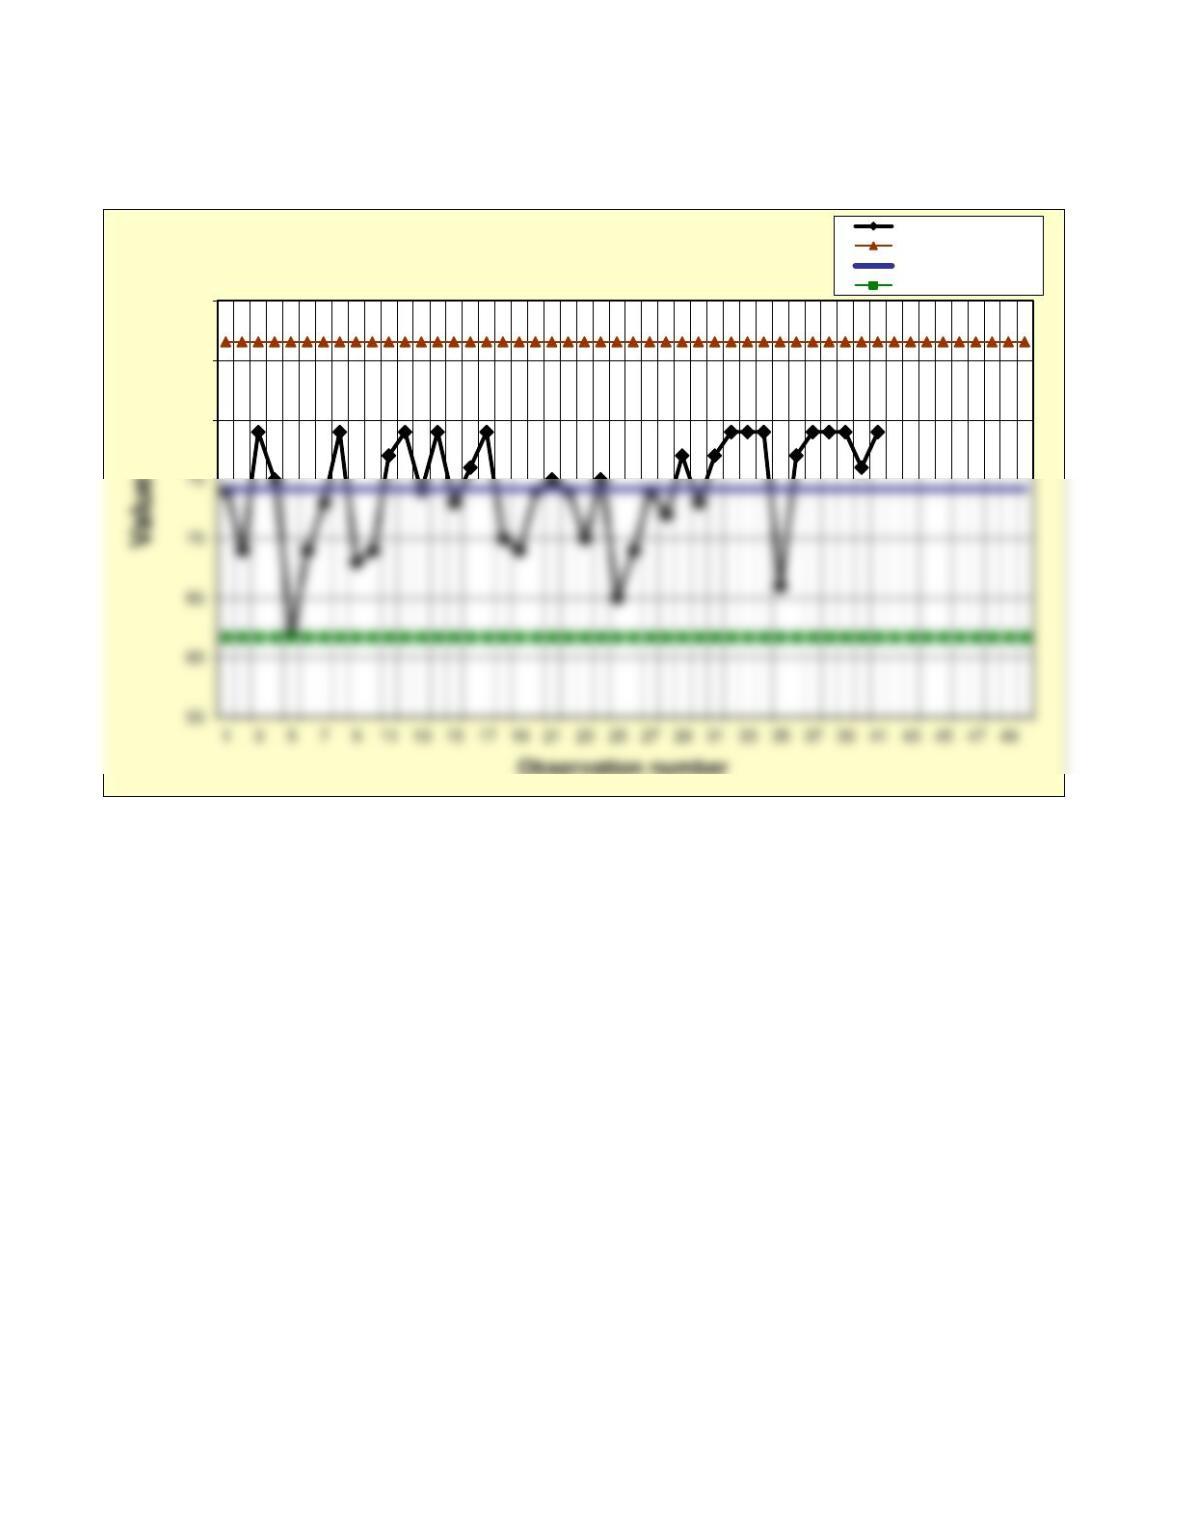
Knight Industries
Viscosity Measures
80
85
90
Observation number
Individuals (X) Chart – Viscosity Individuals
Upper control limit
Center line
Lower control limit
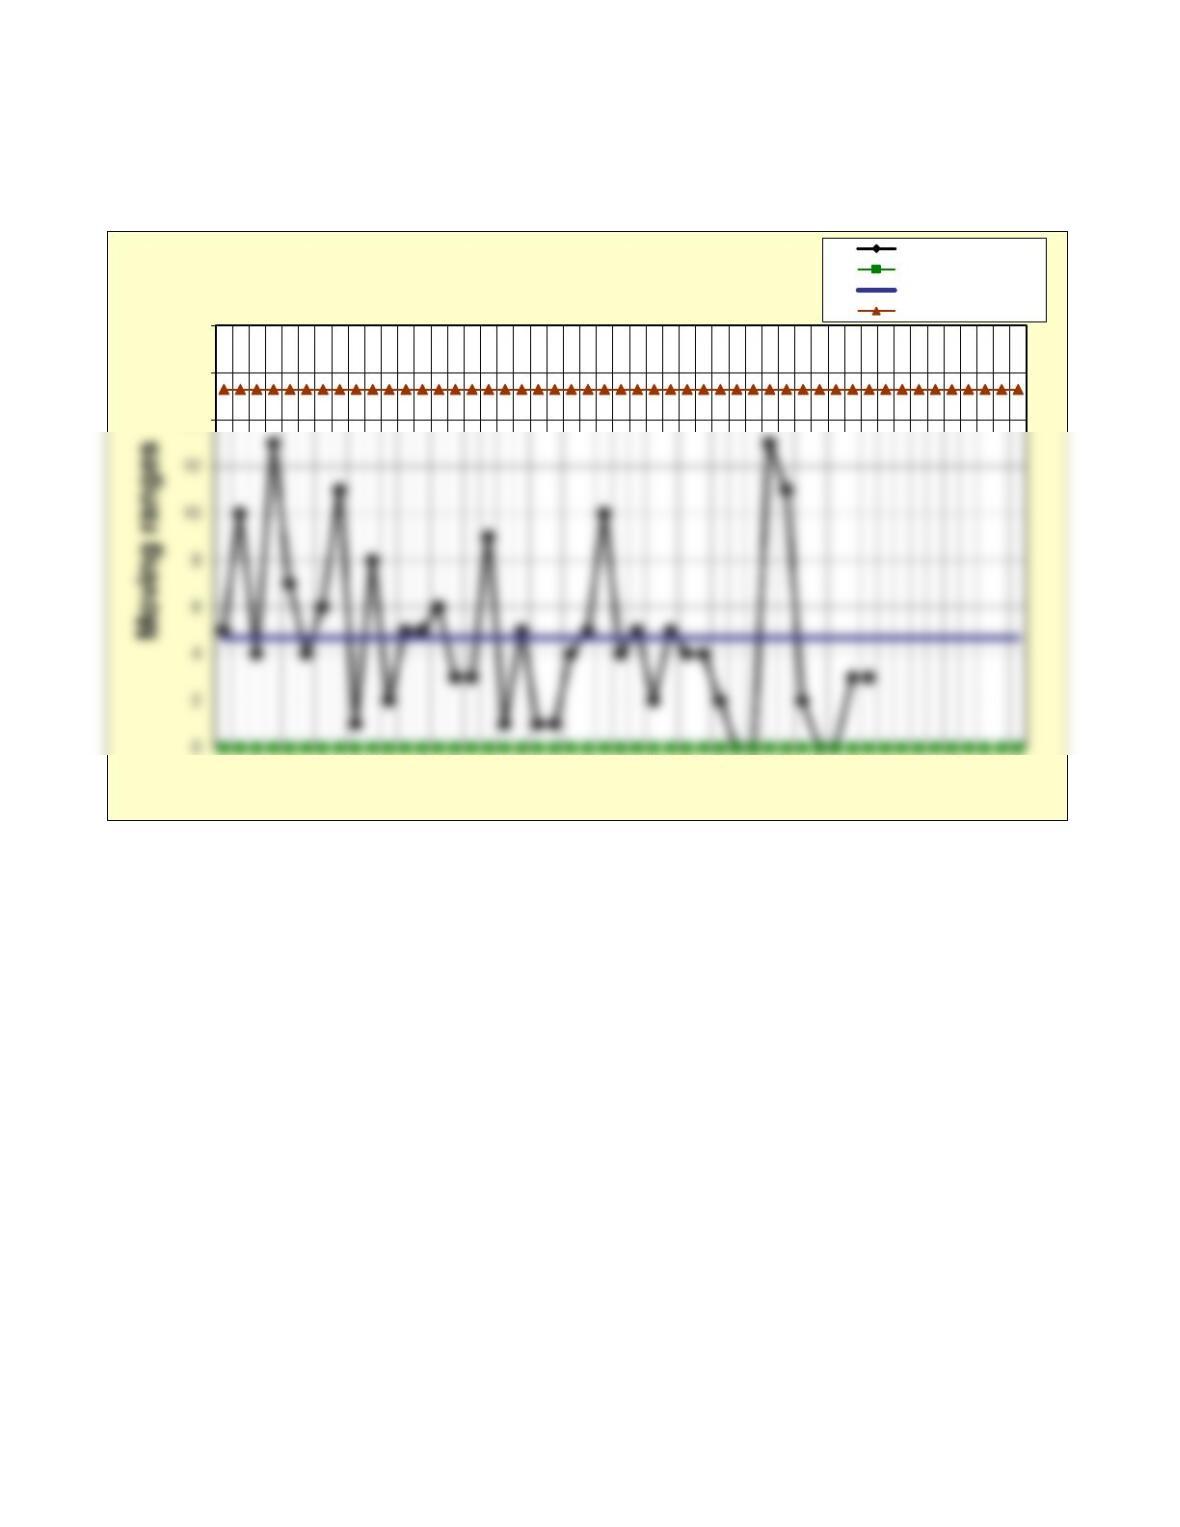
Knight Industries
Viscosity Measures
14
16
18
1 3 5 7 9 11 13 15 17 19 21 23 25 27 29 31 33 35 37 39 41 43 45 47 49
Observation number
Moving Range Chart – Viscosity Moving ranges
Lower control limit
Center line
Upper control limit