Montvalley Short-Haul Lines, Inc.
Billing Study Part II
Fraction Nonconforming (p) Chart
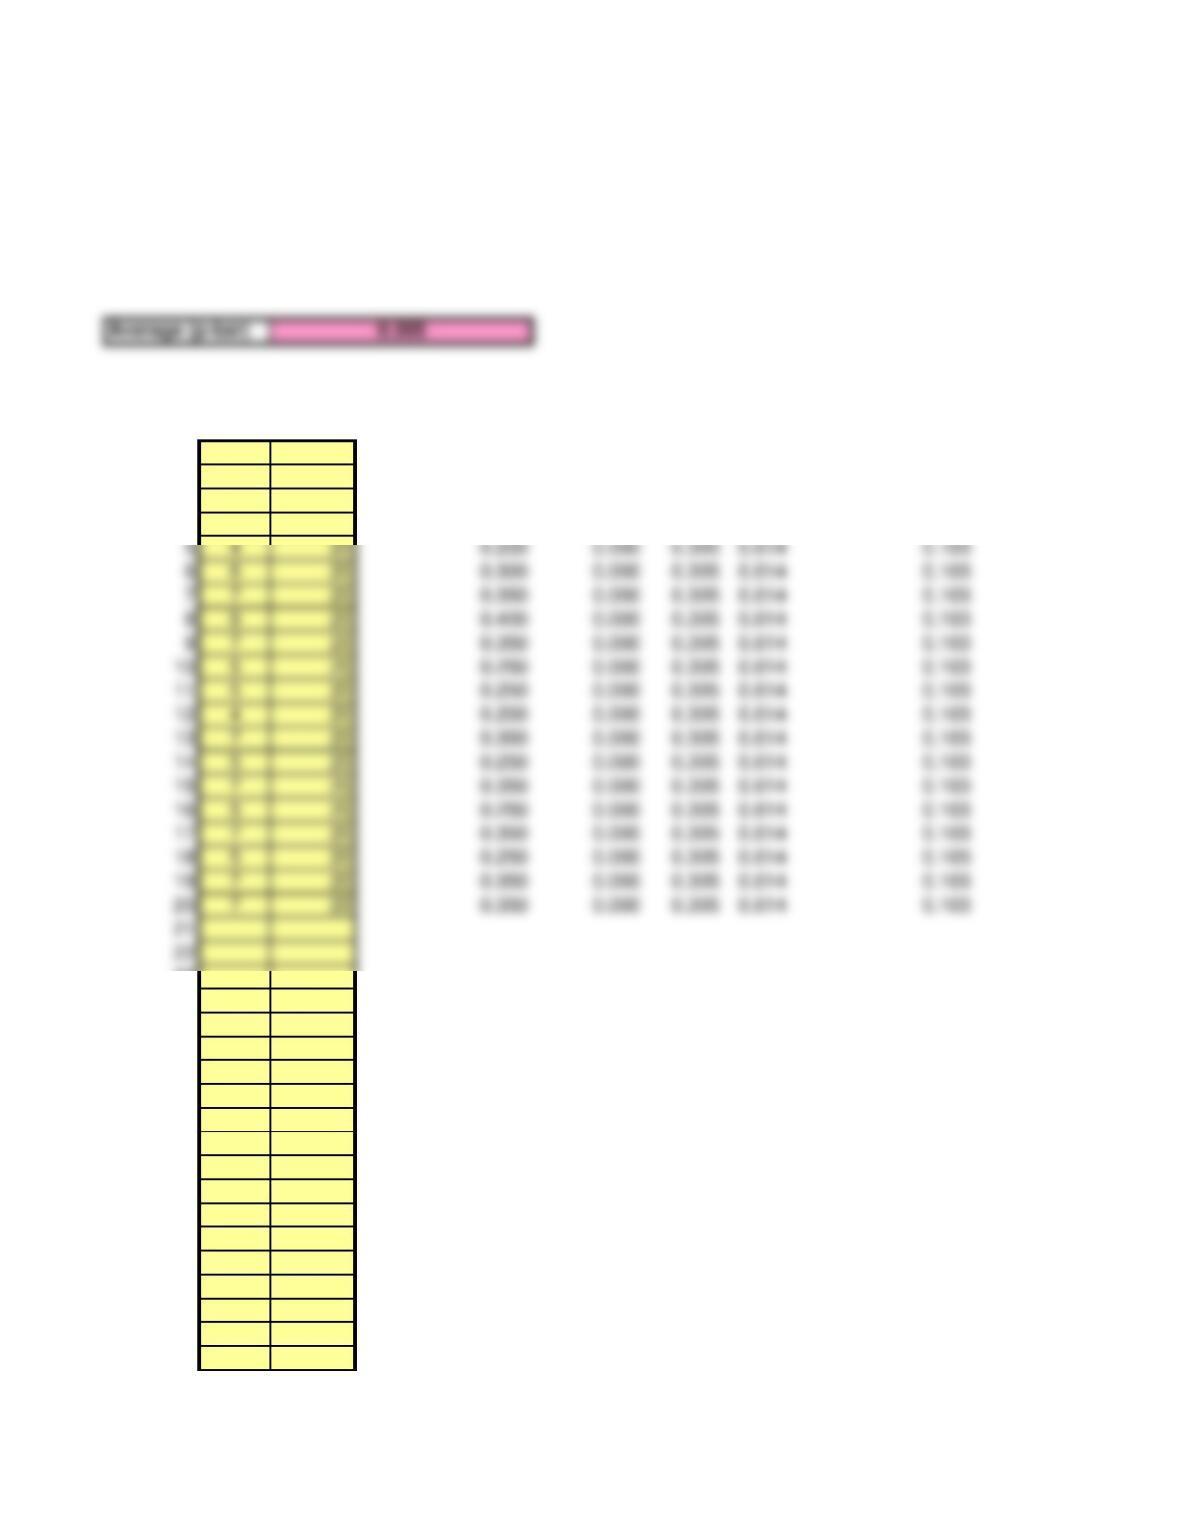
This spreadsheet is designed for up to 50 samples. Enter data ONLY in yellow-shaded cells.
Click on the sheet tab to display the control chart (some rescaling may be needed).
Sample Fraction Standard
Sample Value Size Nonconforming LCLp CL UCLp Deviation
1 6 20 0.300 0.000 0.305 0.614 0.103
2 6 20 0.300 0.000 0.305 0.614 0.103
3 7 20 0.350 0.000 0.305 0.614 0.103
4 7 20 0.350 0.000 0.305 0.614 0.103
23
24
25
26
27
28
29
30
31
32
33
34
35
36
37
38
39
40
41
42
43
44
45
46
47
48
49
50
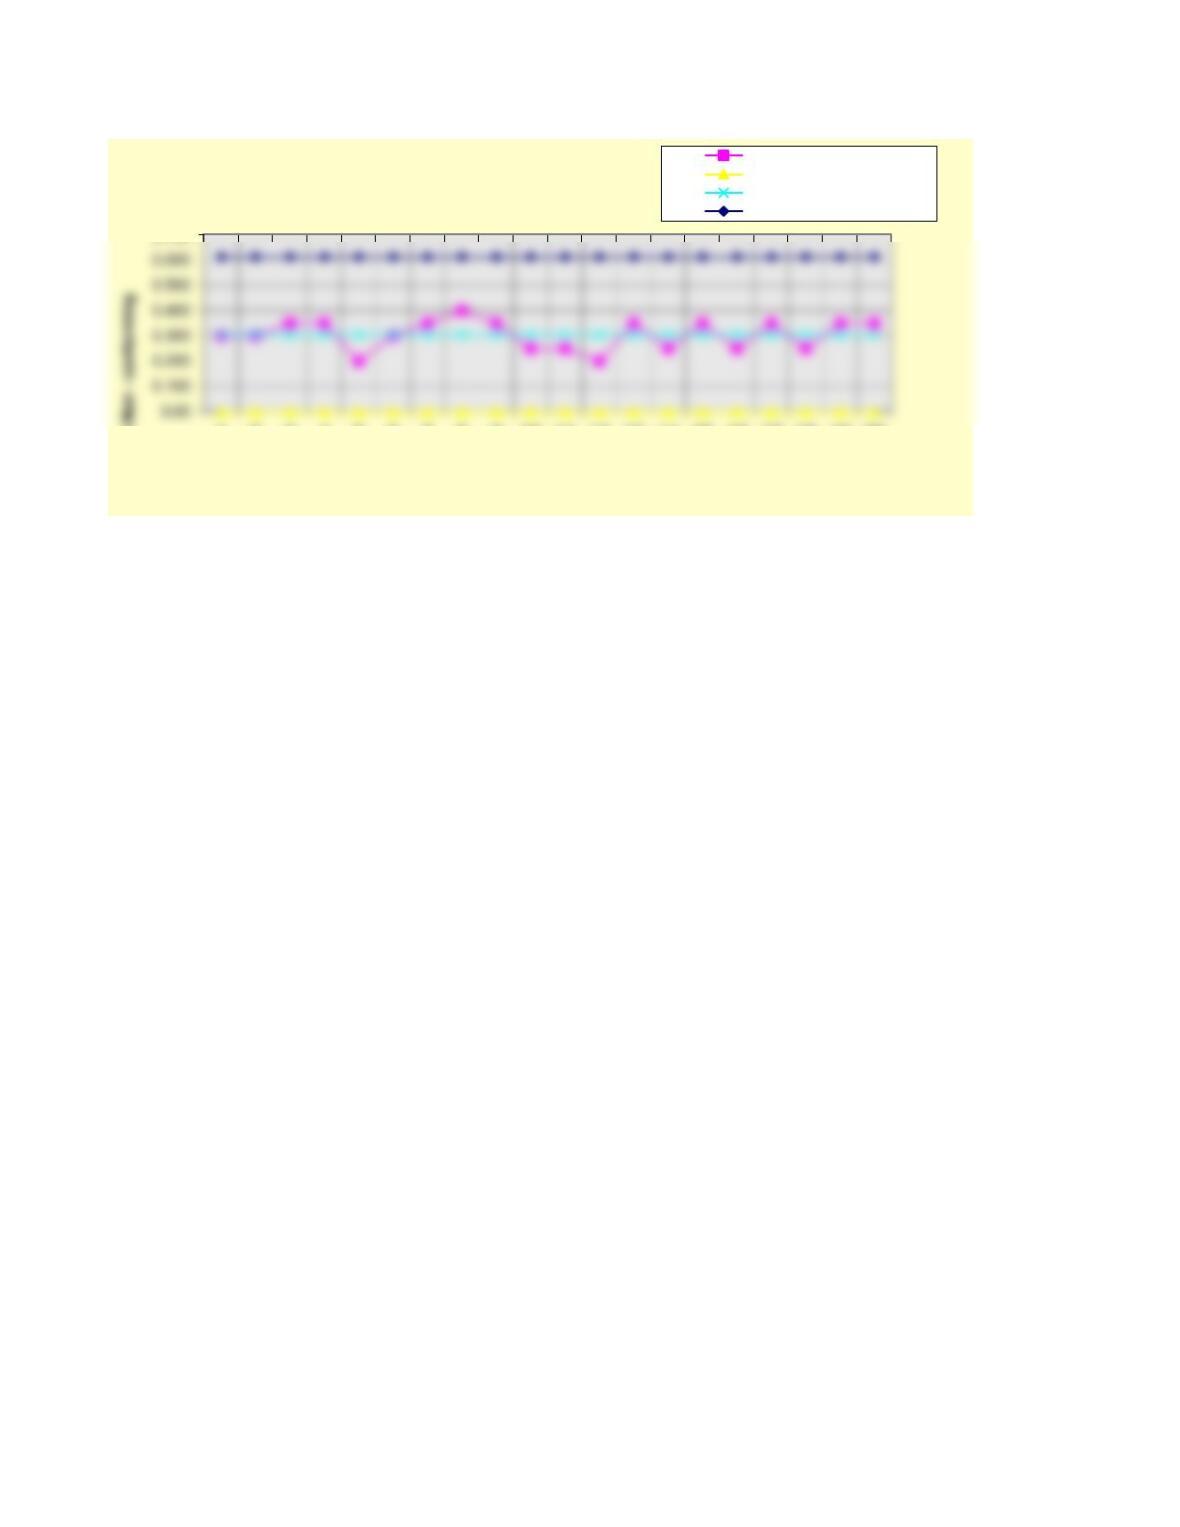
0.700
12345678910 11 12 13 14 15 16 17 18 19 20
% Non – conforming
Sample number
Attribute (p) Chart p Values
Lower Control Limit
Center Line
Upper Control Limit