Chapter 07S – Learning Curves
CHAPTER 07S
LEARNING CURVES
Teaching Notes
When dealing with learning curves there are four distinct areas which the decision-maker is concerned
about:
1. Beginning point: This involves the initial time estimate of the process. Of course if the
2. Shape of the curve and the rate of increase: In many cases the shape of the learning curve will
be consistent with the traditional 70%, 80%, 90% learning curve. However, in some instances,
the learning curve may be s-shaped and in rare instances, the shape of the learning curve may
3. Steady state: At a certain point during the learning process, the employee will reach a steady
state. This indicates the completion of the learning based on the given technology and the
4. Quality of the product: As the learning is taken place, workers are working at a faster pace.
We must make sure that the quality of the product is not compromised.
This seems to be a topic that students readily grasp. The one area that some seem to have difficulties
with is finding cumulative times (e.g., length of time for units 6 through 10). I find that reminding
them of how they determine areas under the normal curve helps most overcome this difficulty. If they
Answers to Discussion and Review Questions
1. As the number of repetitions increases, the requisite “doubling” needed to achieve the rate
2. A rate of 100 percent implies a constant rate of output. This would be desirable on an
3. A rate of 120 percent would imply that with each doubling of output, the rate of output
Chapter 07S – Learning Curves
7S-2
5. In addition to actual learning, there are supervision, methods improvements, preproduction
planning, scheduling, and motivation.
7. Learning curves are useful in cost estimation, bidding, contract negotiation, pricing new
products, and monitoring the improvement of trainees.
8. In some instances, certain resources may be transferred to new activities. For example, the
9. The implication of point #7 is that repetition times will decrease more slowly because the
worker is farther along the curve. This will make it appear that the learning rate is slower (i.e.,
closer to 100%) than it actually is.
Chapter 07S – Learning Curves
7S-3
Solutions
1.
T1 = 300 hr., P = 80 percent
2.
[T4 = T1(P2), i.e., T2 = T1 (P) and T4 = T2 (P) = T1 (P)(P)], T1 = 80 hr.
b.
P = 87%: 80(.872) = 60.55 hr.
3. T1 = 8 days
P = 85%
a. T1 (cum. t.f.) = 8(7.116) = 56.928 days
4. Tn = T1 x nb
T3 = 20 (31n.82/1n2)
T3 = 20 (.7301)
T3 = 14.60 hours
5. [Estimate P]
a. [estimate P using doubling concept and given data]
1 to 2: 46P = 39 minutes. Solving, P = 84.8%
b.
units 1–5: T1(cum. t.f.)
= 300(3.738)
= 1,121.4 hr.
Chapter 07S – Learning Curves
7S-4
[These can be compared against times obtained using 85 percent table factors and T1 = 46]
Unit
Data
Computed
1
46
–
2
39
39.1
b. Assume P = 85%
.min 206.26
30
)091.17(46 =
T2–4 = ? or
T2–4 = T1 (cum. t.f.4 – cum. t.f.1)
= 50 (2.758 – 1.000) = 87.9 min.
7. T1–4 = 600 hr. (1) Find T1: T1 (cum. t.f.1–4) = 600 hrs.
8. T5 = 14.5 hr.
a. (1) Find T1: T1 (unit t.f.5) = 14.5 hr.,
52.18
783.
5.14
T,
783.
T
T1
5
1===
3
35
4
33
5
32
6
30
Chapter 07S – Learning Curves
7S-5
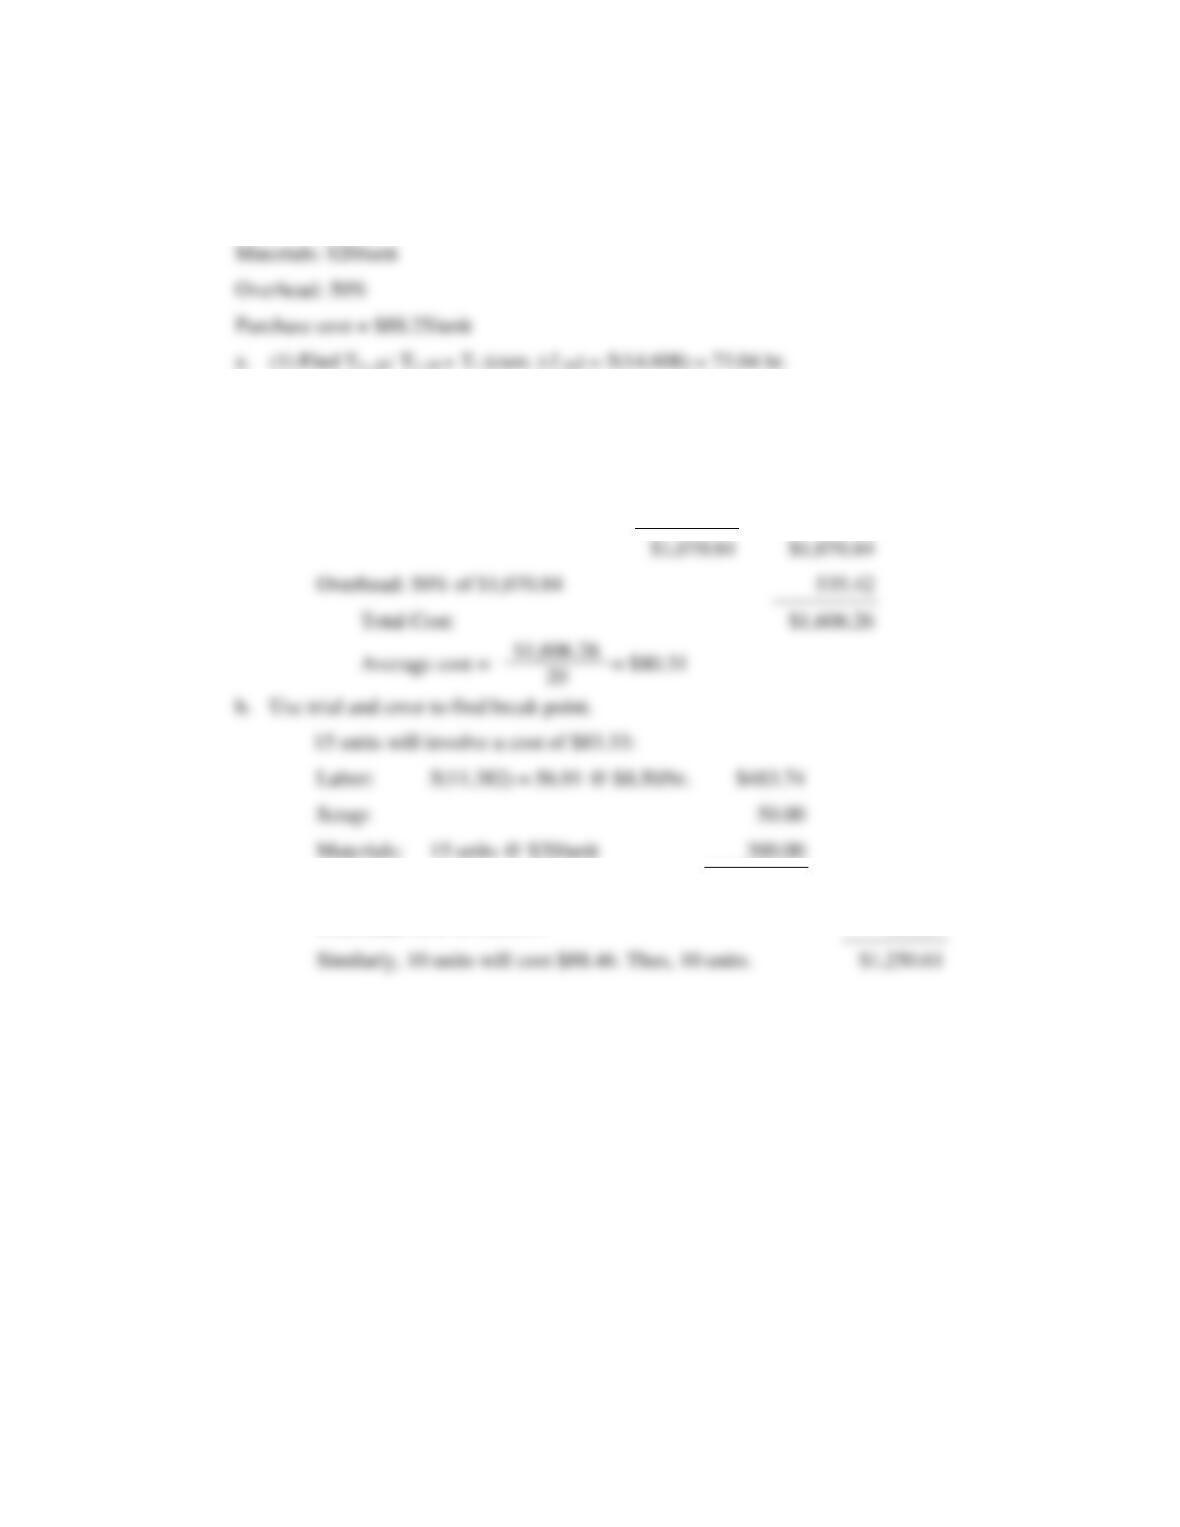
9. Labor: $8.50/hr. P = 90%
Setup: $50 T1 = 5 hr.
(2) Compute cost:
Labor:
73.04 hr. @ $8.50/hr.
$ 620.84
Setup:
50.00
Materials:
20 units @ $20/unit
400.00
Overhead: 50% of $1,070.84
535.42
Total Cost:
Labor:
5(11.382) = 56.91 @ $8.50/hr.
Setup:
Materials:
15 units @ $20/unit
300.00
$833.74
$833.74
Overhead: 50% of $833.74
416.87
Similarly, 10 units will cost $88.46. Thus, 10 units.
$1,250.61
Chapter 07S – Learning Curves
7S-6
10. Standard 6th repetition = 6 hours
.89 .90
.80
.75
A
B
C
1st
9
10
12
11. Using Formula 7S–1,
Tn = T1 x nb
n
nb
Tn
2
0.880
35.20
32.66
4
0.774
30.98
29.73
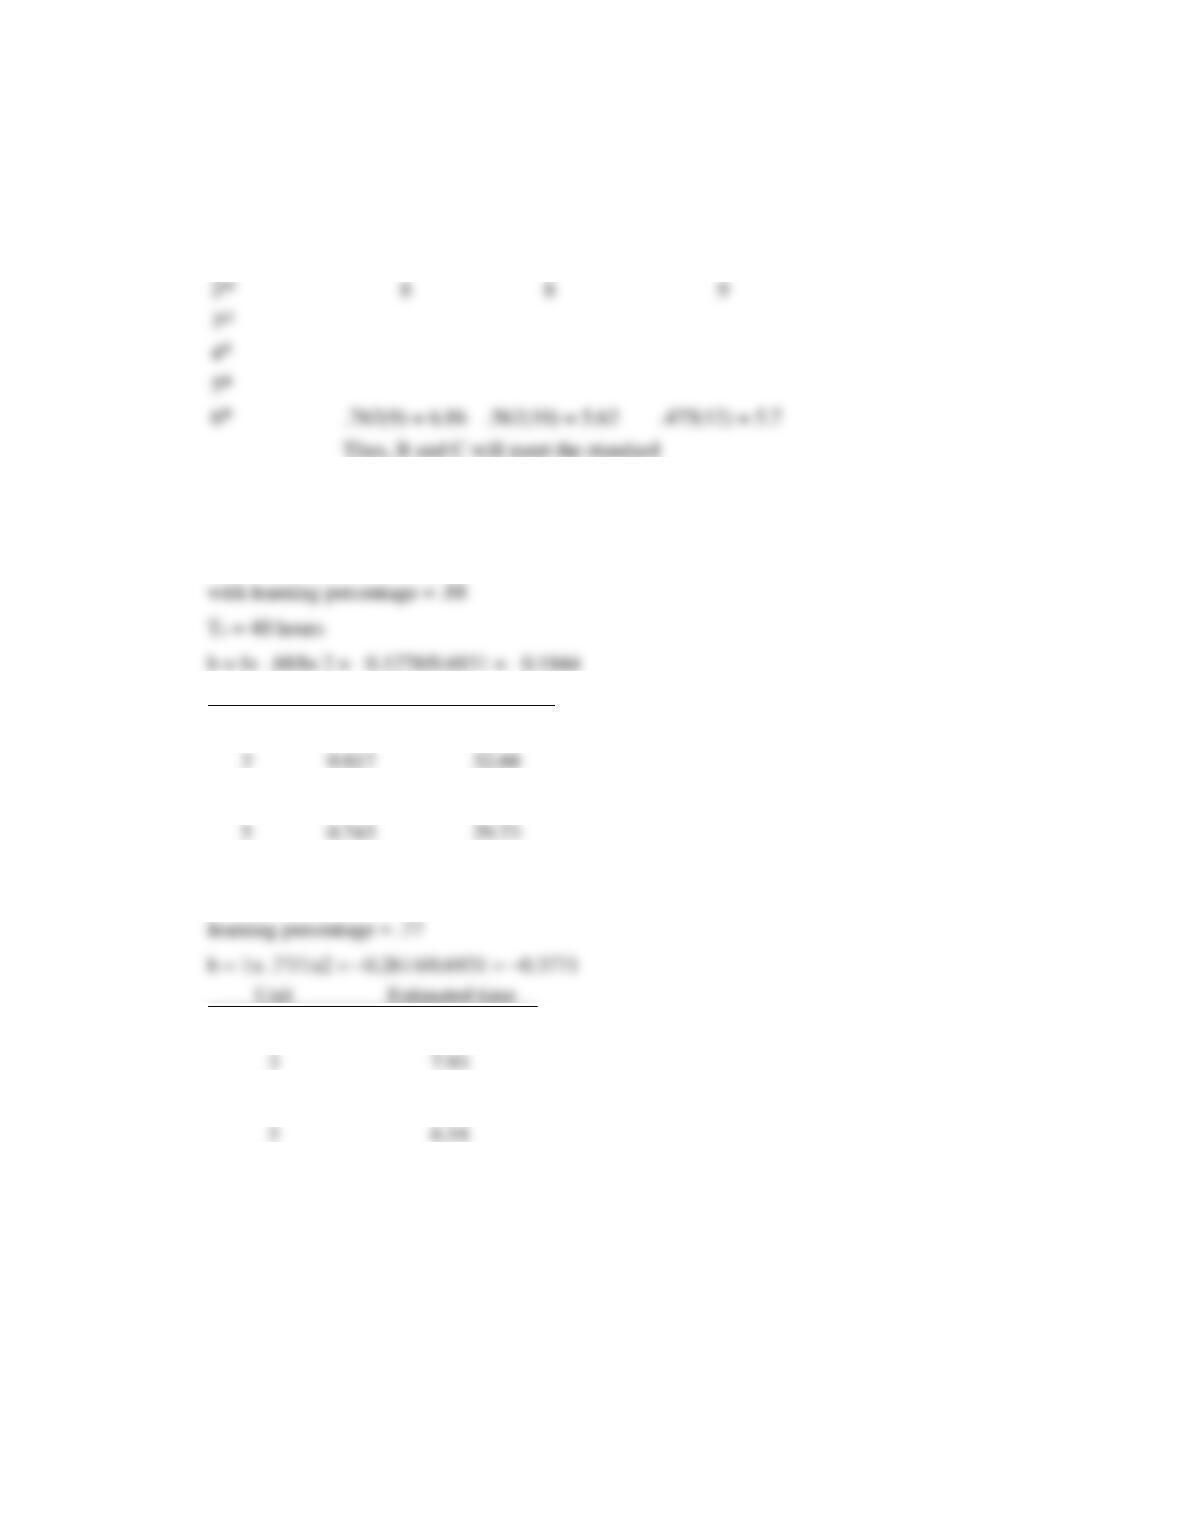
12. T1 = 12 hours
2
9.24
4
7.11
5
6.54
Total
30.82
3rd
4th
6th
Thus, B and C will meet the standard
Chapter 07S – Learning Curves
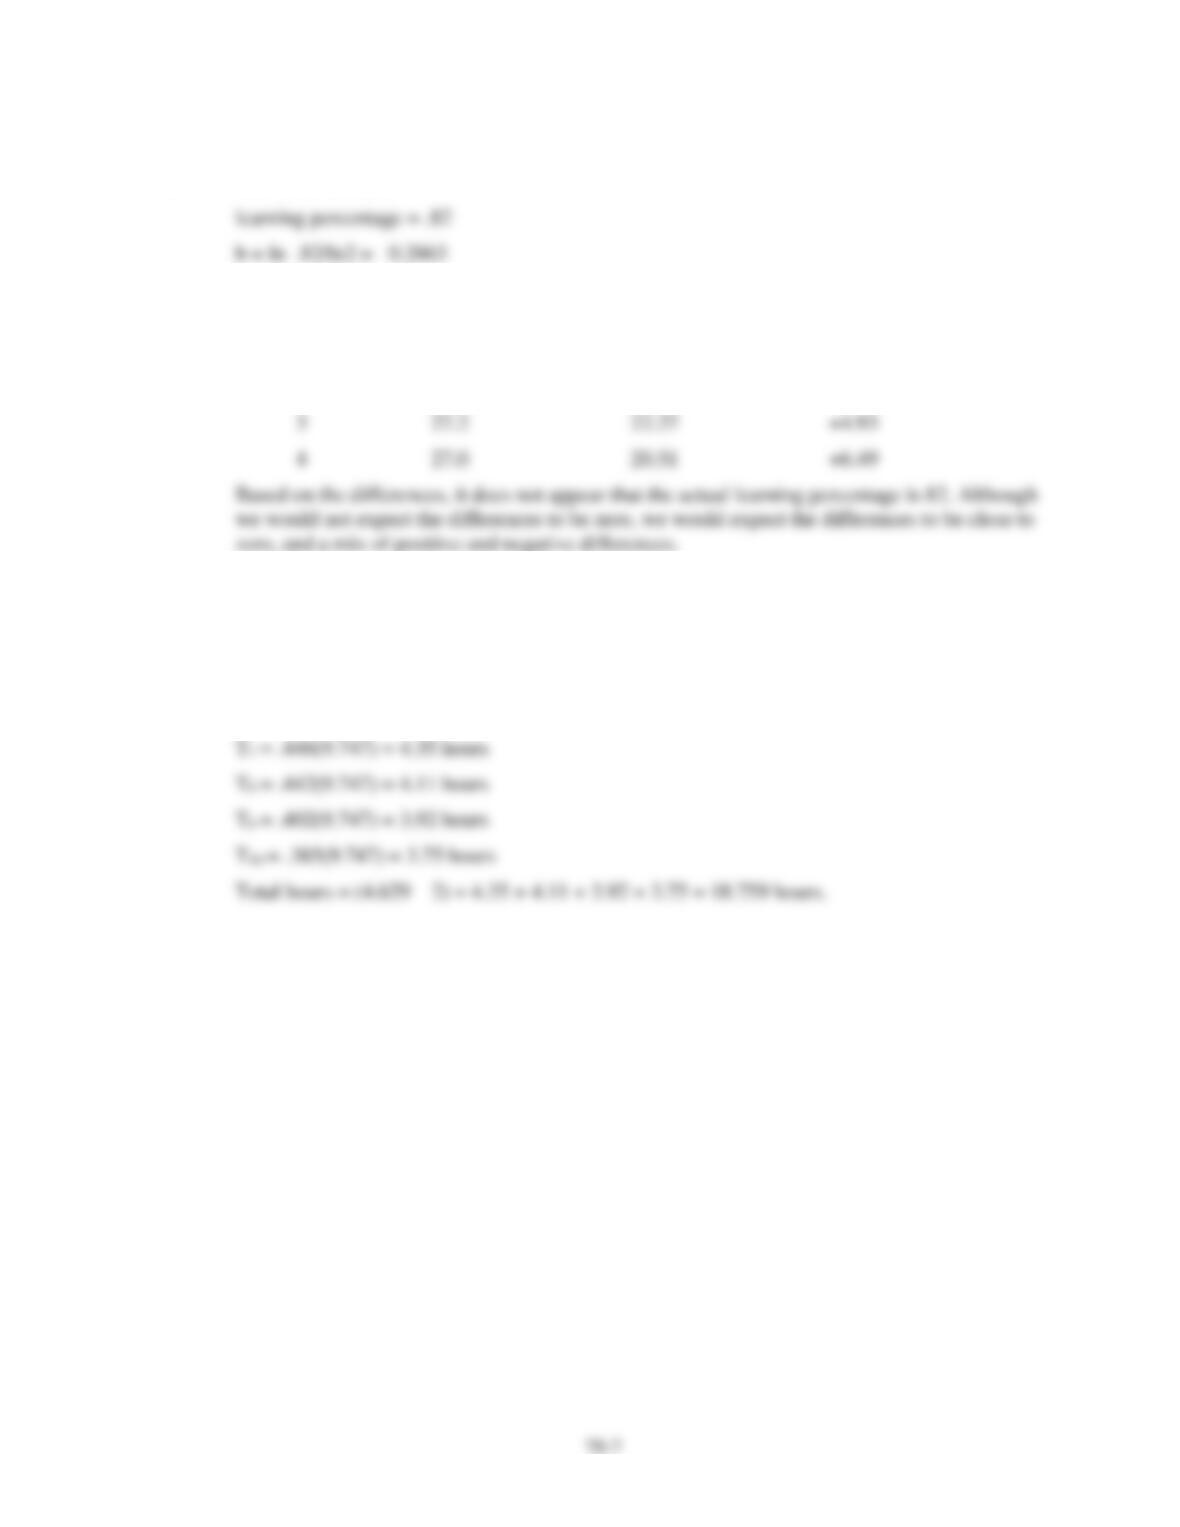
13. T1 = 30.5 minutes
Unit
Actual time
Expected time
Actual/Expected
1
30.5
–
2
28.4
25.0
+3.40
14. 5th unit = 5 hrs. = .513 (See Table 7S–1)
T1 = 5/.513 = 9.747 hours
T6 = .475(9.747) = 4.629 hours
Chapter 07S – Learning Curves
7S-8
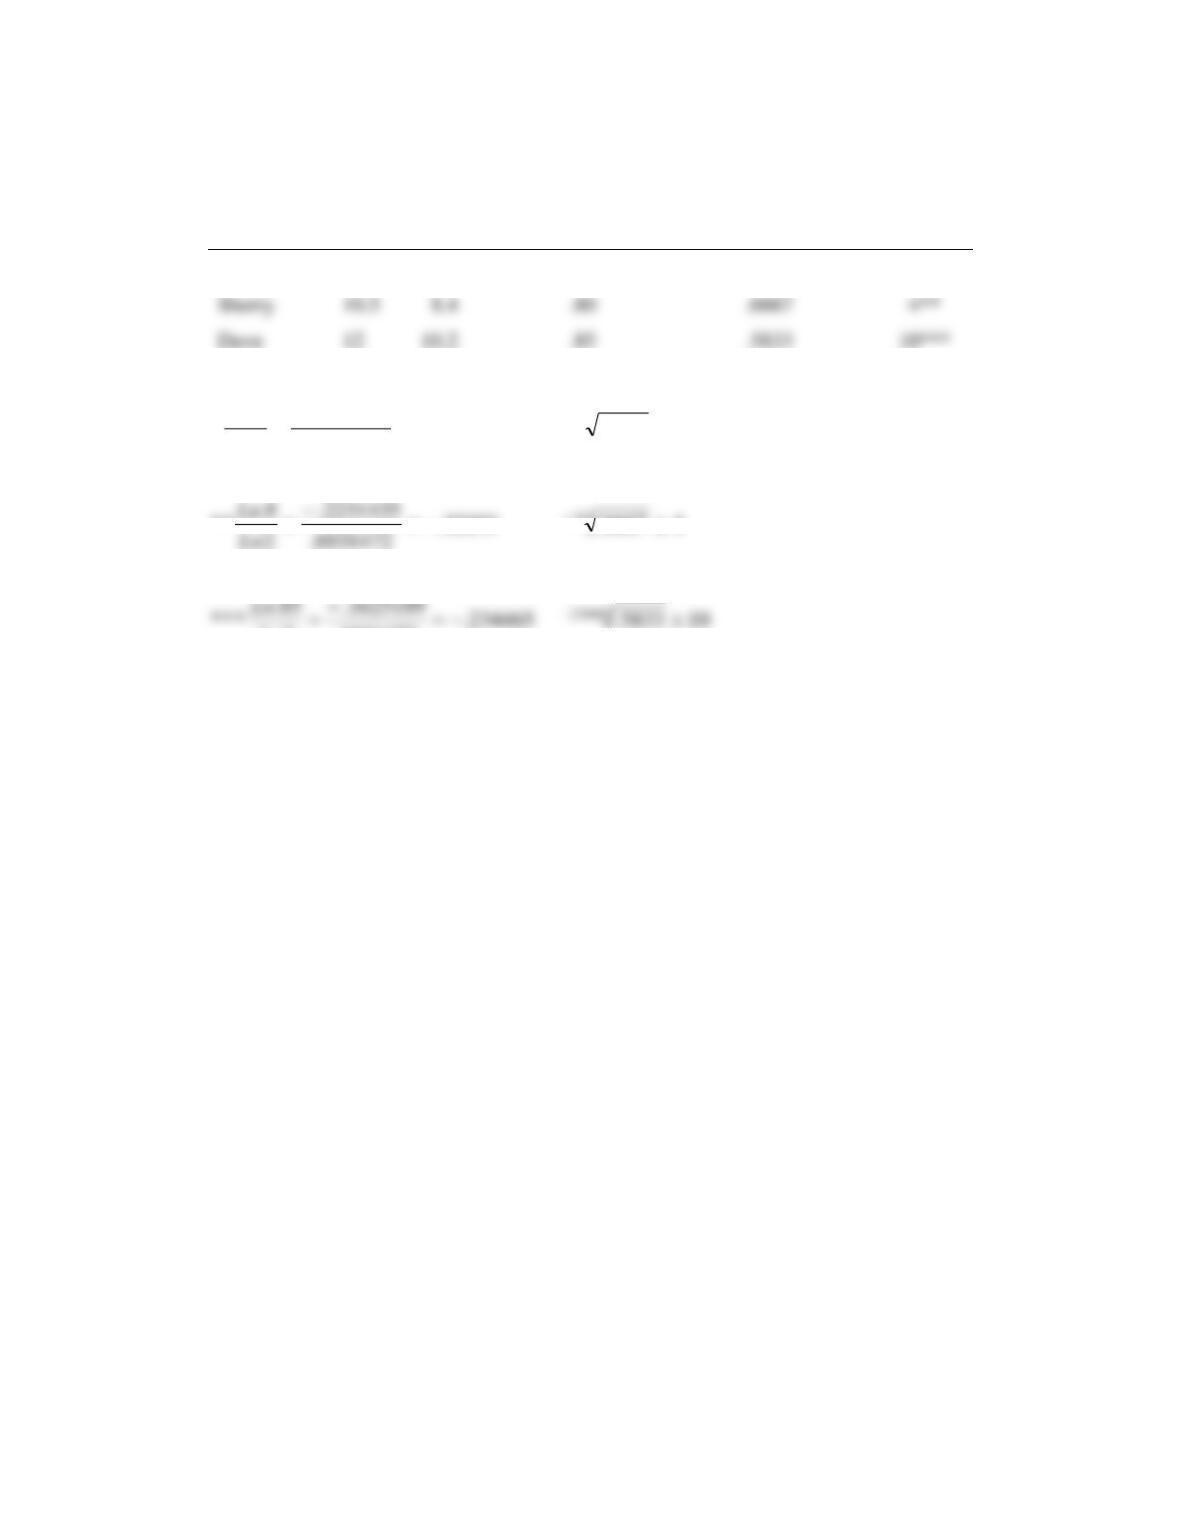
15.
Trainee
T1
T2
Learning %
T2 T1
Unit time factor =
Tn T1
n
Art
11
9.9
.90
.6363
20*
6931472.
2
46667.32193.
**
206363.152.
6931472.
1053605.
2
9.
*
322.
152.
−=
=
−=
−
=
−
−
Ln
Ln
Ln
n can also be obtained from Table 7S–1 based on the appropriate learning percentage and unit
time columns.
Sherry
10.5
8.4
.80
.6667
Chapter 07S – Learning Curves
7S-9
16. Her learning rate is T2 T1 = 25 30 = .8333. Because this is not one of the listed percentages
in the learning factors table, the log formula must be used.
Compute the ratio of the standard (specified) time to the first time: 18 minutes/30 minutes =
.60.
The ratio of ln .8333 to ln 2 is 0.1823616 0.6931472 = 0.2631.
97.660.
2631.=
−
Therefore 7 repetitions will be needed for Irene to reach standard.
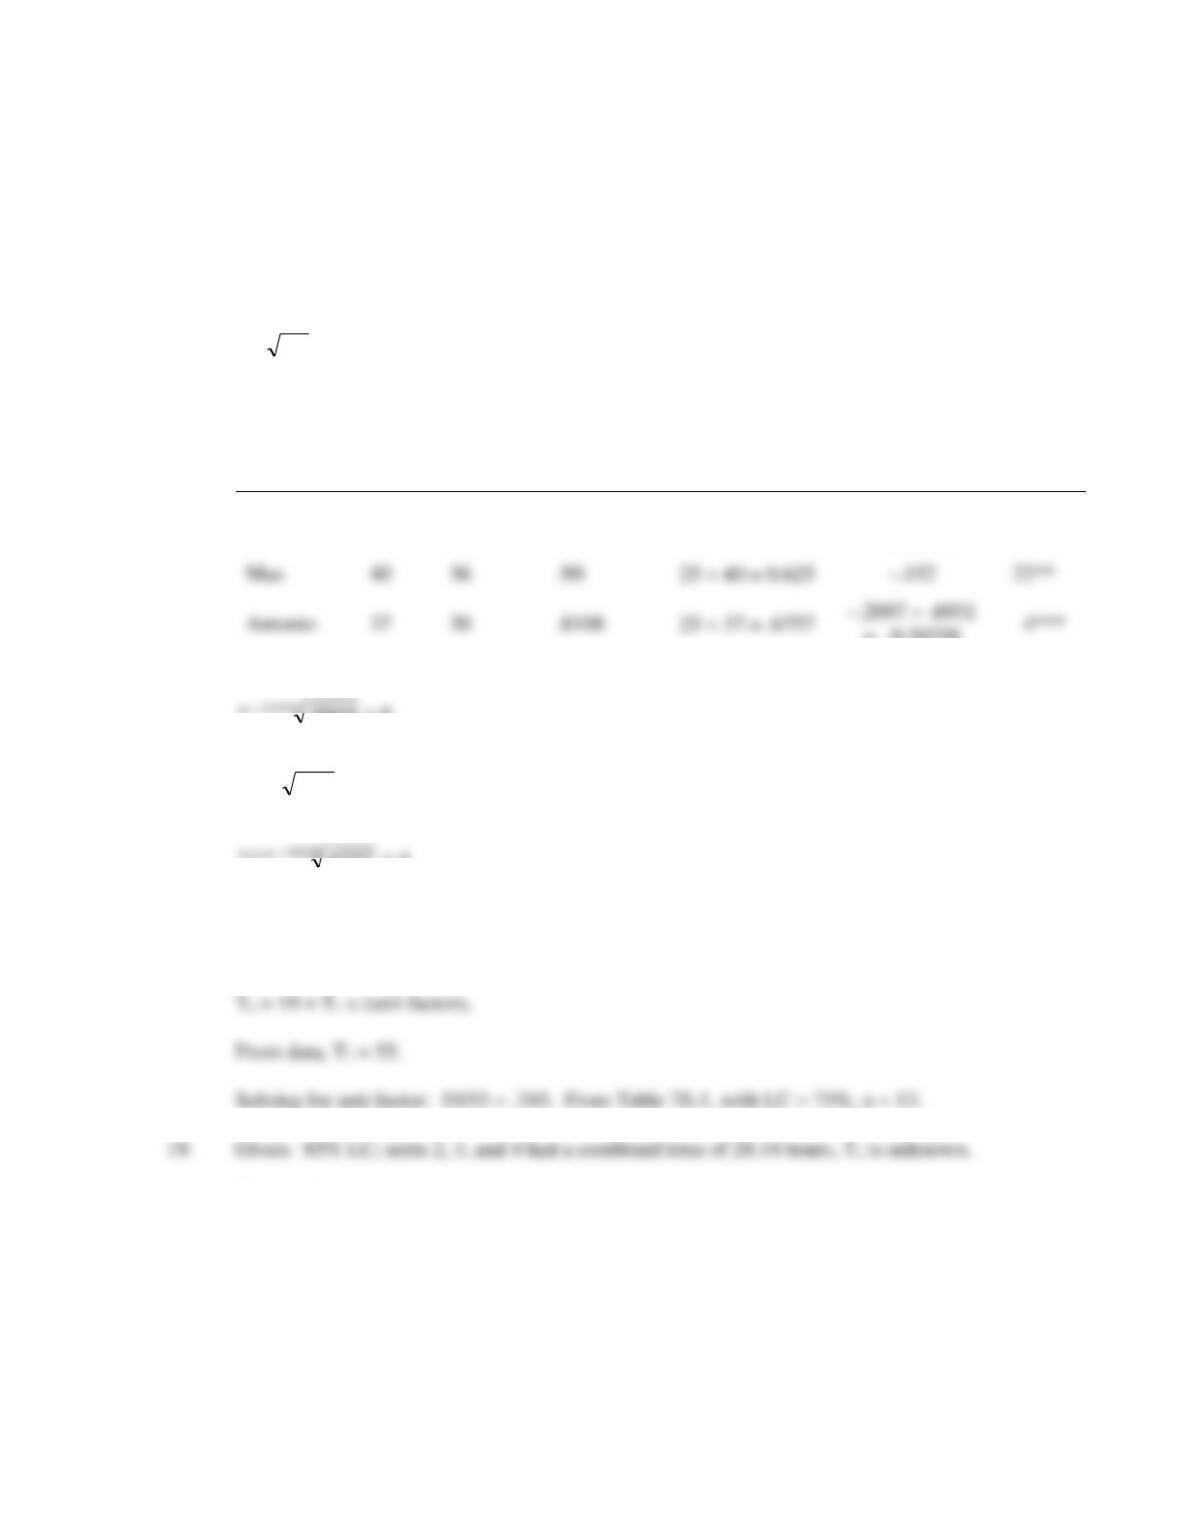
17.
Trainee
T1
T2
Learning %
T2 T1
Unit time factor =
Tn T1
Ln % ln 2
n
Beverly
36
31
.8611
25 36 = .6944
–.1495 .6931
= –.215747
6*
= –0.30258
46757.***
22625.**
66944.*
152.
−
18. Based on the observed times, and obtaining the ratios of T2/T1, T4/T2, T6/T3, and T8/T4,
the (average) learning rate is 75%.
28.14 = T1 (Total Factor4) – T1.
28.14 = T1 (3.345) – T1. Solving, T1 = 12.
T5 = T1 (.686) = 12(.686) = 8.232 hours
Antonio
37
30
.8108
25 37 = .6757
–.2097 .6931
4***
Chapter 07S – Learning Curves
7S-10
Case: Product Recall
The case has numerous possible dimensions that students can explore. When I have used this in class,
I found much interest among students, and usually I have to cut off the discussion because it runs long.
1. Questions that need to be addressed in order to analyze this case:
a. The recall
1) What is the expected number of recalled cars?
b. The manufacturer
1) How many repairs did the engineers make to establish an average repair time?
2) Why did engineers do the repairs instead of mechanics?
5) What were the hours for the initial units?
c. The dealership
1) What were the repair times for the three mechanics for the 3rd, 4th, 5th, etc. units?
2) Did the mechanics work independently or in teams?
3) Did the mechanics record their own times, or did management?
2. Observations regarding the information provided in the case:
a. There seems to be a significant disparity between the engineers’ learning rate (90%) and
the mechanics’ rate (75%).
Chapter 07S – Learning Curves
7S-11
3. Discussion and comments on major points:
a. Dealers would do best to limit one or a few mechanics to do repairs.
b. Collect more data from company and other dealerships before concluding average time of
4 hours is appropriate.