Problem 7-19
Supercelluar Battery Life-Reliability
Enter data only in the shaded cells
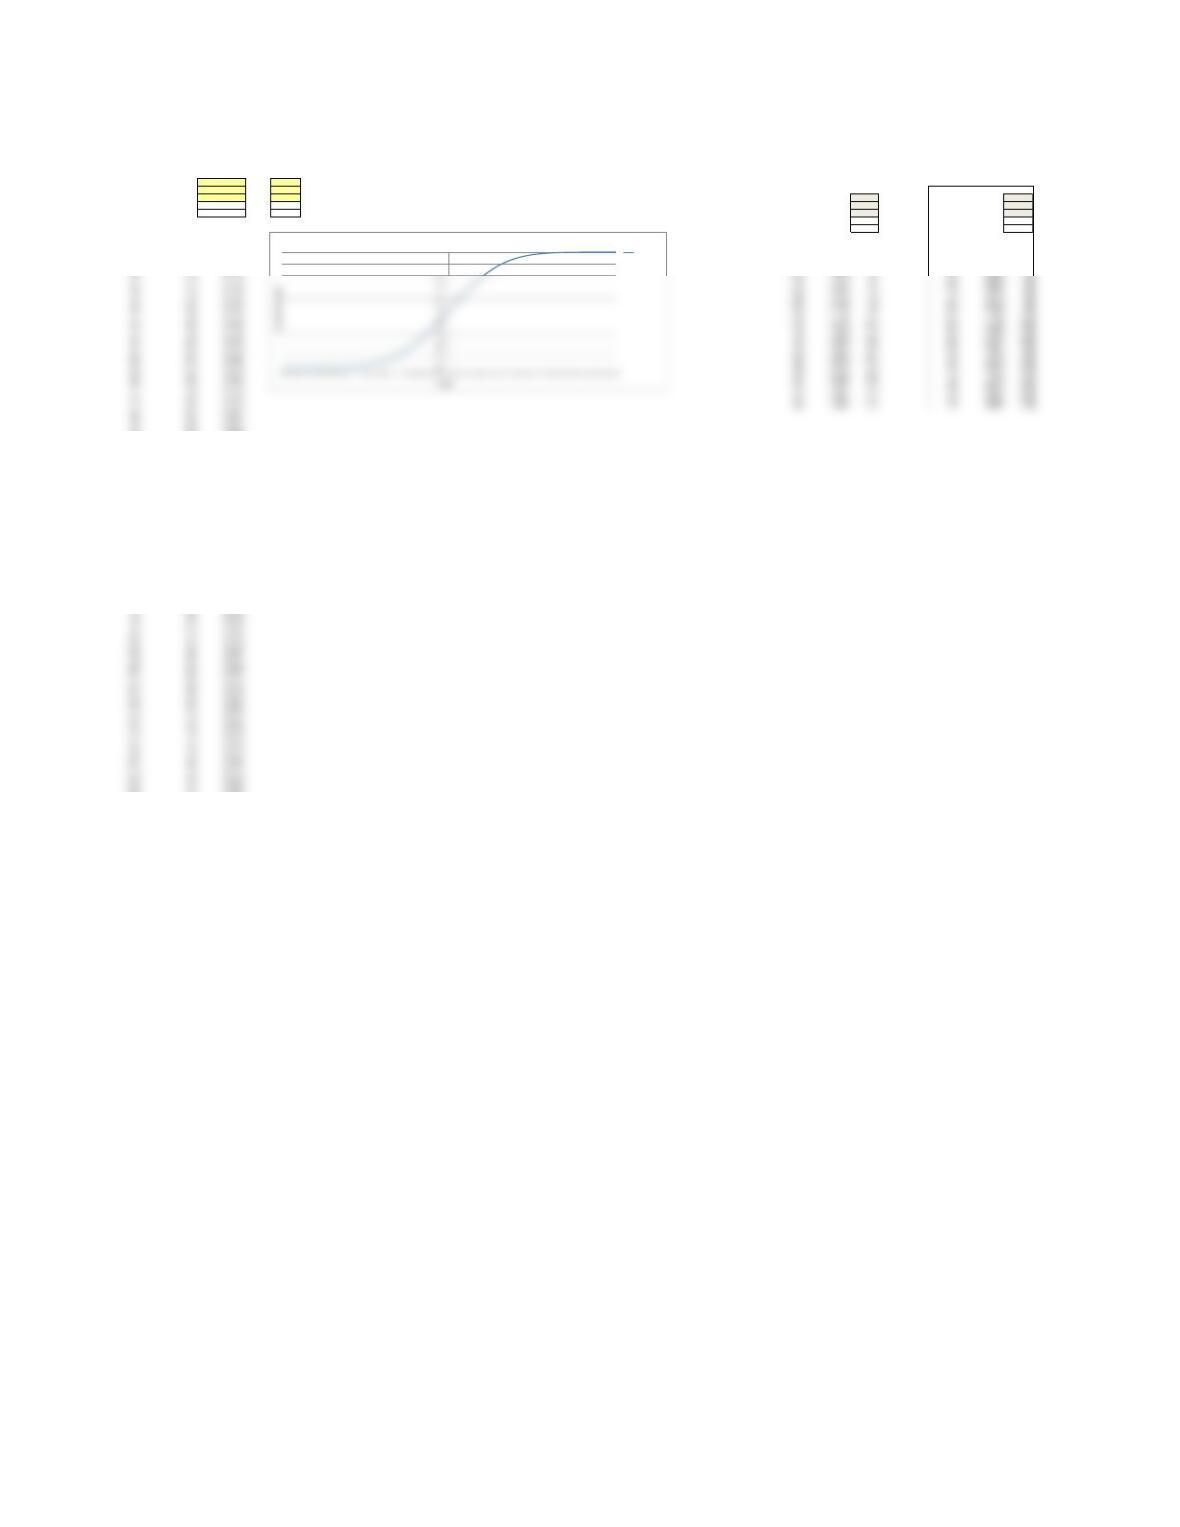
This spreadsheet is designed to calculate the probability of values equal to, or less than, a desired x value,
given the mean and standard deviation of a normally distributed variable. It uses the cumulative normal distribution
Enter the mean of the distribution in shaded cell D8 and the standard deviation in shaded cell D9. below.
Enter the desired X-value in shaded cell D10, below. The calculated z-value and probability will be seen in D11 and D12.
Mean of distribution 950 950 NORMAL PROBABILITY CALCULATIONS
Std deviation of distribution 40 40
Desired x-value 1010 900 Mean of distribution 1020
Calculated z-value 1.50 -1.25 Std Dev of distribution 20
Probability of x, or less 0.93319 0.10565 Desired x-value 1044
Calculated z-value 1.20
(X-axis) Probability Using Prob. of x, or less 0.88493
Desired x-values Equivalent – Z Values NORMS.DIST
790 -4.00 0.00003 Equivalent Probability Using Desired
794 -3.90 0.00005 Z Values NORM.DIST x-values
798 -3.80 0.00007 -4.00 0.00003 940
802 -3.70 0.00011 -3.60 0.00016 948
806 -3.60 0.00016 -3.20 0.00069 956
894 -1.40 0.08076
898 -1.30 0.09680
902 -1.20 0.11507
906 -1.10 0.13567
910 -1.00 0.15866
914 -0.90 0.18406
918 -0.80 0.21186
922 -0.70 0.24196
926 -0.60 0.27425
930 -0.50 0.30854
934 -0.40 0.34458
938 -0.30 0.38209
942 -0.20 0.42074
946 -0.10 0.46017
950 0.00 0.50000
954 0.10 0.53983
958 0.20 0.57926
962 0.30 0.61791
966 0.40 0.65542
970 0.50 0.69146
974 0.60 0.72575
978 0.70 0.75804
982 0.80 0.78814
986 0.90 0.81594
990 1.00 0.84134
994 1.10 0.86433
998 1.20 0.88493
1002 1.30 0.90320
1006 1.40 0.91924
1010 1.50 0.93319
1014 1.60 0.94520
1018 1.70 0.95543
1022 1.80 0.96407
1026 1.90 0.97128
1030 2.00 0.97725
1034 2.10 0.98214
1038 2.20 0.98610
1042 2.30 0.98928
1046 2.40 0.99180
1050 2.50 0.99379
1054 2.60 0.99534
1058 2.70 0.99653
1062 2.80 0.99744
1066 2.90 0.99813
1070 3.00 0.99865
1074 3.10 0.99903
1078 3.20 0.99931
1082 3.30 0.99952
1086 3.40 0.99966
1090 3.50 0.99977
1094 3.60 0.99984
1098 3.70 0.99989
1102 3.80 0.99993
1106 3.90 0.99995
1110 4.00 0.99997
0.90
1.00
Cumulative Probability Function
NORMS.DIST
Mean of distribution 1020
Std Dev of distribution 20
Desired x-value 1044
Calculated z-value 1.20
Prob. of x, or less 0.88493
Equivalent Probability Using Desired
Z Values NORM.DIST x-values
-4.00 0.00003 940
-3.60 0.00016 948
-3.20 0.00069 956
810 -3.50 0.00023 -2.80 0.00256 964
814 -3.40 0.00034 -2.40 0.00820 972
818 -3.30 0.00048 -2.00 0.02275 980
822 -3.20 0.00069 -1.60 0.05480 988
826 -3.10 0.00097 -1.20 0.11507 996
830 -3.00 0.00135 -0.80 0.21186 1004
834 -2.90 0.00187 -0.40 0.34458 1012
838 -2.80 0.00256 0.00 0.50000 1020
842 -2.70 0.00347 0.40 0.65542 1028
846 -2.60 0.00466 0.80 0.78814 1036
850 -2.50 0.00621 1.20 0.88493 1044
854 -2.40 0.00820 1.60 0.94520 1052
858 -2.30 0.01072 2.00 0.97725 1060
862 -2.20 0.01390 2.40 0.99180 1068
866 -2.10 0.01786 2.80 0.99744 1076
870 -2.00 0.02275 3.20 0.99931 1084
874 -1.90 0.02872 3.60 0.99984 1092
878 -1.80 0.03593 4.00 0.99997 1100
882 -1.70 0.04457
886 -1.60 0.05480
890 -1.50 0.06681
-2.80 0.00256 964
-2.40 0.00820 972
-2.00 0.02275 980
-1.60 0.05480 988
-1.20 0.11507 996
Problem 7-19
Supercelluar Battery Life-Reliability
X-value Calculations Given Probabilities Using the Inverse Normal Distribution
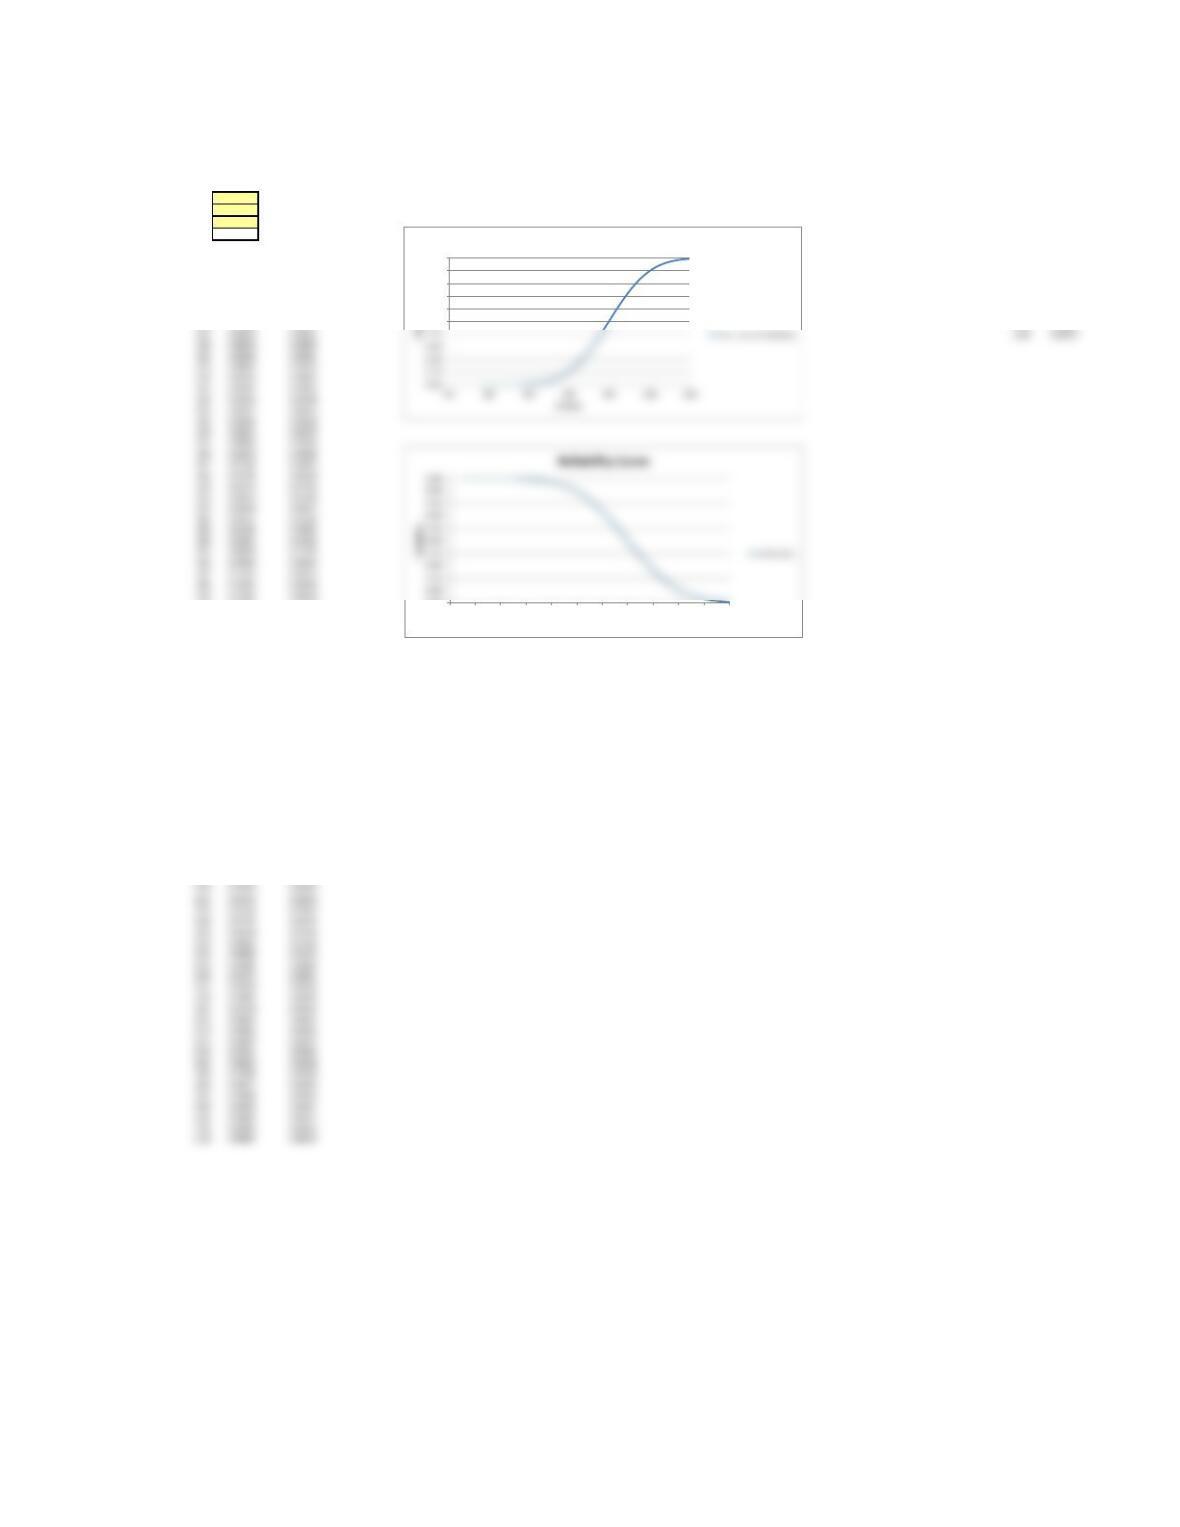
This spreadsheet is designed to calculate the X-value based on probability of values equal to, or less than a desired x value,
of a normally distributed variable. It requires input of a known mean and standard deviation and uses the inverse of the cumulative normal distribution
Enter the mean of the distribution in cell D8 and the standard deviation in cell D9, below.
Enter the desired probability in cell D10, and the calculated x-value will be seen in D11.
950
40
Mean of distribution 0.10
Std Dev of distribution 898.74 Calculated Given
Probability of X or less x-values Probability
Calculated X-Value
Calculated x-values Probability Reliability – 1-P 830 0.00135
790 0.00003 0.99997 870 0.02275
794 0.00005 0.99995 910 0.15866
798 0.00007 0.99993 950 0.50000
802 0.00011 0.99989 990 0.84134
806 0.00016 0.99984 990 0.84134
810 0.00023 0.99977 1070 0.99865
914 0.18406 0.81594
918 0.21186 0.78814
922 0.24196 0.75804
926 0.27425 0.72575
930 0.30854 0.69146
934 0.34458 0.65542
938 0.38209 0.61791
942 0.42074 0.57926
946 0.46017 0.53983
950 0.50000 0.50000
954 0.53983 0.46017
958 0.57926 0.42074
962 0.61791 0.38209
966 0.65542 0.34458
970 0.69146 0.30854
974 0.72575 0.27425
978 0.75804 0.24196
982 0.78814 0.21186
986 0.81594 0.18406
990 0.84134 0.15866
994 0.86433 0.13567
998 0.88493 0.11507
1002 0.90320 0.09680
1006 0.91924 0.08076
1010 0.93319 0.06681
1014 0.94520 0.05480
0.500
0.600
0.700
0.800
0.900
1.000
X-values vs. Cumulative Probability
0.000
775 800 825 850 875 900 925 950 975 1000 1025 1050
Battery Life – Hours
Problem 7-19
Supercelluar Battery Life-Reliability
Z and X-value Calculations Given Probabilites, Using the Inverse Normal Distribution – Template
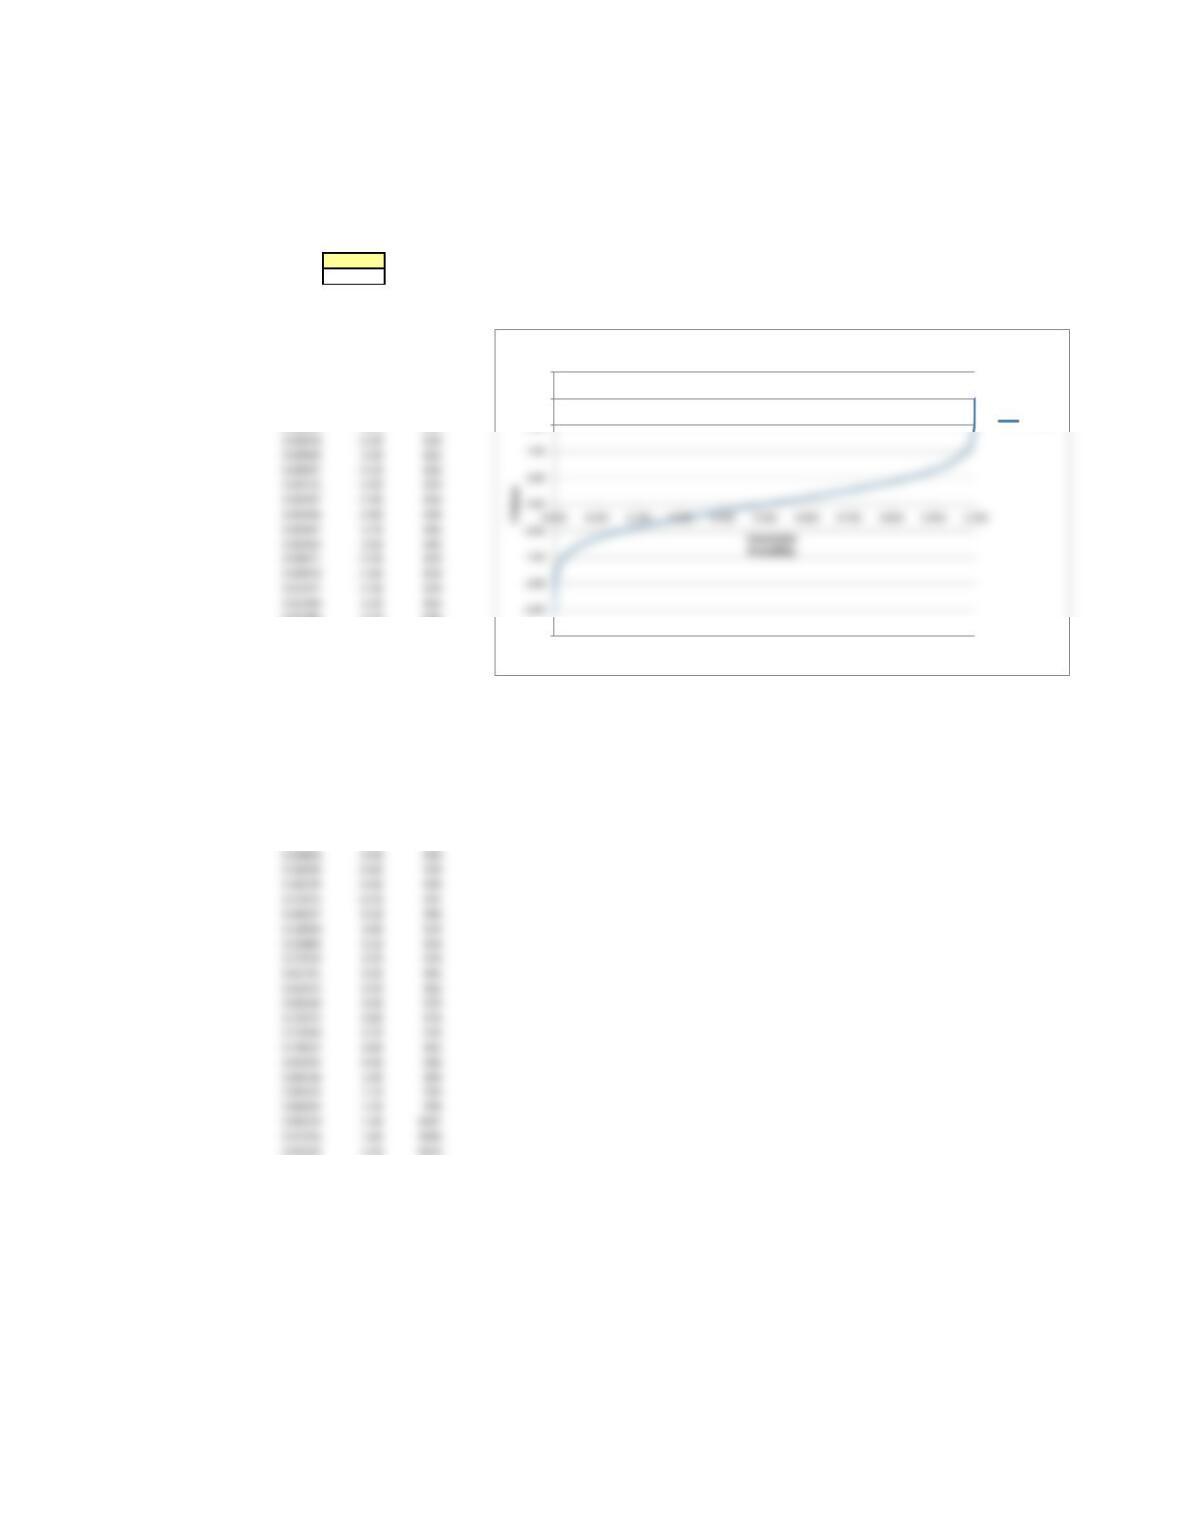
This spreadsheet is designed to calculate the z-value based on probability of values equal to, or less than,
an equivalent x-value of a normally distributed variable. It uses the inverse of the cumulative normal distribution.
Enter the desired probability of the Z-value or less in the shaded cell D8, below.
The calculated z-value will be seen in cell D9.
Probability of x-value, or less 0.10000
Calculated z-value -1.28
Calculated Equivalent
Probability Z Values x-values
0.00003 -4.00 790
0.00005 -3.90 794
0.00007 -3.80 798
0.00011 -3.70 802
0.00016 -3.60 806
0.00023 -3.50 810
0.00034 -3.40 814
0.01786 -2.10 866
0.02275 -2.00 870
0.02872 -1.90 874
0.03593 -1.80 878
0.04457 -1.70 882
0.05480 -1.60 886
0.06681 -1.50 890
0.08076 -1.40 894
0.09680 -1.30 898
0.11507 -1.20 902
0.13567 -1.10 906
0.15866 -1.00 910
0.18406 -0.90 914
0.21186 -0.80 918
0.24196 -0.70 922
0.27425 -0.60 926
0.30854 -0.50 930
0.34458 -0.40 934
0.38209 -0.30 938
0.42074 -0.20 942
0.46017 -0.10 946
0.90320 1.30 1002
0.91924 1.40 1006
0.93319 1.50 1010
0.94520 1.60 1014
0.95543 1.70 1018
0.96407 1.80 1022
0.97128 1.90 1026
0.97725 2.00 1030
0.98214 2.10 1034
0.98610 2.20 1038
0.98928 2.30 1042
0.99180 2.40 1046
0.99379 2.50 1050
0.99534 2.60 1054
0.99653 2.70 1058
0.99744 2.80 1062
0.99813 2.90 1066
0.99865 3.00 1070
0.99903 3.10 1074
0.99931 3.20 1078
-5.00
3.00
4.00
5.00
Z Values vs. Probability
Z Values
0.00048 -3.30 818
0.00069 -3.20 822
0.00097 -3.10 826
0.00135 -3.00 830
0.00187 -2.90 834
0.00256 -2.80 838
0.00347 -2.70 842
0.00466 -2.60 846
0.00621 -2.50 850
0.00820 -2.40 854
0.01072 -2.30 858
0.01390 -2.20 862

0.99952 3.30 1082
0.99966 3.40 1086
0.99977 3.50 1090
0.99989 3.70 1098
0.99993 3.80 1102
0.99995 3.90 1106
0.99997 4.00 1110