
Excel Templates to accompany Operations Management, Eleventh Edition
created by Lee Tangedahl
Copyright © 2012 by The McGraw Hill Companies, Inc. All rights reserved.
Chapter Seven – Work Design and Measurement
Templates: Sample size (B) Solved Problems: Solved Problem 1
Solved Problem 3
(B) – includes Basic template
Problems: Problems 1-13
Lecture Suggestions
Example 2
Example 3
Example 4
See Instructions template for complete instructions.
Normal and Standard Times (B) Solved Problem 2
Sample size for the mean Basic
<Back
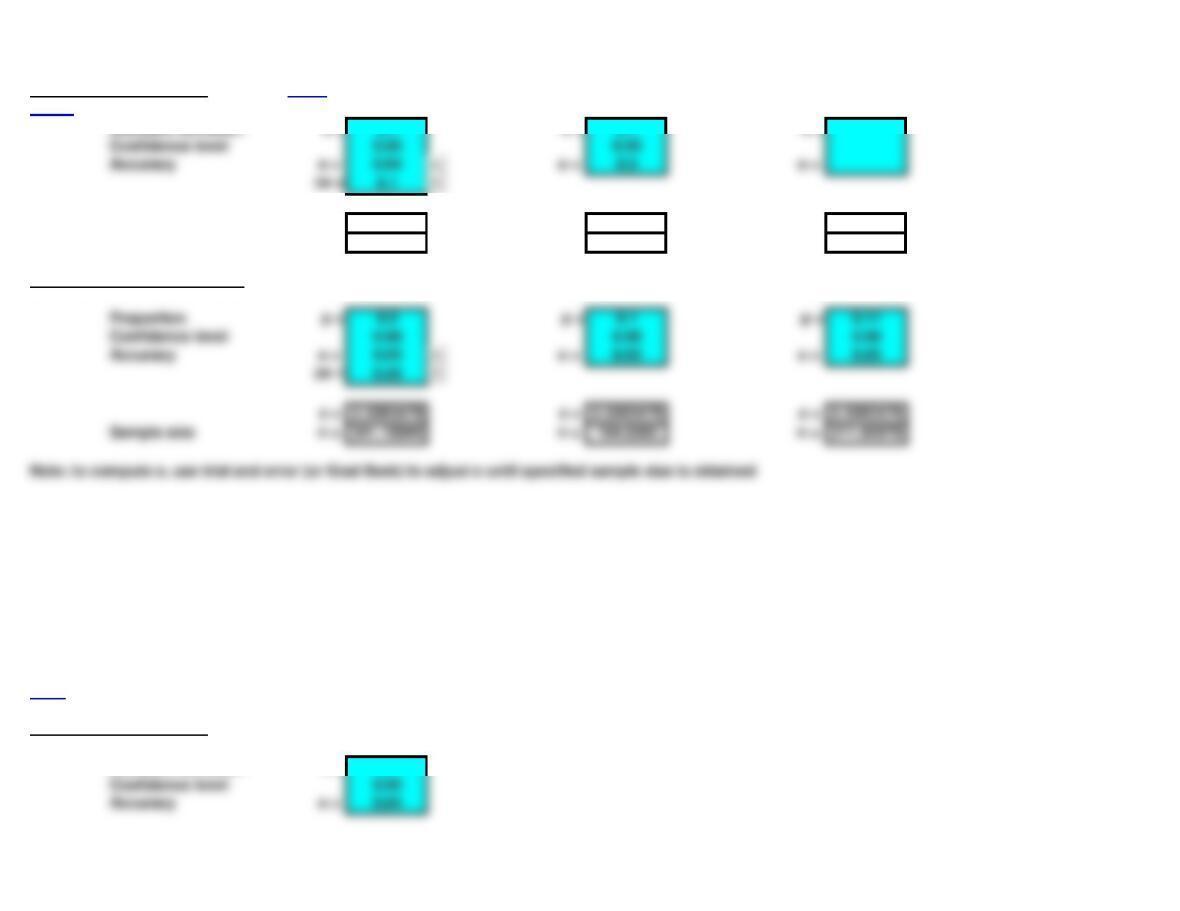
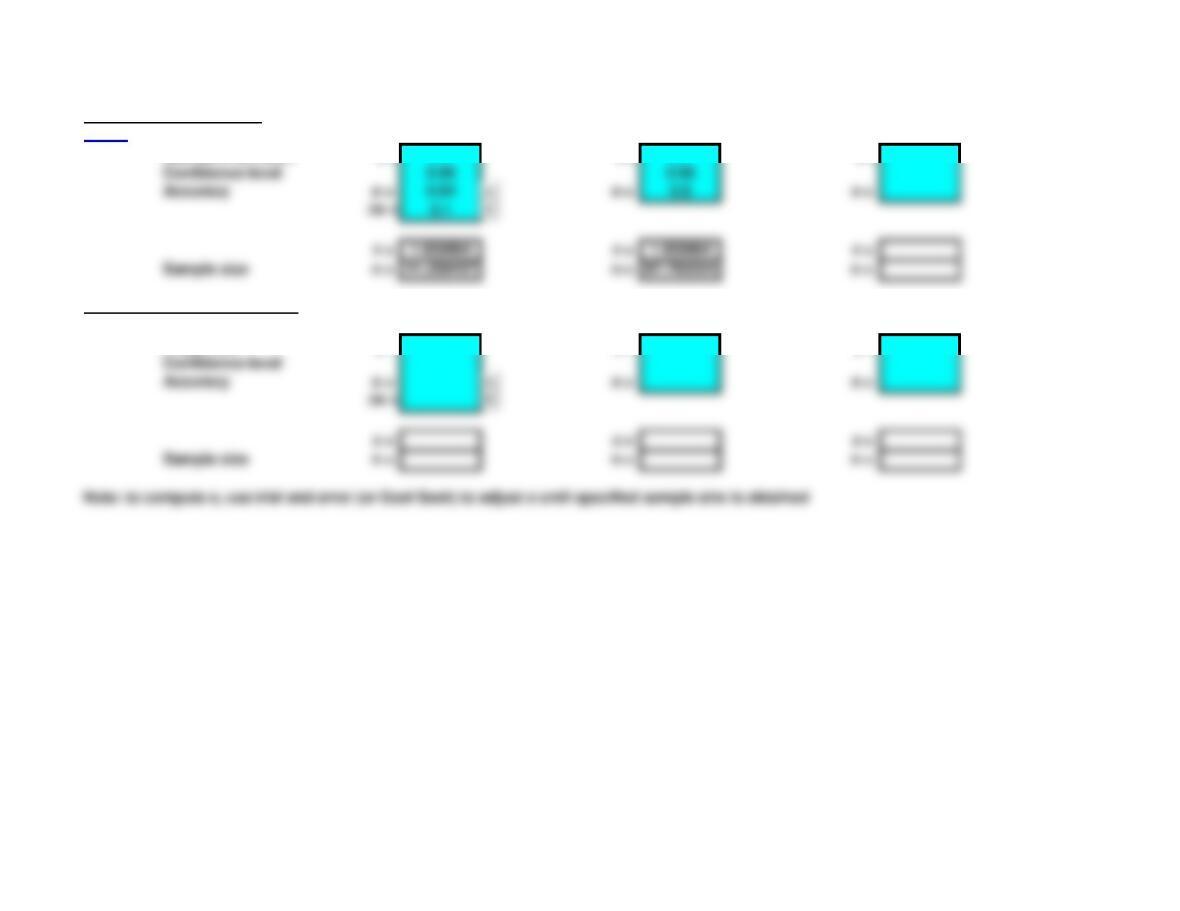
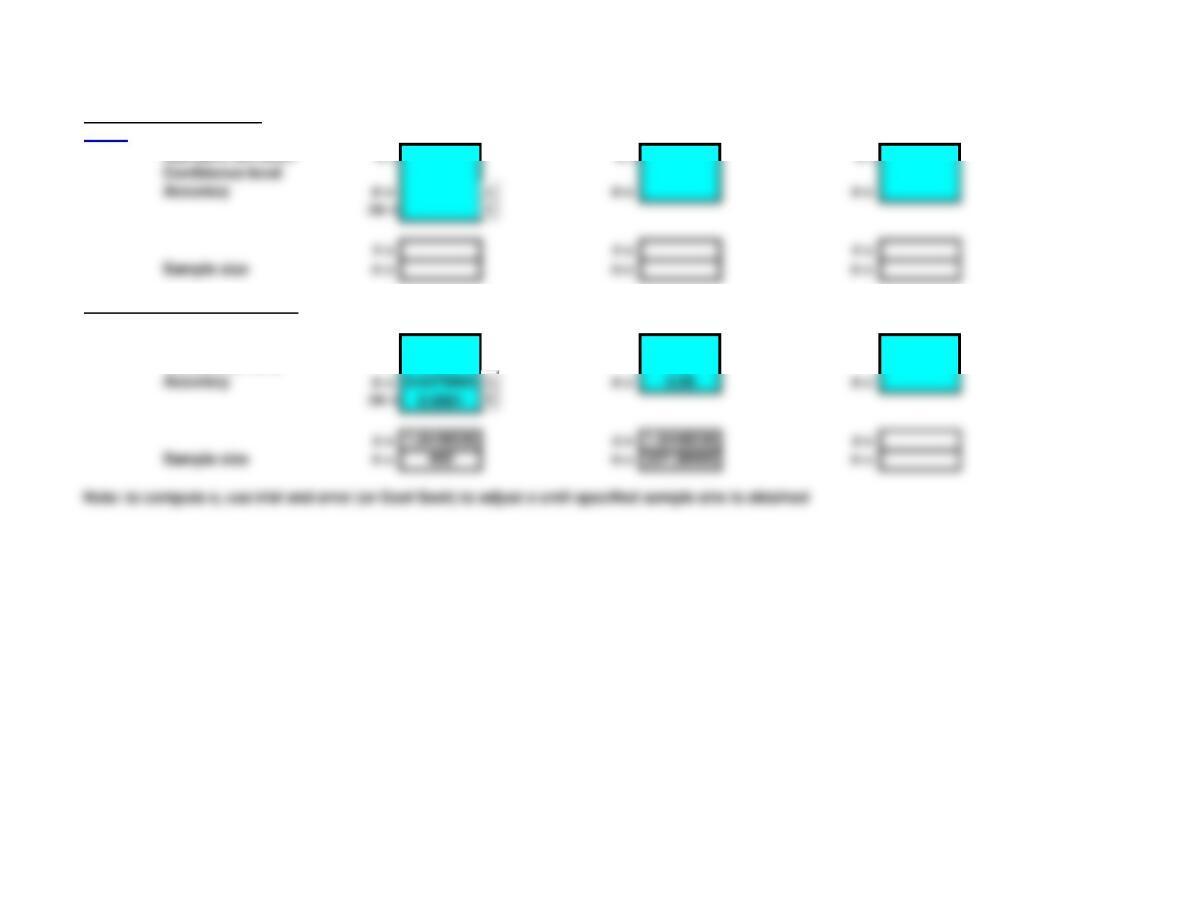
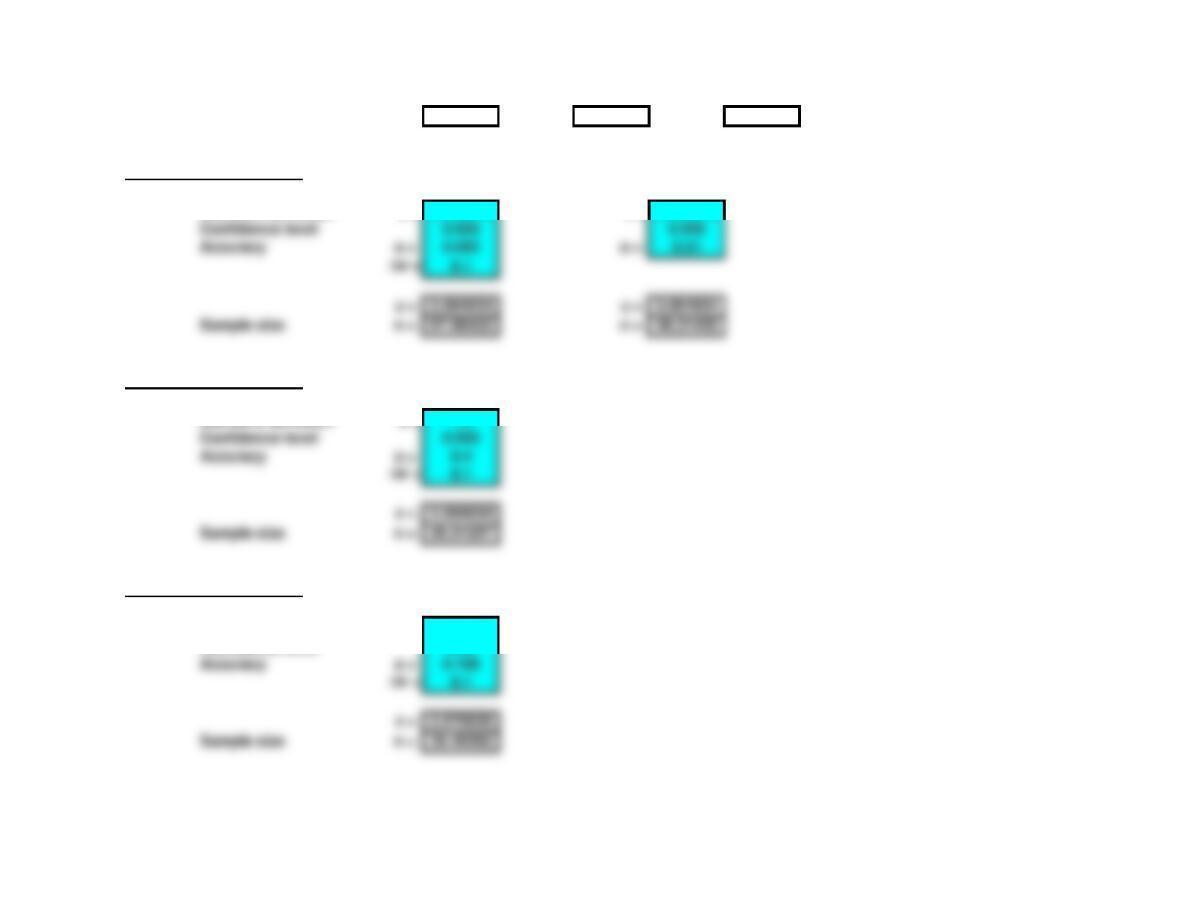
Standard deviation s = 2.1 s = 2.1 s =
z = 1.959964 z = 1.959964 z =
Sample size n = 41.359457 n = 67.763334 n =
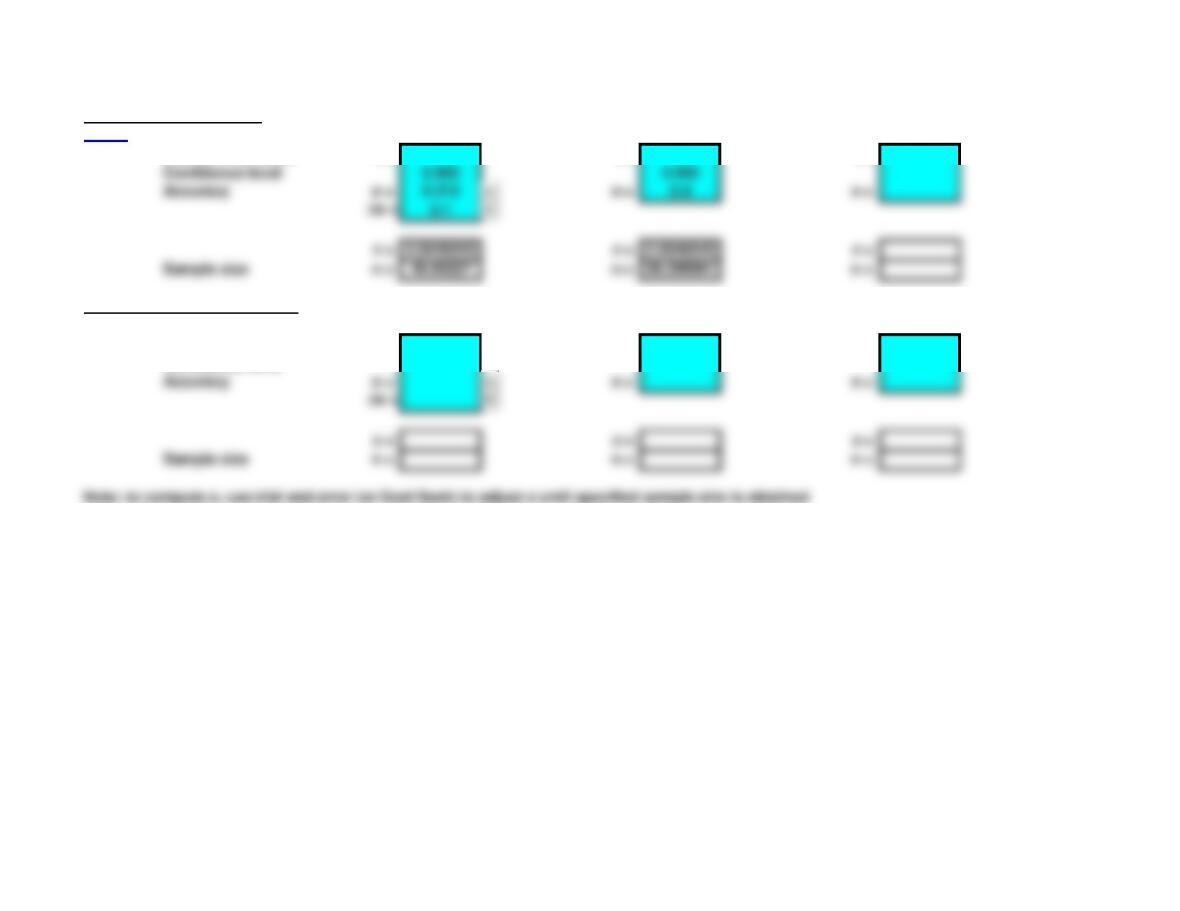
Sample size for the proportion
Proportion p = 0.5 p = 0.1 p = 0.11
Confidence level 0.98 0.98 0.98
Accuracy e = 0.05 e = 0.05 e = 0.05
z = 2.3263479 z = 2.3263479 z = 2.3263479
Sample size n = 541.18944 n = 194.8282 n = 211.92979
Note: to compute e, use trial and error (or Goal Seek) to adjust e until specified sample size is obtained
Basic Template: You can simply copy the basic template below and paste into another worksheet.
^Top
Sample size for the mean
Standard deviation s = 2.1
Confidence level 0.95
Accuracy e = 0.64
Confidence level 0.95 0.95
Accuracy e = 0.64 e = 0.5 e =
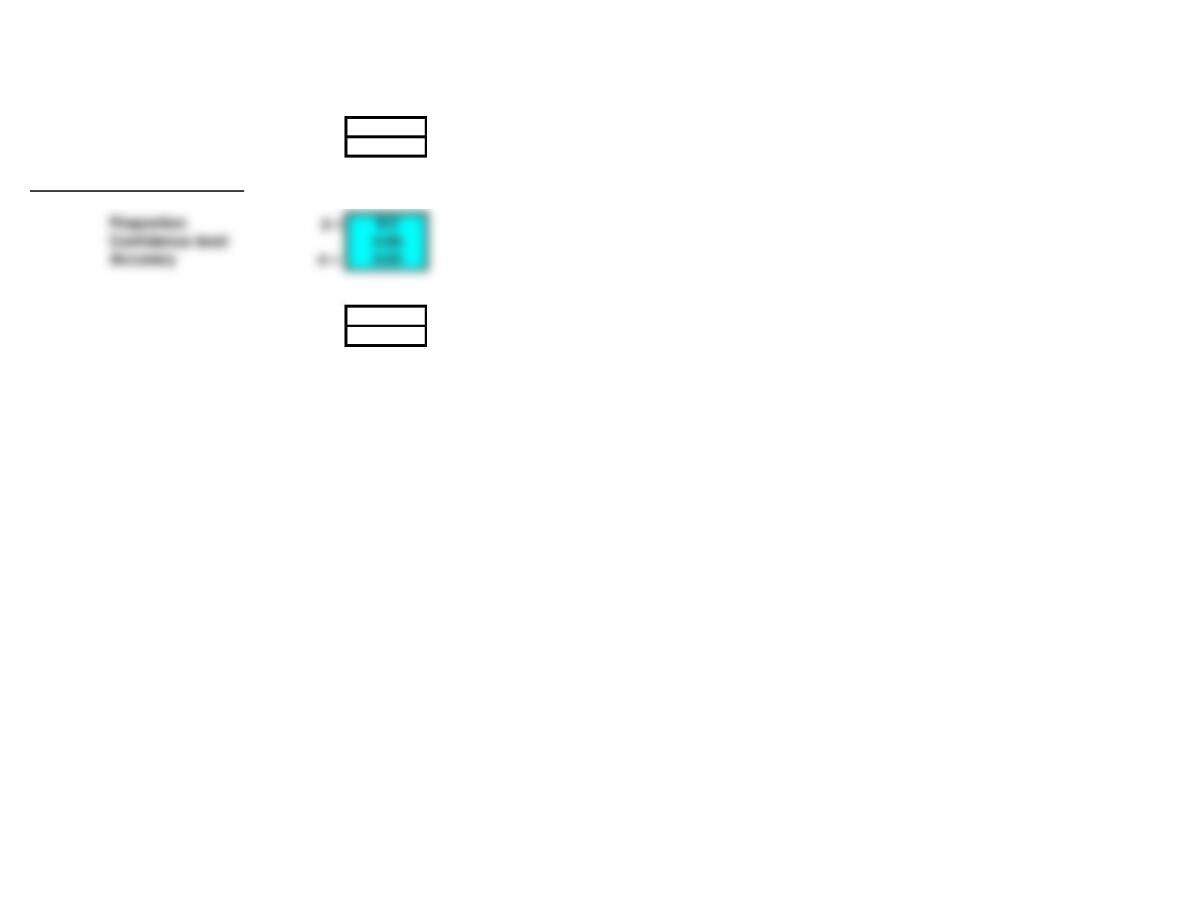
z = 1.959964
Sample size n = 41.359457
Sample size for the proportion
z = 2.3263479
Sample size n = 541.18944
Note: to compute e, use trial and error (or Goal Seek) to adjust e until specified sample size is obtained
Accuracy e = 0.05

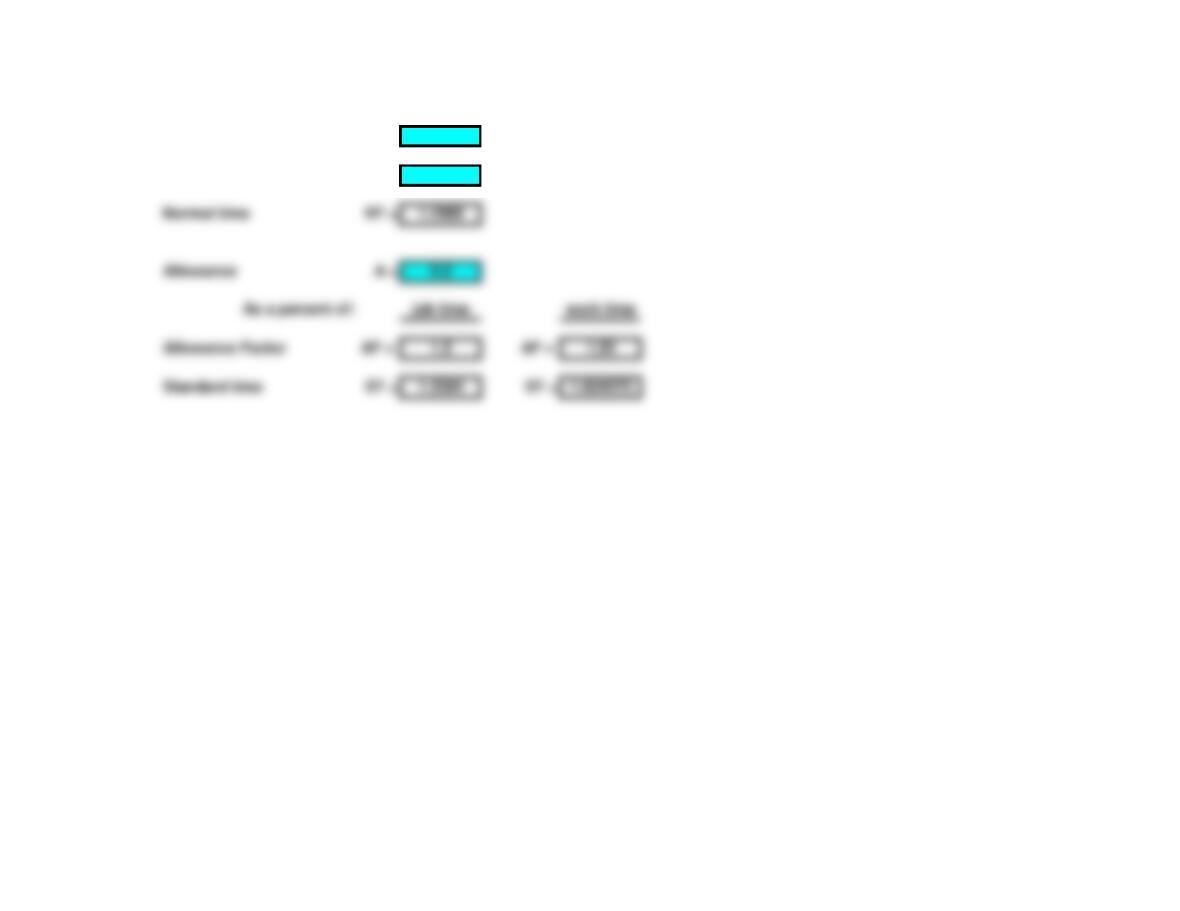
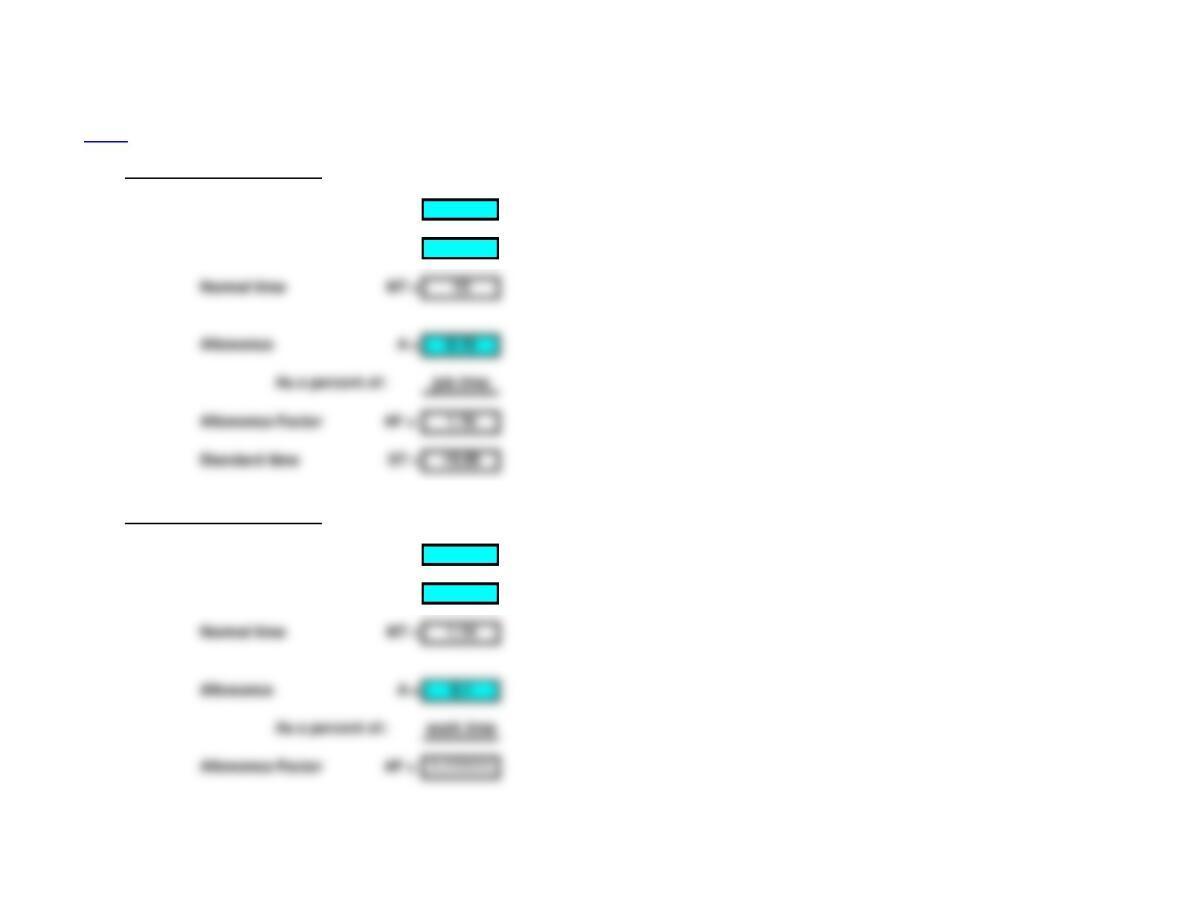
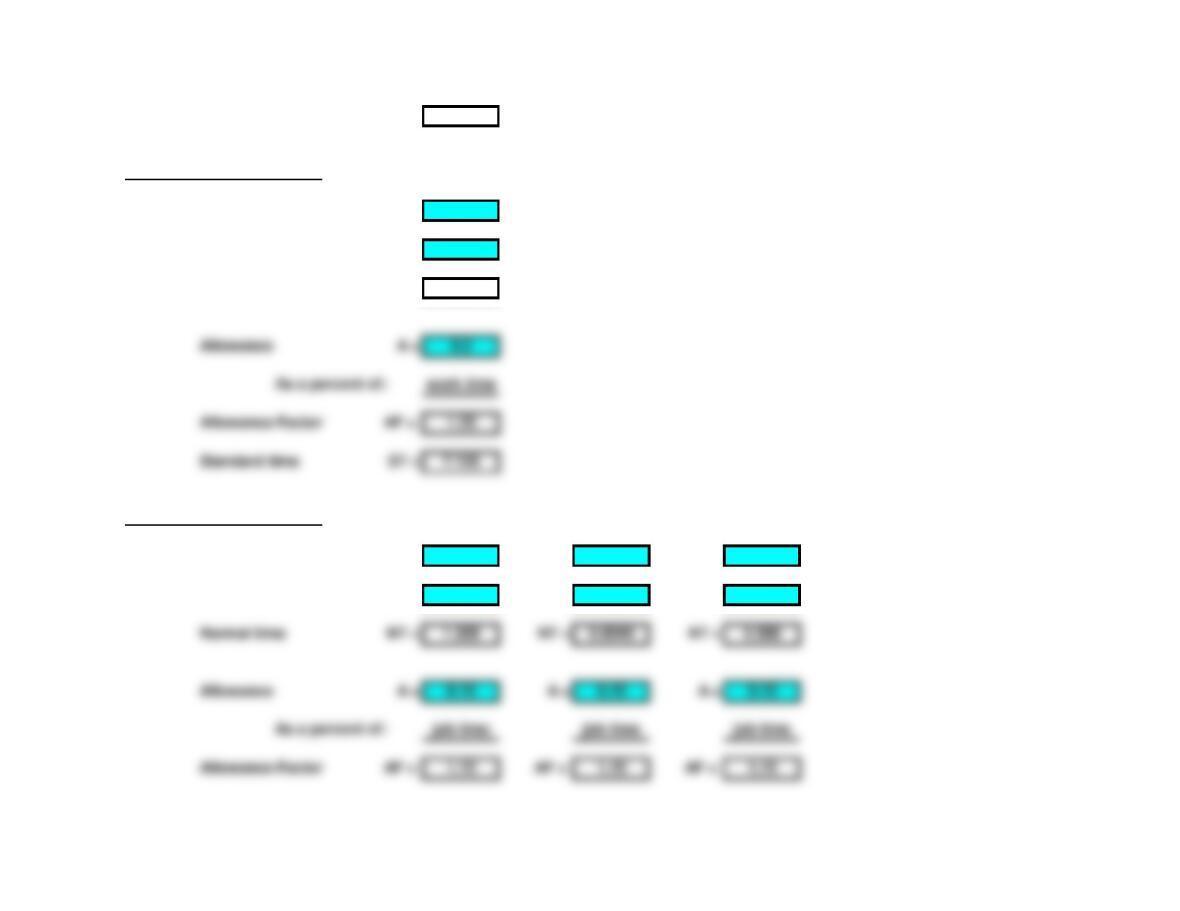
Normal and Standard Times Basic
<Back
Observed time OT = 1.15 OT 1.15
Allowance A = 0.2
As a percent of: job time work time
Allowance Factor AF = 1.2 AF = 1.25
Standard time ST = 1.5594 ST = 1.624375
Basic Template: You can simply copy the basic template below and paste into another worksheet.
^Top
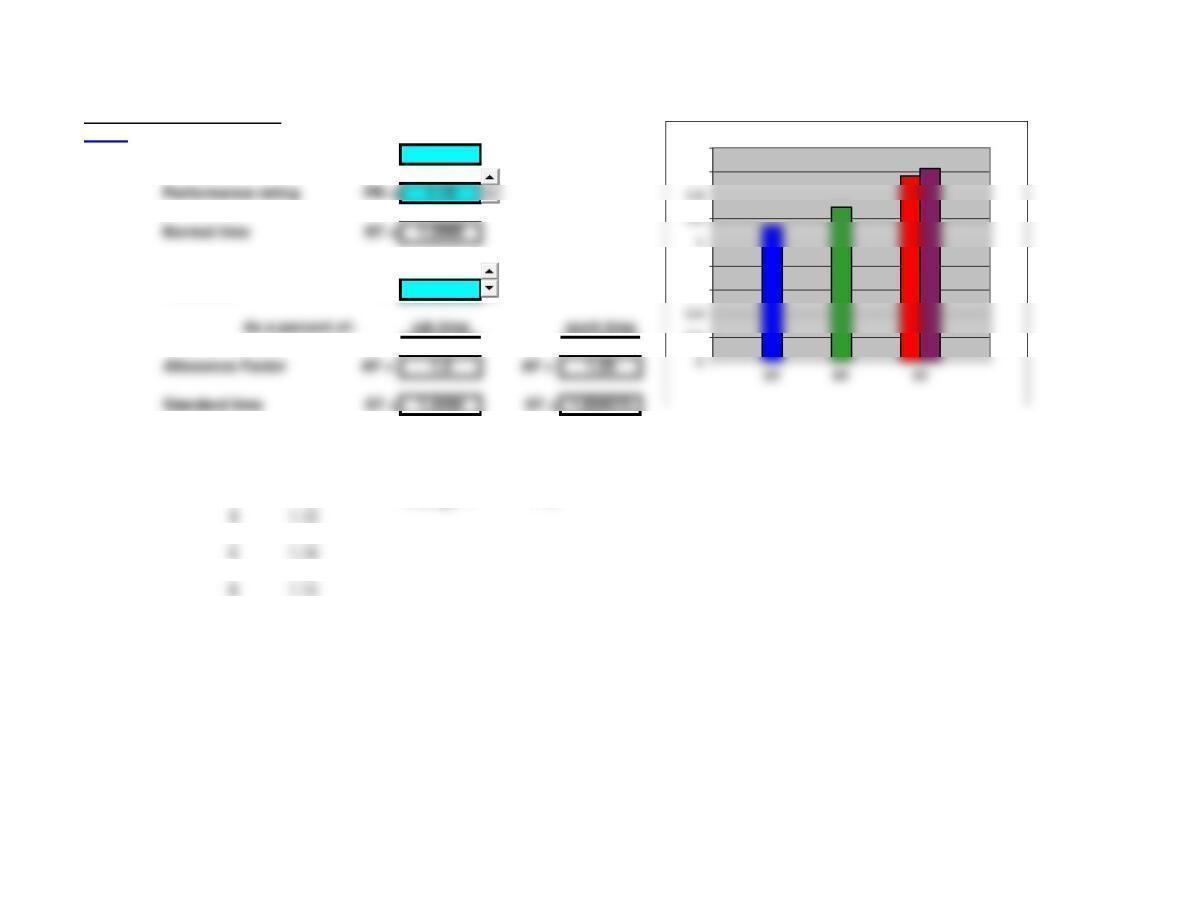
Normal and Standard Times
0.2
0.4
0.6
0.8
1.6
1.8
Performance rating PR = 1.13 ST 1.5594 1.624375
Normal time NT = 1.2995
Observed time OT = 1.15
Performance rating PR = 1.13
Normal time NT = 1.2995
Allowance A = 0.2
Allowance Factor AF = 1.2 AF = 1.25
Standard time ST = 1.5594 ST = 1.624375
Lecture Suggestions – Chapter 7
<Back
Example 1: Sample size for the mean
1. Select the Example 1 worksheet, delete all data.
2. Enter the following data:
3. Part a, find n when desired maximum error is ±10% of sample mean, th4e sample mean is 6.4 (given).
Enter accuracy e= =.1*6.4
4. Part b, find n when desired maximum error is .5 minute.
Enter accuracy e = .5
Standard deviation = 2.1 (given)
Sample size for the mean
<Back
Standard deviation s = 2.1 s = 2.1 s =
Sample size for the proportion
Proportion p = p = p =
Confidence level
Note: to compute e, use trial and error (or Goal Seek) to adjust e until specified sample size is obtained
Confidence level 0.95 0.95

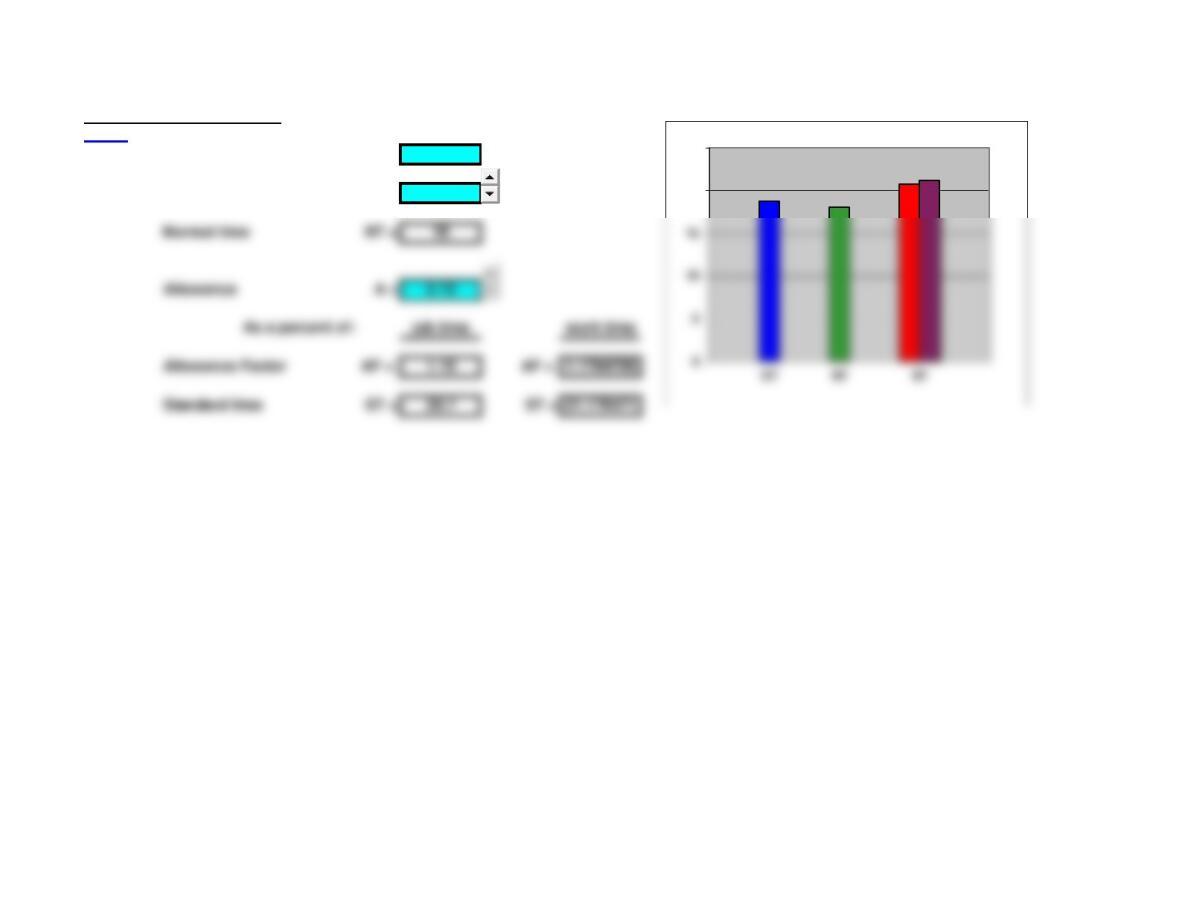
Normal and Standard Times
<Back
Observed time OT = 1.15 OT 1.15
NT 1.2995
Normal time NT = 1.2995
Allowance A = 0.2
As a percent of: job time work time
Allowance Factor AF = 1.2 AF = 1.25
Standard time ST = 1.5594 ST = 1.624375
0.2
0.4
0.6
0.8
1.6
1.8
Performance rating PR = 1.13 ST 1.5594 1.624375
Normal and Standard Times
<Back
Observed time OT = 1.15 OT 1.15
NT 1.2995
Normal time NT = 1.2995
Allowance A = 0.2
Allowance Factor AF = 1.2 AF = 1.25
Standard time ST = 1.5594 ST = 1.624375
11.12
21.15
31.16 Average = 1.15
51.15
71.14
91.19
0.2
0.6
0.8
1.6
1.8
Performance rating PR = 1.13 ST 1.5594 1.624375
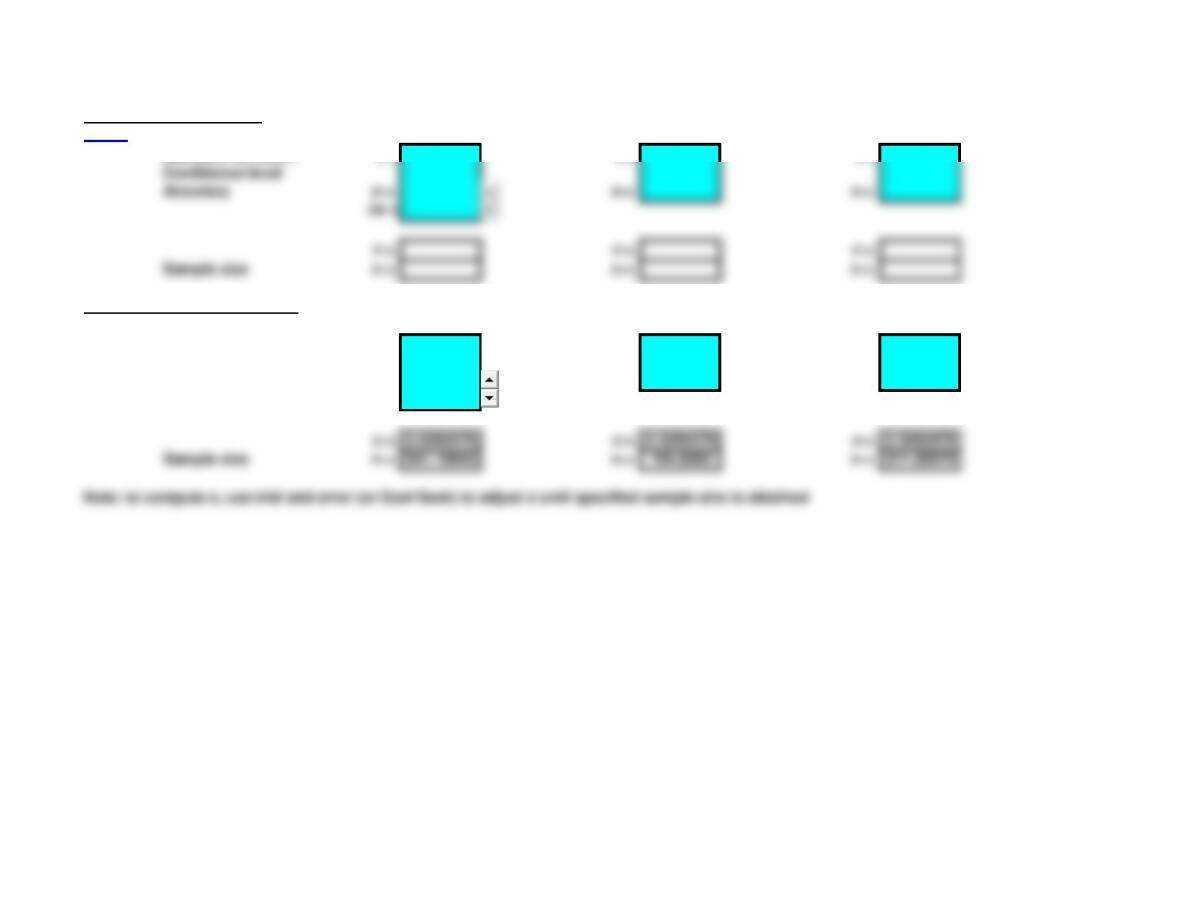
Sample size for the mean
<Back
Standard deviation s = s = s =
Sample size for the proportion
Proportion p = 0.5 p = 0.1 p = 0.11
Confidence level 0.98 0.98 0.98
Accuracy e = 0.05 e = 0.05 e = 0.05
De = 0.05
Sample size n = 541.18944 n = 194.8282 n = 211.92979
Note: to compute e, use trial and error (or Goal Seek) to adjust e until specified sample size is obtained
Confidence level
Accuracy e = e = e =
De =
Sample size n = n = n =
Normal and Standard Times
<Back
Observed time OT = 18.75 OT 18.75
NT 18
Performance rating PR = 0.96 ST 20.7 21.176471
20
25
Normal time NT = 18
Allowance A = 0.15
Allowance Factor AF = 1.15 AF = 1.1764706
Standard time ST = 20.7 ST = 21.176471
Sample size for the mean
<Back
Standard deviation s = 1.1 s = 1.1 s =
Sample size for the proportion
Proportion p = p = p =
Confidence level
Note: to compute e, use trial and error (or Goal Seek) to adjust e until specified sample size is obtained
Confidence level 0.955 0.955
Sample size for the mean
<Back
Standard deviation s = s = s =
Sample size for the proportion
Proportion p = 0.3 p = 0.3 p =
Confidence level 0.9 0.9
Note: to compute e, use trial and error (or Goal Seek) to adjust e until specified sample size is obtained
Confidence level
Chapter 7 – Problems 1-13 Note: This worksheet displays results only, you must copy the shaded
<Back area into the corresponding template to make additional calculations.
1. Normal and Standard Times
Observed time OT = 10.4
Performance rating PR = 1.25
2. Normal and Standard Times
Observed time OT = 1.2
Performance rating PR = 0.95
Normal time NT = 1.14
Allowance A = 0.1
Allowance Factor AF = 1.111111
Normal time NT = 13
Allowance A = 0.16
Allowance Factor AF = 1.16
Standard time ST = 15.08
Standard time ST = 1.266667
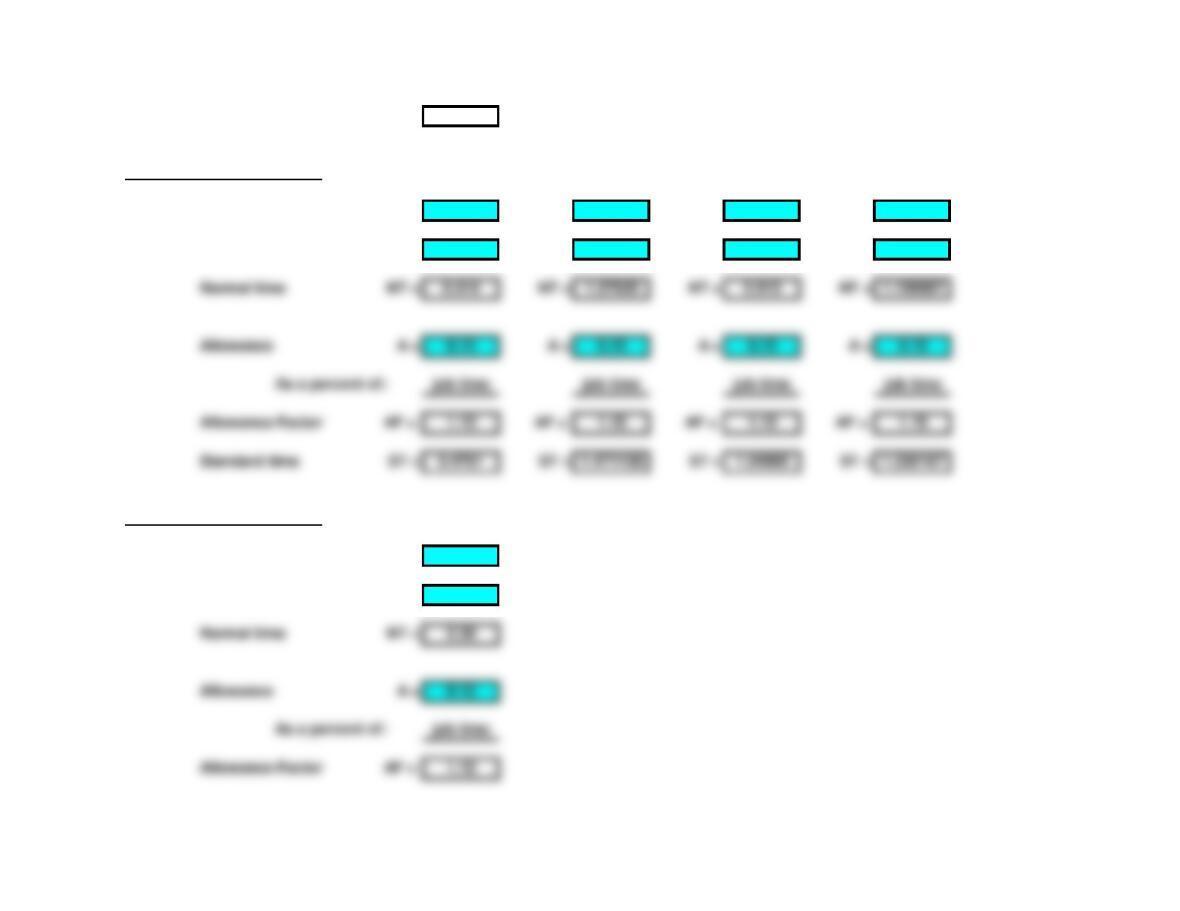
3. Normal and Standard Times
Observed time OT = 0.46 OT = 1.505 OT = 0.83 OT = 1.156667
Performance rating PR = 0.9 PR = 0.85 PR = 1.1 PR = 1
7. Normal and Standard Times
Observed time OT = 1.9
Performance rating PR = 1.2
Normal time NT = 2.28
Allowance A = 0.12
Allowance Factor AF = 1.12
Normal time NT = 0.414 NT = 1.27925 NT = 0.913 NT = 1.156667
Allowance A = 0.15 A = 0.15 A = 0.15 A = 0.15
Allowance Factor AF = 1.15 AF = 1.15 AF = 1.15 AF = 1.15
Standard time ST = 0.4761 ST = 1.471138 ST = 1.04995 ST = 1.330167
Standard time ST = 2.5536
8. Normal and Standard Times
Observed time OT = 6
Performance rating PR = 0.95
Normal time NT = 5.7
9a. Normal and Standard Times
Observed time OT = 1.19 OT = 0.83 OT = 0.56
Performance rating PR = 1.1 PR = 1.15 PR = 1.05
Normal time NT = 1.309 NT = 0.9545 NT = 0.588
Allowance A = 0.15 A = 0.15 A = 0.15
Allowance Factor AF = 1.15 AF = 1.15 AF = 1.15
Allowance A = 0.2
Allowance Factor AF = 1.25
Standard time ST = 7.125
Standard time ST = 1.50535 ST = 1.097675 ST = 0.6762
9b,c. Sample size for the mean
Standard deviation s = 0.033912 s = 0.033912
10. Sample size for the mean
Standard deviation s = 1.5
Confidence level 0.955
Accuracy e = 0.4
Sample size n = 56.51207
11. Sample size for the mean
Standard deviation s = 0.252982
Confidence level 0.99
Accuracy e = 0.108
Sample size n = 36.40562
Confidence level 0.955 0.955
Accuracy e = 0.083 e = 0.01
Sample size n = 67.08422 n = 46.21432

12. Sample size for the proportion
Proportion p = 0.12
13. Sample size for the proportion
Proportion p = 0.5
Confidence level 0.98
Accuracy e = 0.06
De = 0.0001
Confidence level 0.95
Accuracy e = 0.05
De = 0.0001