Problem 7-21
Livelong, Inc. Computer Monitors
Exponential Probability Distribution Template
Enter data only in yellow-shaded cells.
Failure rate per hour (λ) = 0.00095
Hours 5000
Calculated probability 0.991348
T = x Cum. Failure
Hours Probability F(x)
0 0.000000
250 0.211403
500 0.378115
3250 0.954384
3500 0.964027
3750 0.971632
4000 0.977629
4250 0.982358
4500 0.986088
4750 0.989029
5000 0.991348
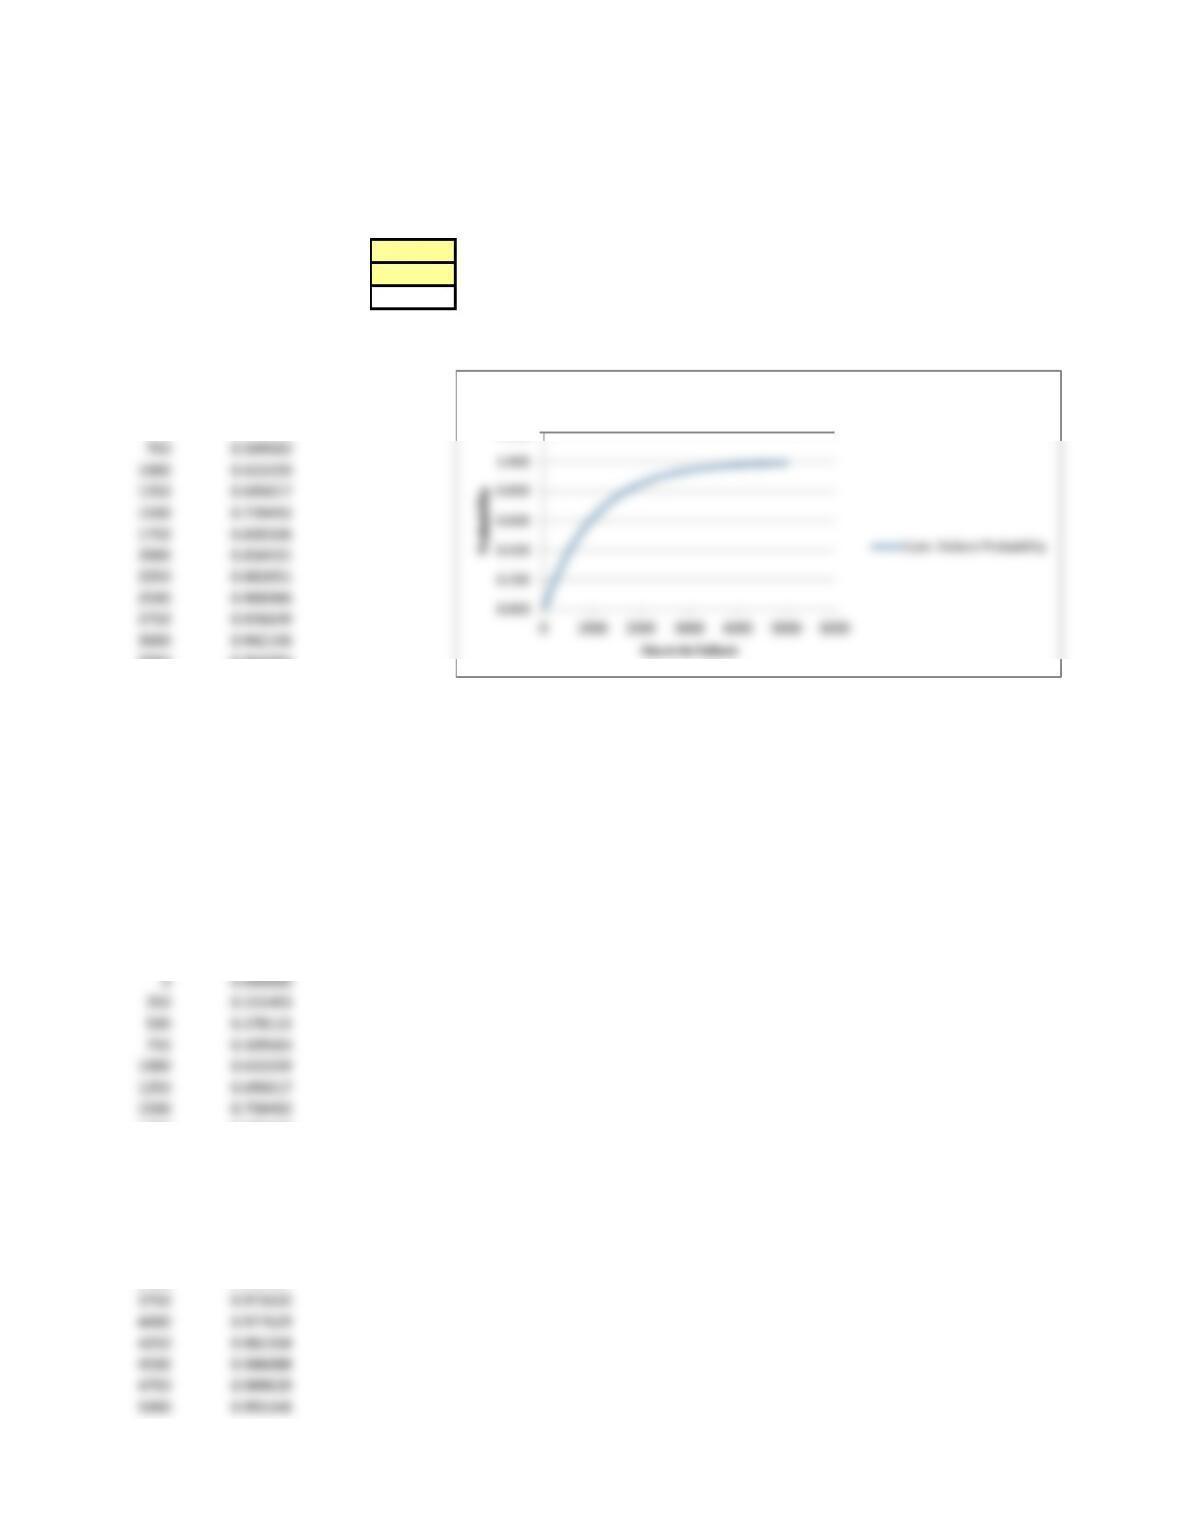
Table for chart construction
T = x Cum. Failure
Hours Probability
250 0.211403
500 0.378115
750 0.509583
1000 0.613259
1250 0.695017
1500 0.759492
1750 0.810336
2000 0.850431
2250 0.882051
2500 0.906986
2750 0.926649
3000 0.942156
3250 0.954384
3500 0.964027
3750 0.971632
4000 0.977629
4250 0.982358
4500 0.986088
4750 0.989029
5000 0.991348
1.200
Cumulative Failure Probability
750 0.509583
1000 0.613259
1250 0.695017
1500 0.759492
1750 0.810336
2000 0.850431
2250 0.882051
2500 0.906986
2750 0.926649
3000 0.942156