
Problem 6-6 Kiwi Oil, Inc
Probability Calculations Using the Normal Distribution – Template
Enter data only in the shaded cells
This spreadsheet is designed to calculate the probability of values equal to, or less than, a desired x value,
given the mean and standard deviation of a normally distributed variable. It uses the cumulative normal distribution
Enter the mean of the distribution in shaded cell D8 and the standard deviation in shaded cell D9. below.
Enter the desired X-value in shaded cell D10, below. The calculated z-value and probability will be seen in D11 and D12.
Mean of distribution 920 NORMAL PROBABILITY CALCULATIONS
Std deviation of distribution 12
Desired x-value 950 Mean of distribution 1020
Calculated z-value 2.50 Std Dev of distribution 20
Probability of x, or less 0.99379 Desired x-value 1044
Calculated z-value 1.20
(X-axis) Probability Using Prob. of x, or less 0.88493
Desired x-values Equivalent – Z Values NORMS.DIST
880 -3.33 0.00043 Equivalent Probability Using Desired
881 -3.25 0.00058 Z Values NORM.DIST x-values
882 -3.17 0.00077 -4.00 0.00003 940
883 -3.08 0.00102 -3.60 0.00016 948
884 -3.00 0.00135 -3.20 0.00069 956
885 -2.92 0.00177 -2.80 0.00256 964
886 -2.83 0.00230 -2.40 0.00820 972
887 -2.75 0.00298 -2.00 0.02275 980
888 -2.67 0.00383 -1.60 0.05480 988
889 -2.58 0.00489 -1.20 0.11507 996
890 -2.50 0.00621 -0.80 0.21186 1004
920 0.00 0.50000
921 0.08 0.53321
922 0.17 0.56618
923 0.25 0.59871
924 0.33 0.63056
925 0.42 0.66154
926 0.50 0.69146
927 0.58 0.72017
928 0.67 0.74751
929 0.75 0.77337
930 0.83 0.79767
931 0.92 0.82034
932 1.00 0.84134
933 1.08 0.86067
934 1.17 0.87833
935 1.25 0.89435
936 1.33 0.90879
937 1.42 0.92171
938 1.50 0.93319
939 1.58 0.94333
940 1.67 0.95221
941 1.75 0.95994
942 1.83 0.96662
943 1.92 0.97236
944 2.00 0.97725
945 2.08 0.98139
946 2.17 0.98487
947 2.25 0.98778
948 2.33 0.99018
949 2.42 0.99217
950 2.50 0.99379
951 2.58 0.99511
952 2.67 0.99617
953 2.75 0.99702
954 2.83 0.99770
955 2.92 0.99823
956 3.00 0.99865
957 3.08 0.99898
958 3.17 0.99923
959 3.25 0.99942
960 3.33 0.99957
0.50
0.60
0.70
0.80
0.90
1.00
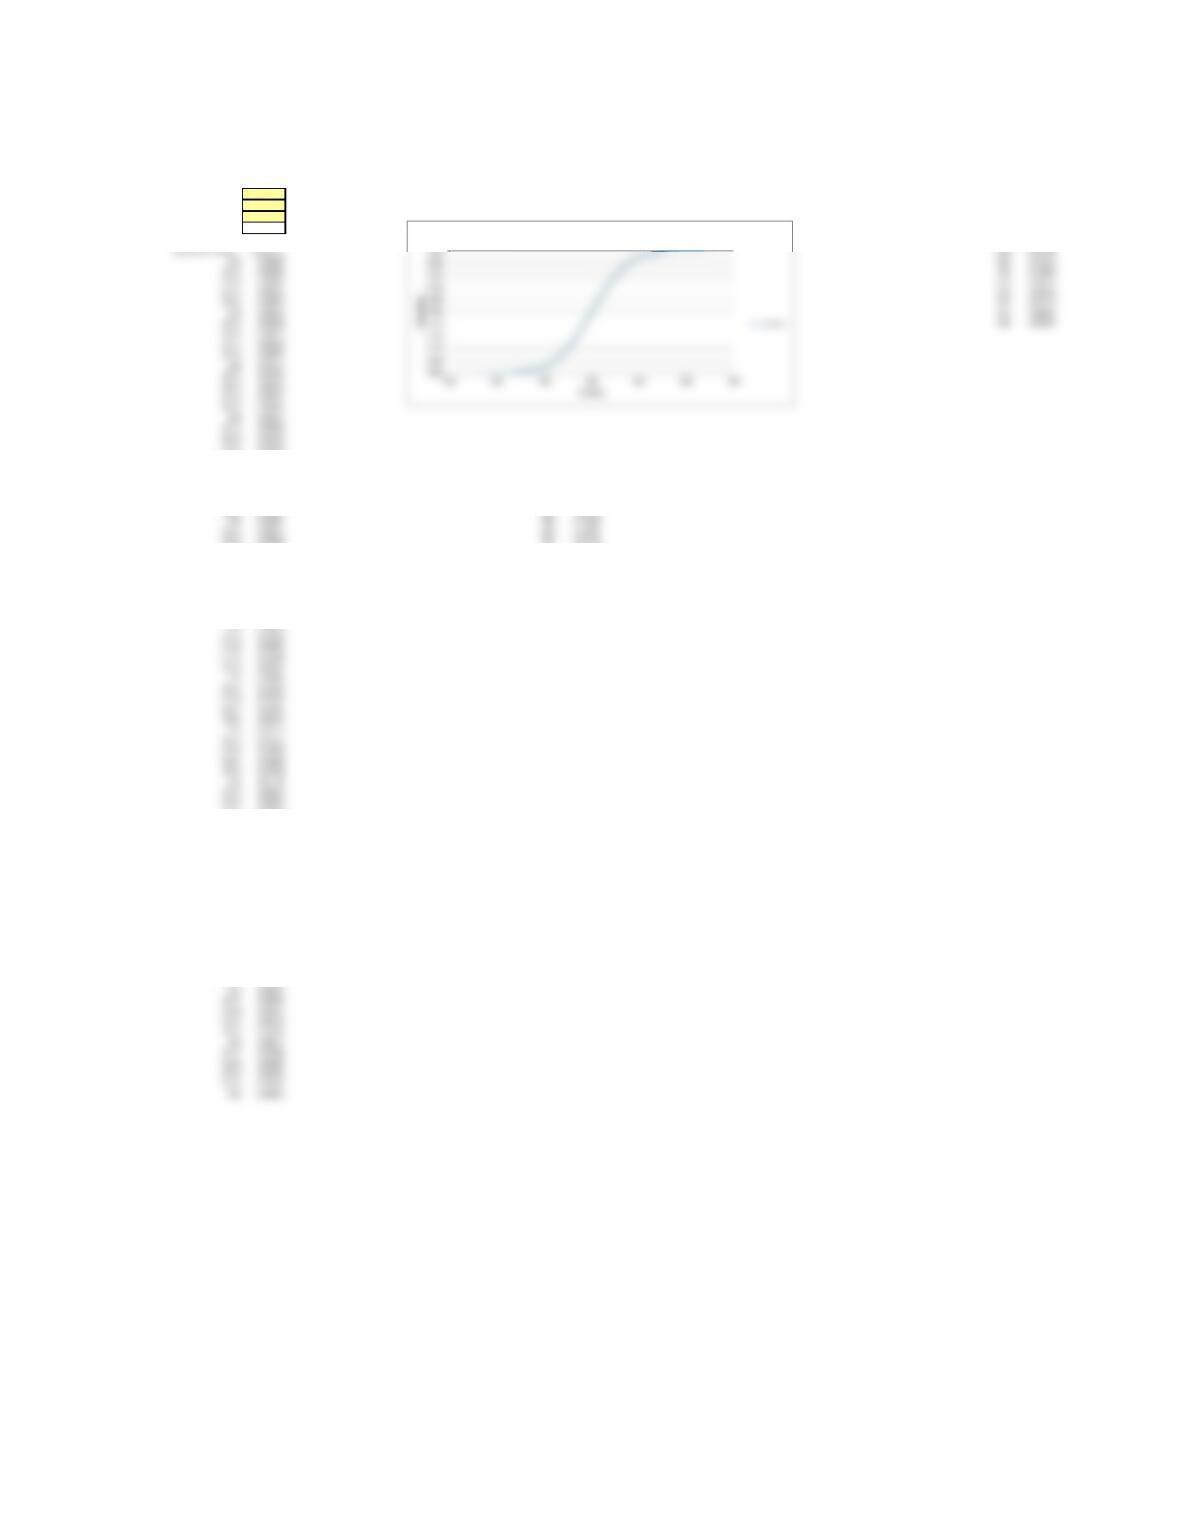
Cumulative Probability Function
NORMS.DIST
Mean of distribution 1020
Std Dev of distribution 20
Desired x-value 1044
Calculated z-value 1.20
Prob. of x, or less 0.88493
Equivalent Probability Using Desired
Z Values NORM.DIST x-values
-4.00 0.00003 940
-3.60 0.00016 948
-3.20 0.00069 956
-2.80 0.00256 964
-2.40 0.00820 972
-2.00 0.02275 980
-1.60 0.05480 988
-1.20 0.11507 996
-0.80 0.21186 1004
891 -2.42 0.00783 -0.40 0.34458 1012
892 -2.33 0.00982 0.00 0.50000 1020
893 -2.25 0.01222 0.40 0.65542 1028
894 -2.17 0.01513 0.80 0.78814 1036
895 -2.08 0.01861 1.20 0.88493 1044
896 -2.00 0.02275 1.60 0.94520 1052
897 -1.92 0.02764 2.00 0.97725 1060
898 -1.83 0.03338 2.40 0.99180 1068
899 -1.75 0.04006 2.80 0.99744 1076
900 -1.67 0.04779 3.20 0.99931 1084
901 -1.58 0.05667 3.60 0.99984 1092
902 -1.50 0.06681 4.00 0.99997 1100
903 -1.42 0.07829
904 -1.33 0.09121
905 -1.25 0.10565
906 -1.17 0.12167
907 -1.08 0.13933
908 -1.00 0.15866
909 -0.92 0.17966
910 -0.83 0.20233
911 -0.75 0.22663
912 -0.67 0.25249
913 -0.58 0.27983
914 -0.50 0.30854
915 -0.42 0.33846
916 -0.33 0.36944
917 -0.25 0.40129
918 -0.17 0.43382
919 -0.08 0.46679
-0.40 0.34458 1012
Problem 6-6 Kiwi Oil, Inc
X-value Calculations Given Probabilities Using the Inverse Normal Distribution – Template
This spreadsheet is designed to calculate the X-value based on probability of values equal to, or less than a desired x value,
of a normally distributed variable. It requires input of a known mean and standard deviation and uses the inverse of the cumulative normal distribution
Enter the mean of the distribution in cell D9 and the standard deviation in cell D10, below. Enter the desired probability in cell D11, and the calculated x-value will be seen in D12.
Mean of distribution 920
Std Dev of distribution 12
Probability of X or less 0.9938
Calculated X-Value 950.01 Calculated Given
x-values Probability
893.6 0.01390
894.8 0.01786
896 0.02275 Truncated
897.2 0.02872 x-values Probability
898.4 0.03593 872 0.00003
899.6 0.04457 884 0.00135
900.8 0.05480 896 0.02275
904.4 0.09680 932 0.84134
905.6 0.11507 944 0.97725
906.8 0.13567 956 0.99865
908 0.15866 968 0.99997
909.2 0.18406
910.4 0.21186
911.6 0.24196
912.8 0.27425
914 0.30854
935.6 0.90320
936.8 0.91924
938 0.93319
939.2 0.94520
940.4 0.95543
941.6 0.96407
942.8 0.97128
944 0.97725
945.2 0.98214
946.4 0.98610
947.6 0.98928
948.8 0.99180
950 0.99379
951.2 0.99534
952.4 0.99653
953.6 0.99744
954.8 0.99813
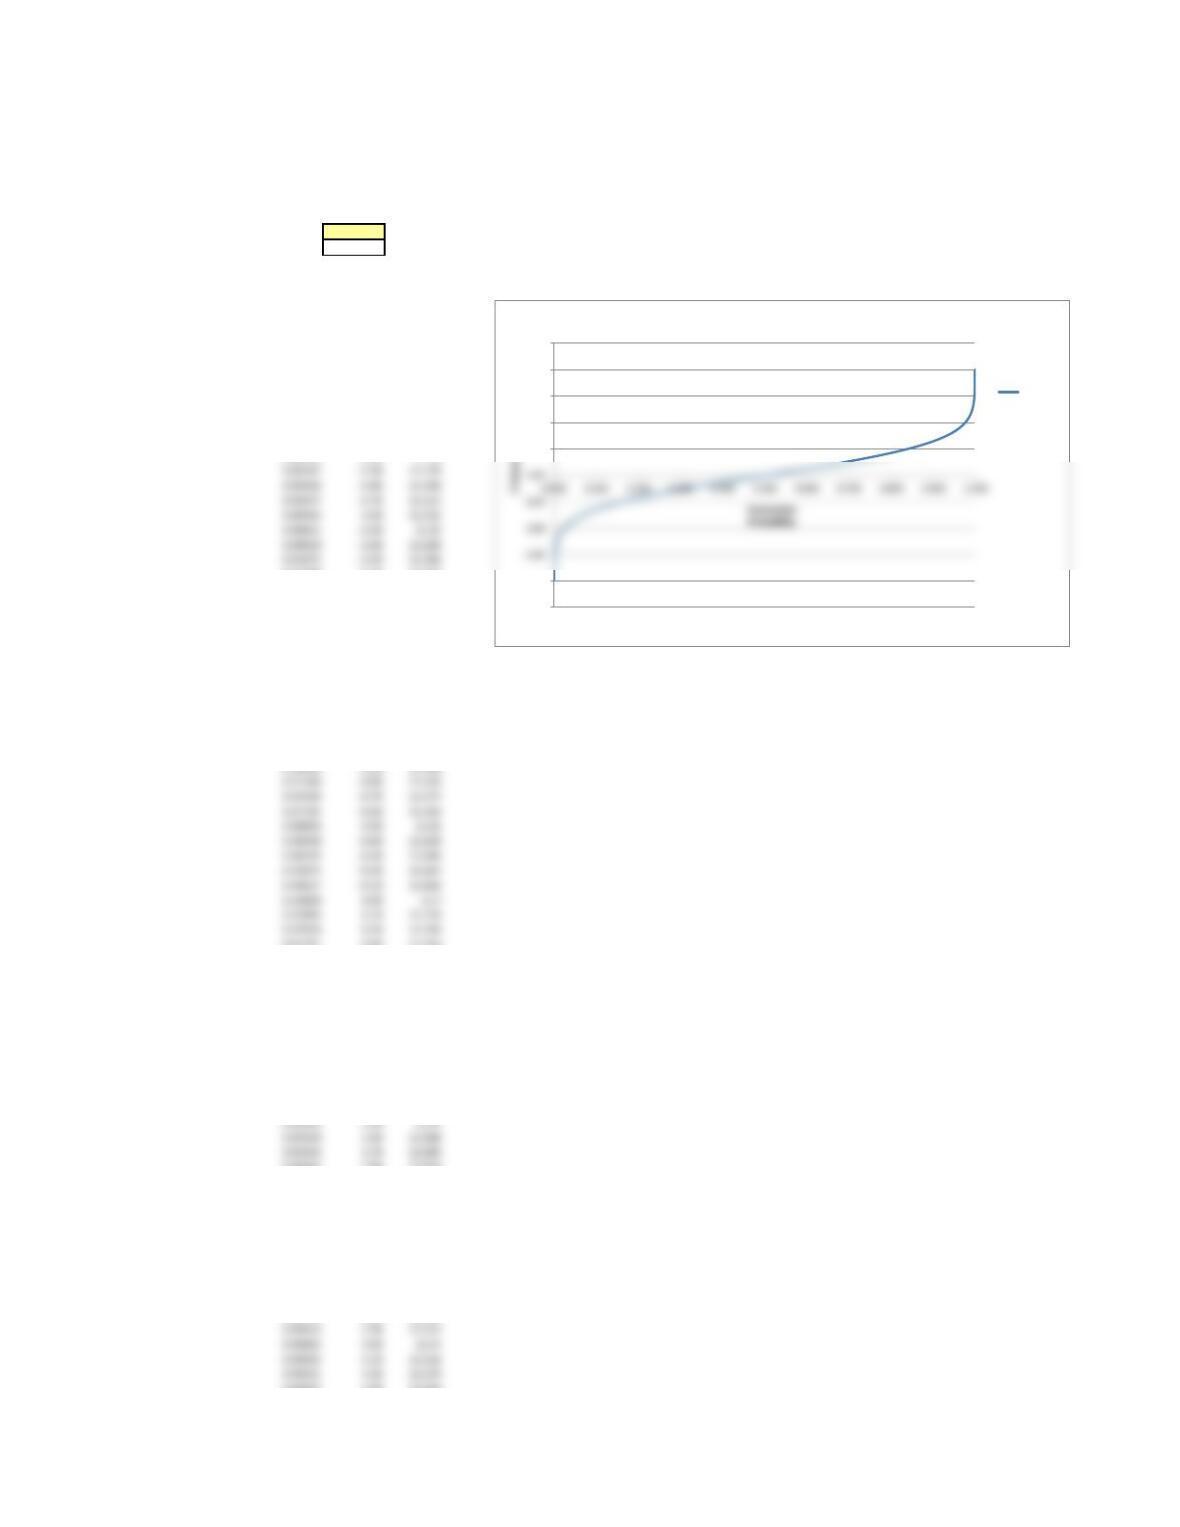
X-values vs. Cumulative Probability
Problem 6-6 Kiwi Oil, Inc
Z and X-value Calculations Given Probabilites, Using the Inverse Normal Distribution – Template
This spreadsheet is designed to calculate the z-value based on probability of values equal to, or less than,
an equivalent x-value of a normally distributed variable. It uses the inverse of the cumulative normal distribution.
Enter the desired probability of the Z-value or less in the shaded cell D9, below. The calculated z-value will be seen in cell D10.
0.99379
2.50
Probability of x-value, or less
Calculated z-value Calculated Equivalent
Probability Z Values x-values
0.00003 -4.00 10.98
0.00005 -3.90 10.998
0.00007 -3.80 11.016
0.00011 -3.70 11.034
0.00016 -3.60 11.052
0.00023 -3.50 11.07
0.00034 -3.40 11.088
0.00048 -3.30 11.106
0.00069 -3.20 11.124
0.00097 -3.10 11.142
0.00135 -3.00 11.16
0.01390 -2.20 11.304
0.01786 -2.10 11.322
0.02275 -2.00 11.34
0.02872 -1.90 11.358
0.03593 -1.80 11.376
0.04457 -1.70 11.394
0.05480 -1.60 11.412
0.06681 -1.50 11.43
0.08076 -1.40 11.448
0.09680 -1.30 11.466
0.11507 -1.20 11.484
0.13567 -1.10 11.502
0.15866 -1.00 11.52
0.18406 -0.90 11.538
0.21186 -0.80 11.556
0.24196 -0.70 11.574
0.27425 -0.60 11.592
0.30854 -0.50 11.61
0.34458 -0.40 11.628
0.38209 -0.30 11.646
0.42074 -0.20 11.664
0.46017 -0.10 11.682
0.53983 0.10 11.718
0.57926 0.20 11.736
0.61791 0.30 11.754
0.65542 0.40 11.772
0.69146 0.50 11.79
0.72575 0.60 11.808
0.75804 0.70 11.826
0.78814 0.80 11.844
0.81594 0.90 11.862
0.84134 1.00 11.88
0.86433 1.10 11.898
0.88493 1.20 11.916
0.90320 1.30 11.934
0.91924 1.40 11.952
0.93319 1.50 11.97
0.94520 1.60 11.988
0.95543 1.70 12.006
0.96407 1.80 12.024
0.97128 1.90 12.042
0.97725 2.00 12.06
0.98214 2.10 12.078
0.98610 2.20 12.096
0.98928 2.30 12.114
0.99180 2.40 12.132
0.99379 2.50 12.15
0.99534 2.60 12.168
0.99653 2.70 12.186
0.99744 2.80 12.204
0.99865 3.00 12.24
0.99903 3.10 12.258
0.99931 3.20 12.276
0.99952 3.30 12.294
0.99966 3.40 12.312
-5.00
-4.00
1.00
2.00
3.00
4.00
5.00
Z Values vs. Probability
Z Values
0.00187 -2.90 11.178
0.00256 -2.80 11.196
0.00347 -2.70 11.214
0.00466 -2.60 11.232
0.00621 -2.50 11.25
0.00820 -2.40 11.268
0.01072 -2.30 11.286

0.99977 3.50 12.33
0.99984 3.60 12.348
0.99989 3.70 12.366
0.99995 3.90 12.402
0.99997 4.00 12.42