
Problem 5 – Instructor Reserve
Tio Anciano
Z and X-value Calculations Given Probabilites, Using the Inverse Normal Distribution – Template
This spreadsheet is designed to calculate the z-value based on probability of values equal to, or less than,
an equivalent x-value of a normally distributed variable. It uses the inverse of the cumulative normal distribution.
Enter the desired probability of the Z-value or less in the shaded cell D8, below.
The calculated z-value will be seen in cell D9.
Calculated
Equivalent
Probability Z Values x-values
0.00003 -4.00 929.46
0.00005 -3.90 930.46
0.00007 -3.80 931.46
0.00011 -3.70 932.46
0.00016 -3.60 933.46
0.00023 -3.50 934.46
0.00820 -2.40 945.46
0.01072 -2.30 946.46
0.01390 -2.20 947.46
0.01786 -2.10 948.46
0.02275 -2.00 949.46
0.02872 -1.90 950.46
0.03593 -1.80 951.46
0.04457 -1.70 952.46
0.05480 -1.60 953.46
0.06681 -1.50 954.46
0.08076 -1.40 955.46
0.09680 -1.30 956.46
0.11507 -1.20 957.46
0.13567 -1.10 958.46
0.15866 -1.00 959.46
0.18406 -0.90 960.46
0.21186 -0.80 961.46
0.24196 -0.70 962.46
0.65542 0.40 973.46
0.69146 0.50 974.46
0.72575 0.60 975.46
0.75804 0.70 976.46
0.78814 0.80 977.46
0.81594 0.90 978.46
0.84134 1.00 979.46
0.86433 1.10 980.46
0.88493 1.20 981.46
0.90320 1.30 982.46
0.91924 1.40 983.46
0.93319 1.50 984.46
0.94520 1.60 985.46
0.99653 2.70 996.46
0.99744 2.80 997.46
0.99813 2.90 998.46
0.99865 3.00 999.46
-5.00
-4.00
-3.00
4.00
5.00
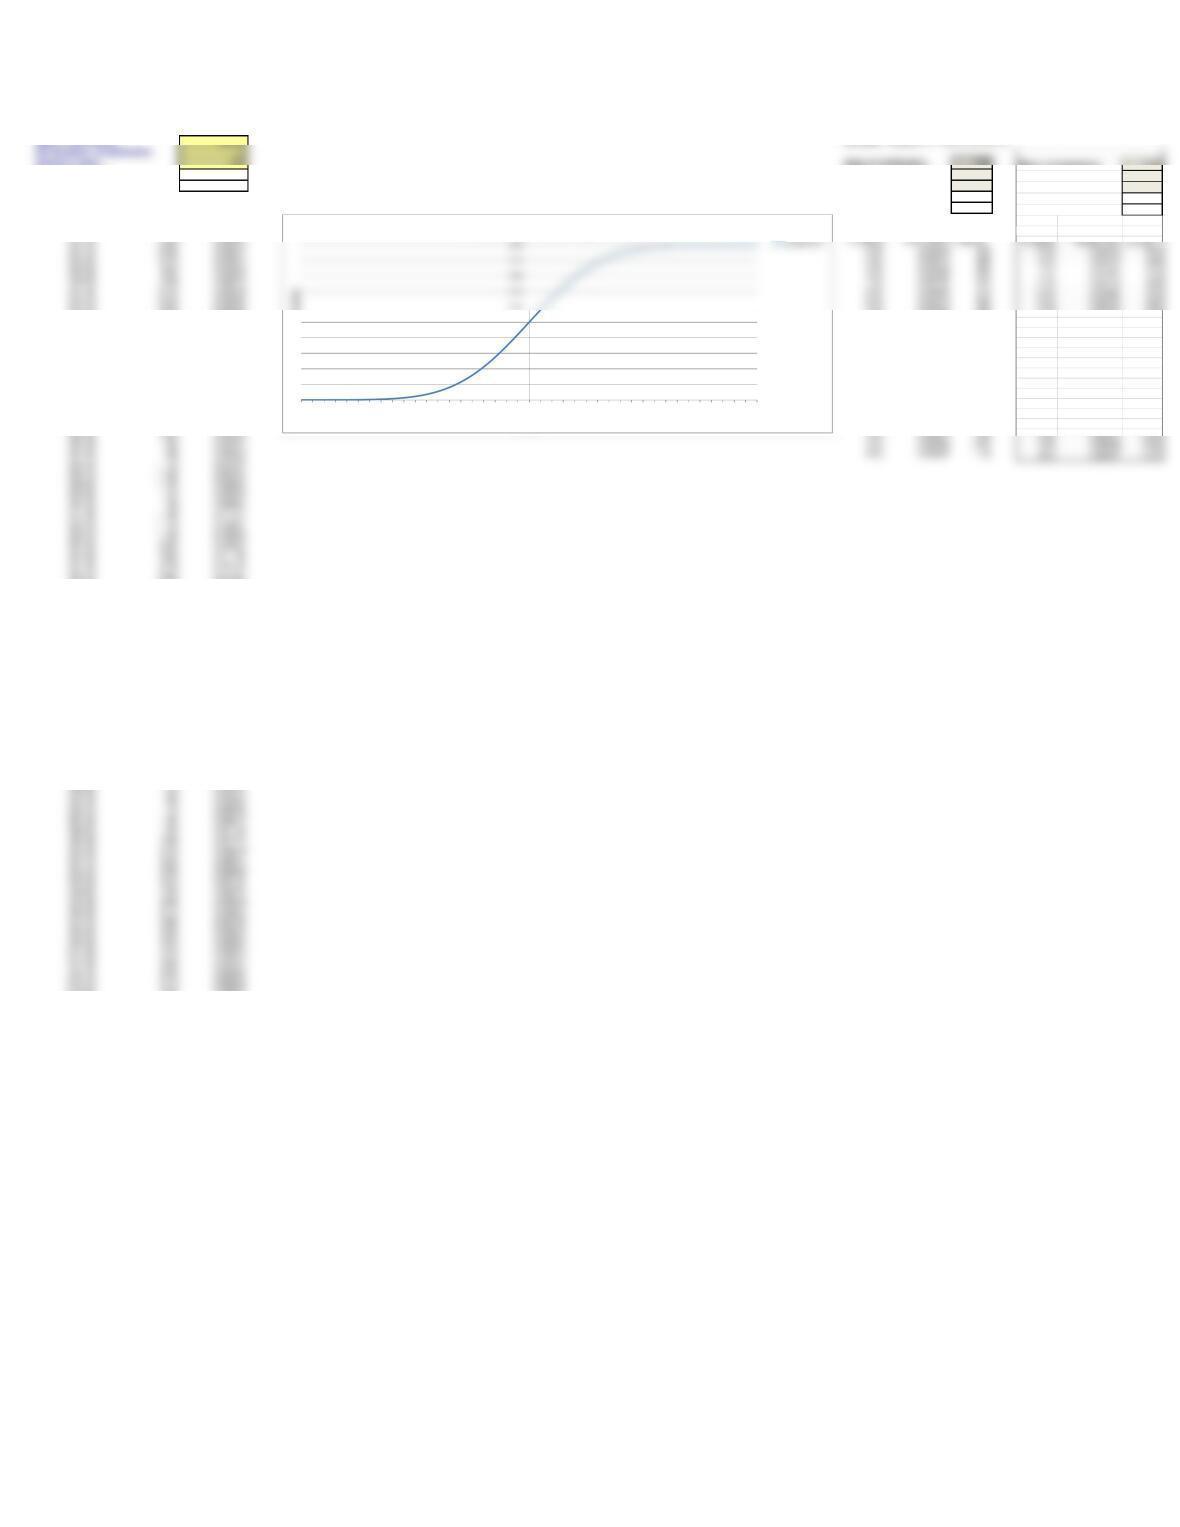
Z Values vs. Probability
0.99903 3.10 1000.46
0.99931 3.20 1001.46
0.99952 3.30 1002.46
0.99966 3.40 1003.46
0.99977 3.50 1004.46
0.99984 3.60 1005.46
0.99989 3.70 1006.46
0.99993 3.80 1007.46
0.99995 3.90 1008.46
0.99997 4.00 1009.46
Problem 5 – Check Solution
Tio Anciano
NOTE: This calculation is only possible after solving for the process mean for the problem,
It allows us to check whether the calculated z-value, corresponding to the desired x=990, is correct, given that we will only have a 2% probability of overflow.
Probability Calculations Using the Normal Distribution – Template
Enter data only in the shaded cells
This spreadsheet is designed to calculate the probability of values equal to, or less than, a desired x value,
given the mean and standard deviation of a normally distributed variable. It uses the cumulative normal distribution
Enter the mean of the distribution in shaded cell D8 and the standard deviation in shaded cell D9. below.
Enter the desired X-value in shaded cell D10, below. The calculated z-value and probability will be seen in D11 and D12.
Mean of distribution 969.46 NORMAL PROBABILITY CALCULATIONS
Desired x-value 990 Mean of distribution 1020
Calculated z-value 2.05 Std Dev of distribution 20
Probability of x, or less 0.98001 Desired x-value 1044
Calculated z-value 1.20
(X-axis) Probability Using Prob. of x, or less 0.88493
Desired x-values
Equivalent – Z Values
NORMS.DIST
929.46 -4.00 0.00003 Equivalent Probability Using Desired
937.46 -3.20 0.00069 -1.60 0.05480 988
938.46 -3.10 0.00097 -1.20 0.11507 996
939.46 -3.00 0.00135 -0.80 0.21186 1004
940.46 -2.90 0.00187 -0.40 0.34458 1012
941.46 -2.80 0.00256 0.00 0.50000 1020
942.46 -2.70 0.00347 0.40 0.65542 1028
943.46 -2.60 0.00466 0.80 0.78814 1036
944.46 -2.50 0.00621 1.20 0.88493 1044
945.46 -2.40 0.00820 1.60 0.94520 1052
946.46 -2.30 0.01072 2.00 0.97725 1060
947.46 -2.20 0.01390 2.40 0.99180 1068
948.46 -2.10 0.01786 2.80 0.99744 1076
964.46 -0.50 0.30854
965.46 -0.40 0.34458
966.46 -0.30 0.38209
967.46 -0.20 0.42074
968.46 -0.10 0.46017
969.46 0.00 0.50000
970.46 0.10 0.53983
971.46 0.20 0.57926
972.46 0.30 0.61791
973.46 0.40 0.65542
974.46 0.50 0.69146
975.46 0.60 0.72575
976.46 0.70 0.75804
977.46 0.80 0.78814
978.46 0.90 0.81594
979.46 1.00 0.84134
980.46 1.10 0.86433
981.46 1.20 0.88493
982.46 1.30 0.90320
983.46 1.40 0.91924
1004.46 3.50 0.99977
1005.46 3.60 0.99984
1006.46 3.70 0.99989
1007.46 3.80 0.99993
1008.46 3.90 0.99995
1009.46 4.00 0.99997
0.00
0.10
0.20
0.30
0.40
0.50
-4.0-3.8-3.6-3.4-3.2-3.0-2.8-2.6-2.4-2.2-2.0-1.8-1.6-1.4-1.2-1.0-0.8-0.6-0.4-0.2 0.0 0.2 0.4 0.6 0.8 1.0 1.2 1.4 1.6 1.8 2.0 2.2 2.4 2.6 2.8 3.0 3.2 3.4 3.6 3.8 4.0
Cumulative Probability
z-values
Cumulative Probability Function
Mean of distribution 1020
Std Dev of distribution 20
Desired x-value 1044
Calculated z-value 1.20
Prob. of x, or less 0.88493
Equivalent
Probability Using
Desired
–1.60 0.05480 988
–1.20 0.11507 996
–0.80 0.21186 1004
–0.40 0.34458 1012
0.00 0.50000 1020
0.40 0.65542 1028
0.80 0.78814 1036
1.20 0.88493 1044
1.60 0.94520 1052
2.00 0.97725 1060
2.40 0.99180 1068
2.80 0.99744 1076
Std deviation of distribution 10
Problem 5 – Check Solution
Tio Anciano
NOTE: This calculation is only possible after solving for the process mean for the problem,
It allows us to check whether the calculated mean is correct, given that we will only have a 2% probability of overflow.
X-value Calculations Given Probabilities Using the Inverse Normal Distribution – Template
This spreadsheet is designed to calculate the X-value based on probability of values equal to, or less than a desired x value,
of a normally distributed variable. It requires input of a known mean and standard deviation and uses the inverse of the cumulative normal distribution
Enter the mean of the distribution in cell D8 and the standard deviation in cell D9, below.
Enter the desired probability in cell D10, and the calculated x-value will be seen in D11.
Mean of distribution 969.46
10
Probability of X or less 0.98
Calculated X-Value 990.00 Calculated Given
x-values Probability
Calculated x-values
Probability 939.46 0.00135
929.46 0.00003 949.46 0.02275
930.46 0.00005 959.46 0.15866
931.46 0.00007 969.46 0.50000
932.46 0.00011 979.46 0.84134
933.46 0.00016 979.46 0.84134
945.46 0.00820
946.46 0.01072
947.46 0.01390
948.46 0.01786
949.46 0.02275 Truncated
950.46 0.02872 x-values Probability
951.46 0.03593 929.46 0.00003
952.46 0.04457 939.46 0.00135
953.46 0.05480 949.46 0.02275
954.46 0.06681 959.46 0.15866
963.46 0.27425
964.46 0.30854
965.46 0.34458
966.46 0.38209
967.46 0.42074
968.46 0.46017
969.46 0.50000
970.46 0.53983
971.46 0.57926
972.46 0.61791
973.46 0.65542
974.46 0.69146
975.46 0.72575
976.46 0.75804
988.46 0.97128
989.46 0.97725
990.46 0.98214
991.46 0.98610
992.46 0.98928
993.46 0.99180
994.46 0.99379
995.46 0.99534
996.46 0.99653
997.46 0.99744
998.46 0.99813
999.46 0.99865
1000.46 0.99903
Std Dev of distribution
0.600
0.700
0.800
0.900
1.000
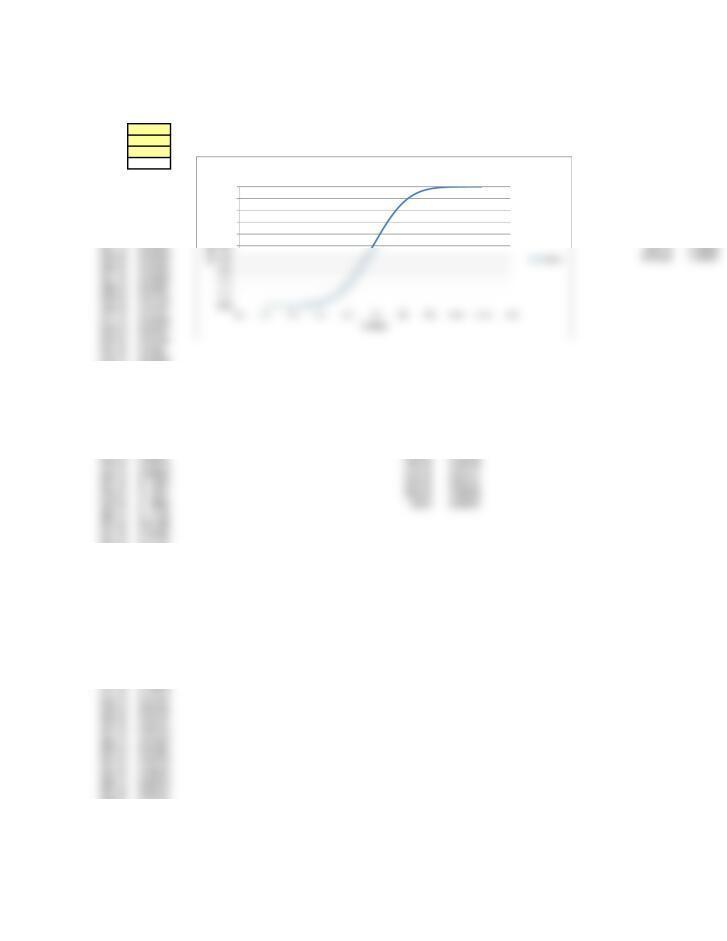
X-values vs. Cumulative Probability
1001.46 0.99931
1002.46 0.99952
1003.46 0.99966
1004.46 0.99977
1005.46 0.99984
1006.46 0.99989
1007.46 0.99993
1008.46 0.99995
1009.46 0.99997