Problem 6-07 – Instructor Reserve
Cheez-D-Lites
This spreadsheet is designed to calculate the X-value based on probability of values equal to, or less than a desired x value,
of a normally distributed variable. It requires input of a known mean and standard deviation and uses the inverse of the cumulative normal distribution
Enter the mean of the distribution in cell D8 and the standard deviation in cell D9, below.
Enter the desired probability in cell D10, and the calculated x-value will be seen in D11.
Mean of distribution 412
10
Probability of X or less 0.05
Calculated X-Value 395.55 Calculated Given
x-values Probability
Calculated x-values Probability 382 0.00135
382.000 0.00135
383.000 0.00187
384.000 0.00256
385.000 0.00347
386.000 0.00466
387.000 0.00621
388.000 0.00820
403.000 0.18406
404.000 0.21186
405.000 0.24196
406.000 0.27425
407.000 0.30854
408.000 0.34458
409.000 0.38209
410.000 0.42074
411.000 0.46017
412.000 0.50000
413.000 0.53983
414.000 0.57926
415.000 0.61791
416.000 0.65542
417.000 0.69146
418.000 0.72575
419.000 0.75804
420.000 0.78814
421.000 0.81594
422.000 0.84134
423.000 0.86433
440.000 0.99744
441.000 0.99813
442.000 0.99865
443.000 0.99903
444.000 0.99931
445.000 0.99952
446.000 0.99966
Std Dev of distribution
0.000
0.100
1.000
370.000 380.000 390.000 400.000 410.000 420.000 430.000 440.000 450.000 460.000
X-values
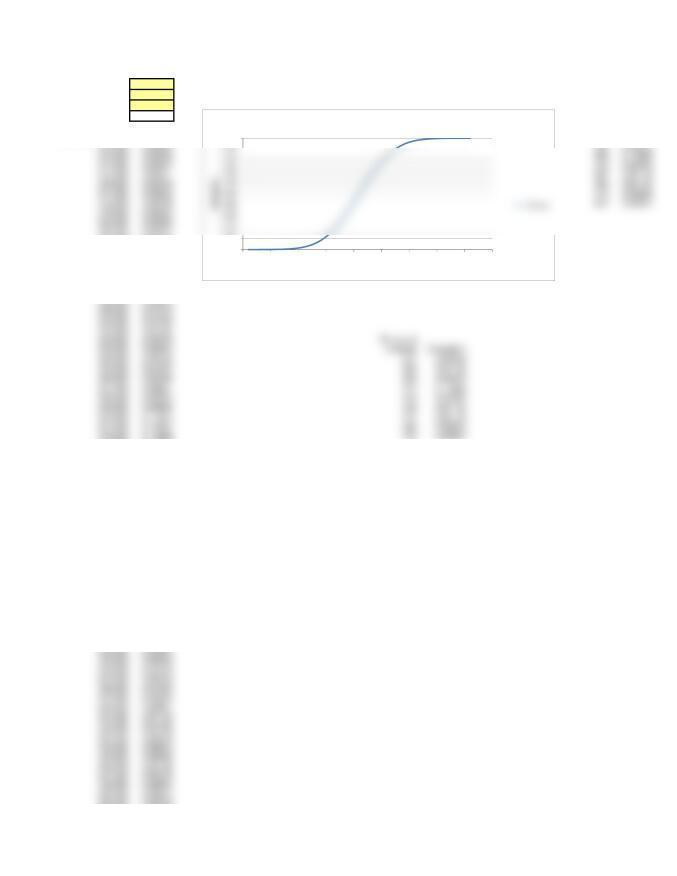
X-values vs. Cumulative Probability
447.000 0.99977
448.000 0.99984
449.000 0.99989
450.000 0.99993
451.000 0.99995
452.000 0.99997
Problem 6-07 – Check Calculation
Cheez-D-Lites
It allows us to discover the z-value, corresponding to a 5% probability of underfilling.
Z and X-value Calculations Given Probabilites, Using the Inverse Normal Distribution – Template
This spreadsheet is designed to calculate the z-value based on probability of values equal to, or less than,
an equivalent x-value of a normally distributed variable. It uses the inverse of the cumulative normal distribution.
Enter the desired probability of the Z-value or less in the shaded cell D8, below.
The calculated z-value will be seen in cell D9.
Probability of x-value, or less 0.05000
Calculated z-value -1.645
Calculated Equivalent
Probability Z Values x-values
0.00003 -4.00 372.000
0.00005 -3.90 373.000
0.00007 -3.80 374.000
0.00820 -2.40 388.000
0.01072 -2.30 389.000
0.01390 -2.20 390.000
0.01786 -2.10 391.000
0.02275 -2.00 392.000
0.02872 -1.90 393.000
0.03593 -1.80 394.000
0.04457 -1.70 395.000
0.05480 -1.60 396.000
0.06681 -1.50 397.000
0.08076 -1.40 398.000
0.09680 -1.30 399.000
0.11507 -1.20 400.000
0.13567 -1.10 401.000
0.75804 0.70 419.000
0.78814 0.80 420.000
0.81594 0.90 421.000
0.84134 1.00 422.000
0.86433 1.10 423.000
0.88493 1.20 424.000
0.90320 1.30 425.000
0.91924 1.40 426.000
0.93319 1.50 427.000
0.94520 1.60 428.000
0.95543 1.70 429.000
0.96407 1.80 430.000
0.97128 1.90 431.000
0.99379 2.50 437.000
0.99534 2.60 438.000
0.99653 2.70 439.000
0.99744 2.80 440.000
-5.00
-4.00
-3.00
5.00
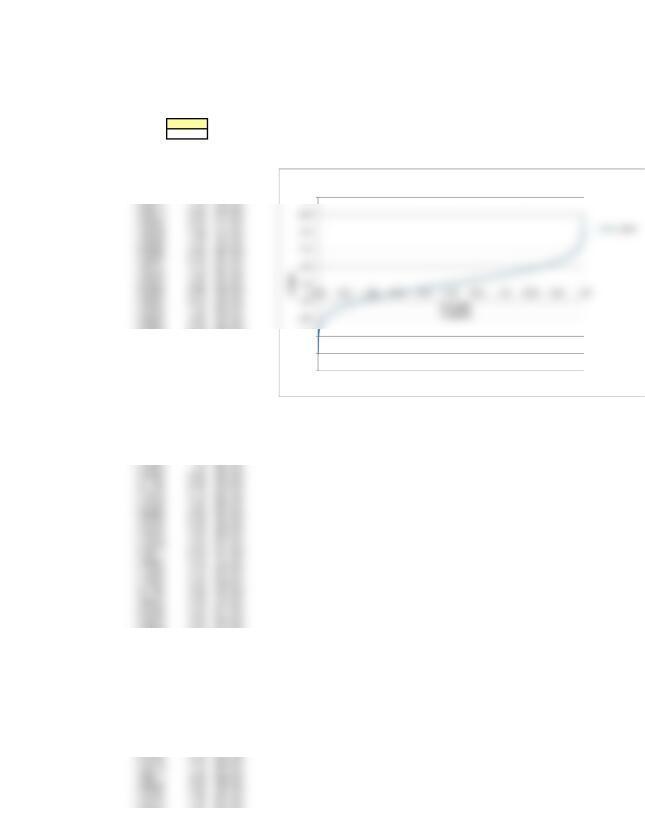
Z Values vs. Probability
0.99813 2.90 441.000
0.99865 3.00 442.000
0.99903 3.10 443.000
0.99931 3.20 444.000
0.99952 3.30 445.000
0.99966 3.40 446.000
0.99977 3.50 447.000
0.99984 3.60 448.000
0.99989 3.70 449.000
0.99993 3.80 450.000
0.99995 3.90 451.000
0.99997 4.00 452.000
Problem 6-07
Cheez-D-Lites
NOTE: This calculation is only possible after solving for the x–value for the problem,
It allows us to check whether the calculated z-value, corresponding to the desired x=395.55, is correct, given that we will only have a 5% probability of underfilling.
Probability Calculations Using the Normal Distribution – Template
Enter data only in the shaded cells
This spreadsheet is designed to calculate the probability of values equal to, or less than, a desired x value,
given the mean and standard deviation of a normally distributed variable. It uses the cumulative normal distribution
Enter the mean of the distribution in shaded cell D8 and the standard deviation in shaded cell D9. below.
Enter the desired X-value in shaded cell D10, below. The calculated z-value and probability will be seen in D11 and D12.
Mean of distribution 412 NORMAL PROBABILITY CALCULATIONS
Std deviation of distribution 10
Desired x-value 395.55 Mean of distribution 1020
Calculated z-value -1.645 Std Dev of distribution 20
Probability of x, or less 0.04998 Desired x-value 1044
Calculated z-value 1.20
(X-axis) Probability Using Prob. of x, or less 0.88493
Desired x–values
Equivalent – Z Values NORMS.DIST
372.000 -4.00 0.00003 Equivalent Probability Using Desired
373.000 -3.90 0.00005 Z Values NORM.DIST x–values
384.000 -2.80 0.00256 0.00 0.50000 1020
385.000 -2.70 0.00347 0.40 0.65542 1028
386.000 -2.60 0.00466 0.80 0.78814 1036
387.000 -2.50 0.00621 1.20 0.88493 1044
388.000 -2.40 0.00820 1.60 0.94520 1052
389.000 -2.30 0.01072 2.00 0.97725 1060
390.000 -2.20 0.01390 2.40 0.99180 1068
391.000 -2.10 0.01786 2.80 0.99744 1076
392.000 -2.00 0.02275 3.20 0.99931 1084
393.000 -1.90 0.02872 3.60 0.99984 1092
394.000 -1.80 0.03593 4.00 0.99997 1100
395.000 -1.70 0.04457
396.000 -1.60 0.05480
397.000 -1.50 0.06681
415.000 0.30 0.61791
416.000 0.40 0.65542
417.000 0.50 0.69146
418.000 0.60 0.72575
419.000 0.70 0.75804
420.000 0.80 0.78814
421.000 0.90 0.81594
422.000 1.00 0.84134
423.000 1.10 0.86433
424.000 1.20 0.88493
425.000 1.30 0.90320
426.000 1.40 0.91924
427.000 1.50 0.93319
428.000 1.60 0.94520
449.000 3.70 0.99989
450.000 3.80 0.99993
451.000 3.90 0.99995
452.000 4.00 0.99997
0.00
0.10
0.20
0.30
1.00
-4.0-3.8-3.6-3.4-3.2-3.0-2.8-2.6-2.4-2.2-2.0-1.8-1.6-1.4-1.2-1.0-0.8-0.6-0.4-0.2 0.0 0.2 0.4 0.6 0.8 1.0 1.2 1.4 1.6 1.8 2.0 2.2 2.4 2.6 2.8 3.0 3.2 3.4 3.6 3.8 4.0
Cumulative Probability
z-values
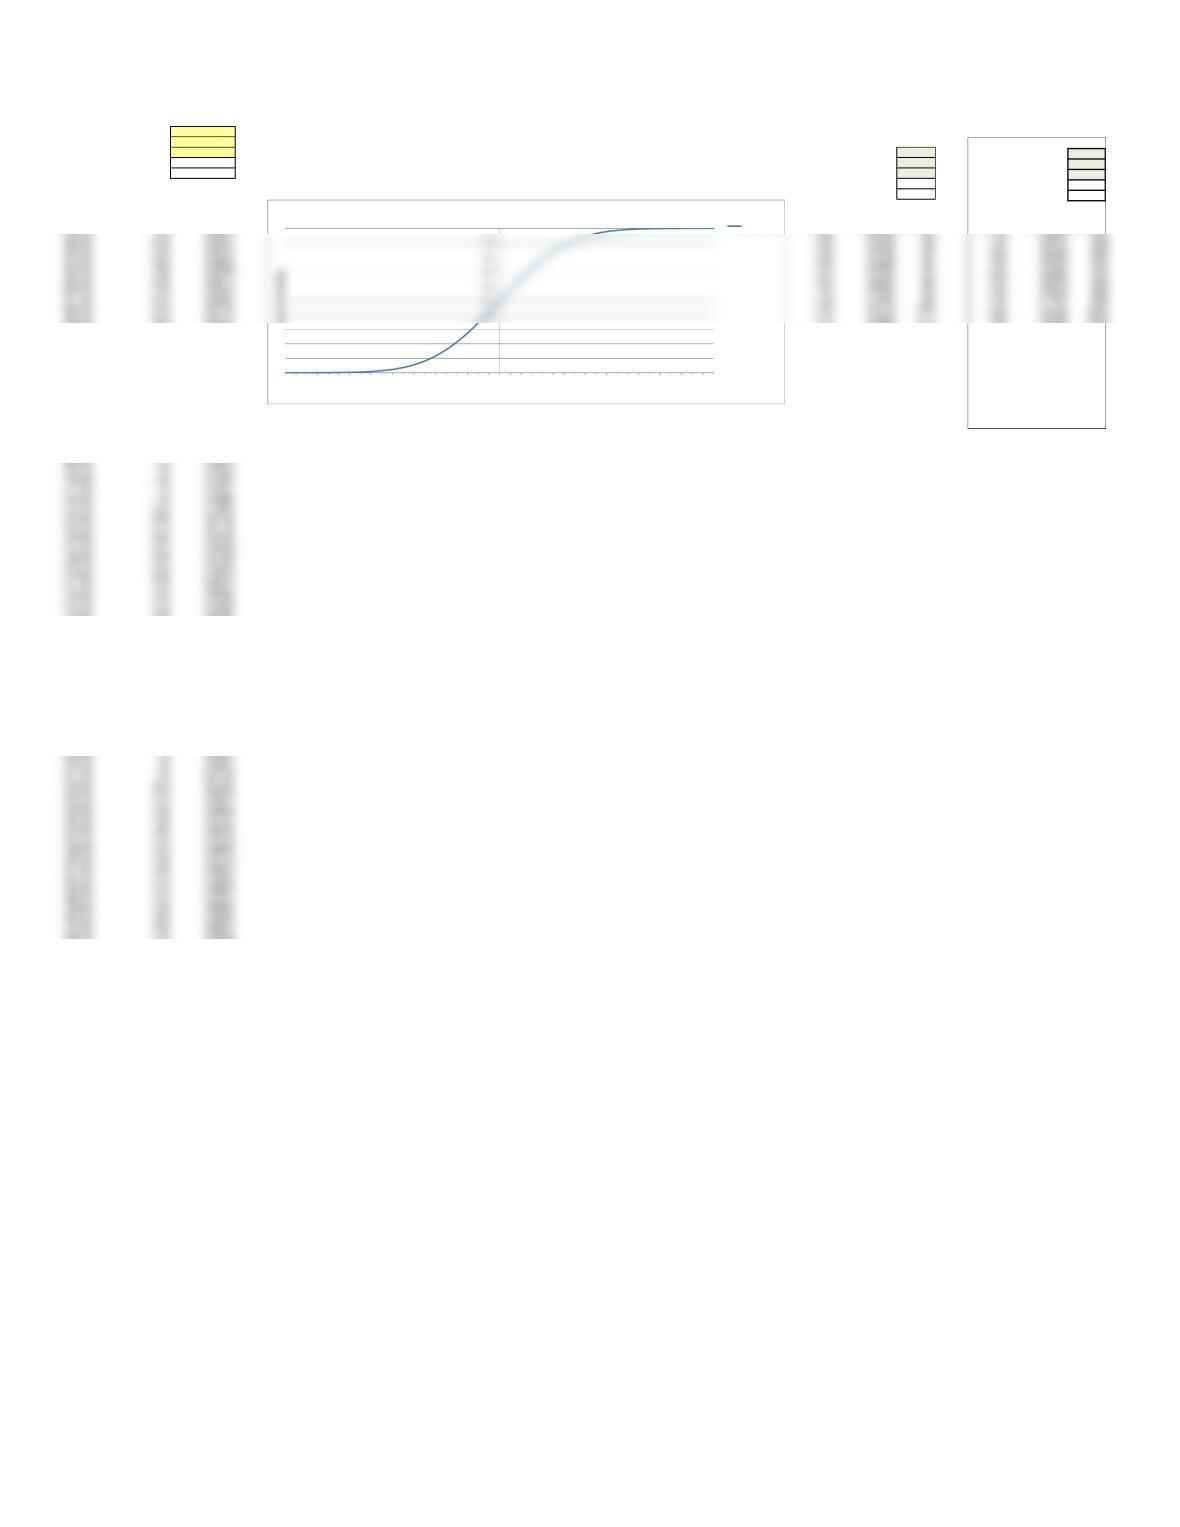
Cumulative Probability Function
NORMS.DIST
Mean of distribution 1020
Std Dev of distribution 20
Desired x-value 1044
Calculated z-value 1.20
Prob. of x, or less 0.88493
Equivalent Probability Using Desired
Z Values NORM.DIST x-values
-0.40 0.34458 1012
0.00 0.50000 1020
0.40 0.65542 1028
0.80 0.78814 1036
1.20 0.88493 1044
1.60 0.94520 1052
2.00 0.97725 1060
2.40 0.99180 1068
2.80 0.99744 1076
3.20 0.99931 1084
3.60 0.99984 1092
4.00 0.99997 1100